
📌 Today’s Highlights
Today we cover 44 IR announcements. Notable among them: ネオジャパン (3921), アイモバイル (6535), 立川ブライ (7989). Use the table of contents below to navigate to each company.
- 3921|ネオジャパン
- 6535|アイモバイル
- 6592|マブチモーター
- 7989|立川ブライ
- 2198|アイ・ケイ・ケイHD
- 3477|G-フォーライフ
- 5025|G-マーキュリー
- 1758|太洋基礎
- 215A|G-タイミー
- 2375|ギグワークス
- 272A|グリーンクロスHD
- 3031|ラクーンHD
- 3070|G-ジェリービーンズ
- 3248|アールエイジ
- 3491|G-GA TECH
- 350A|G-デジタルグリッド
- 3639|ボルテージ
- 3955|イムラ
- 4422|G-VALUENEX
- 4777|ガーラ
- 5075|アップコン
- 5134|G-POPER
- 6184|鎌倉新書
- 6503|三菱電
- 7095|MacbeeP
- 7131|のむら産業
- 7196|Casa
- 7318|G-セレンディップ
- 7640|トップカルチャ
- 8077|トルク
- 8927|明豊エンター
- 9236|G-ジャパンM&A
- 2345|HODL1
- 2776|新都HD
- 3361|トーエル
- 574A|P-LASSIC
- 6309|巴工業
- 9262|シルバーライフ
- 9658|ビジ太田昭和
- 6264|マルマエ
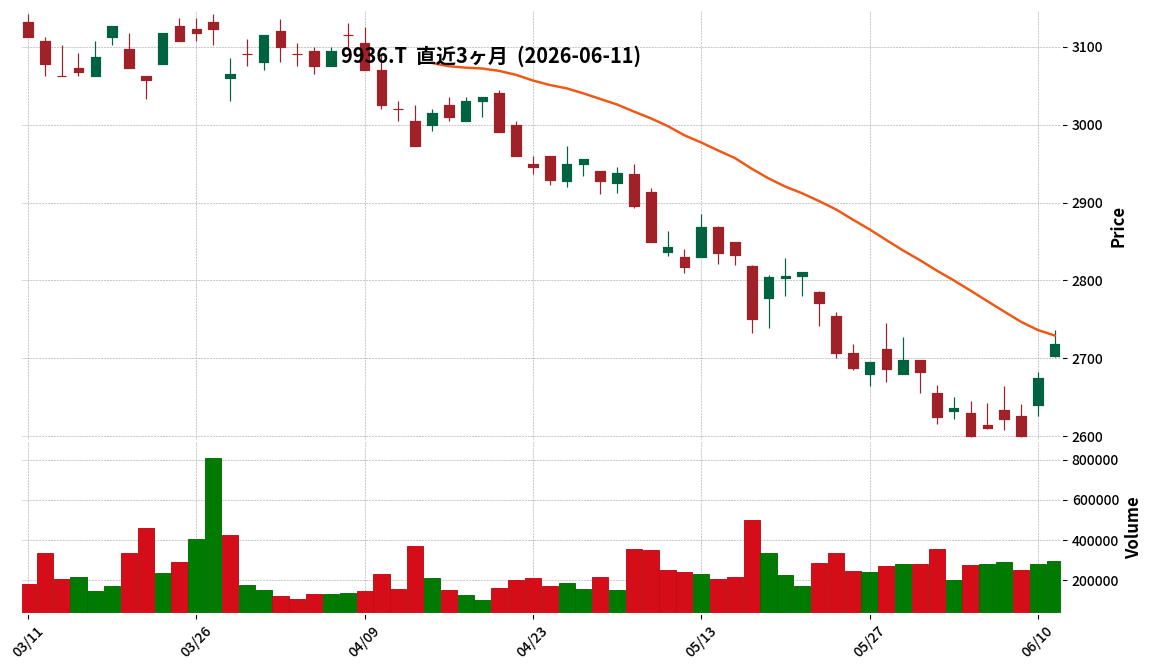
- 9936|王将フード
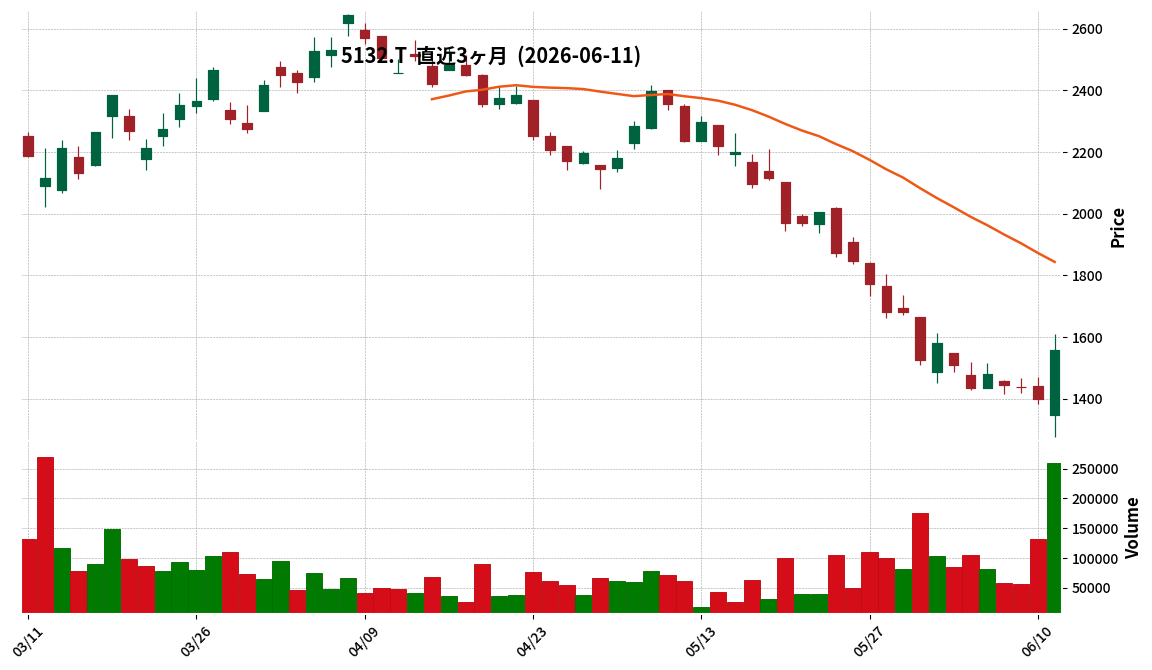
- 5132|G-pluszero
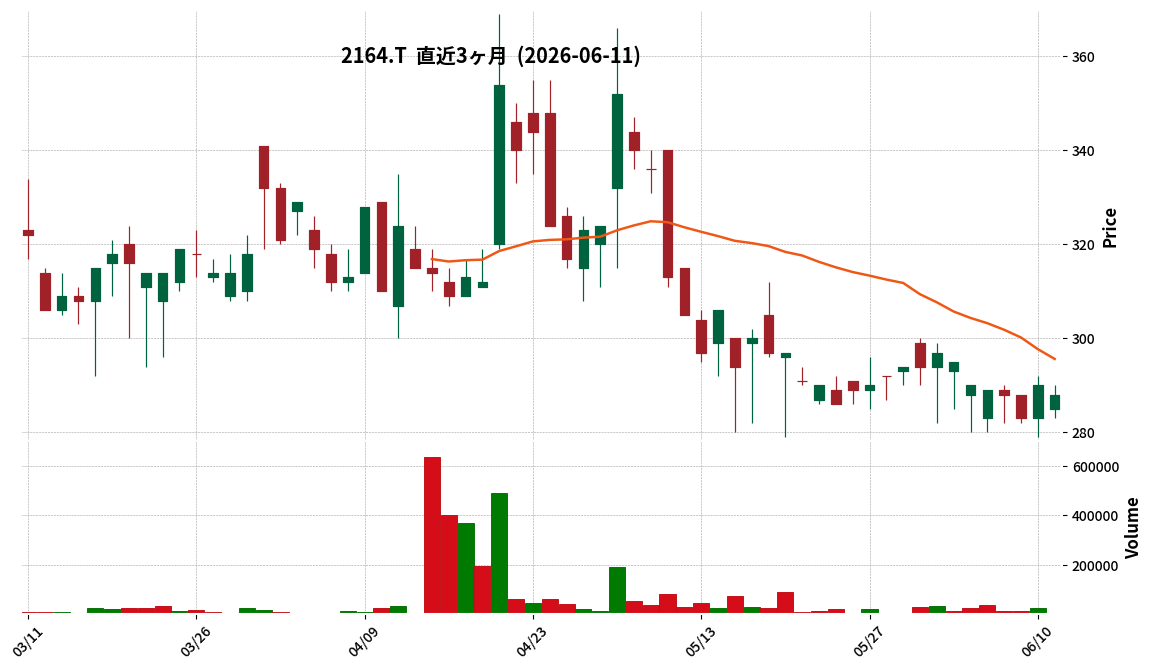
- 2164|地域新聞社
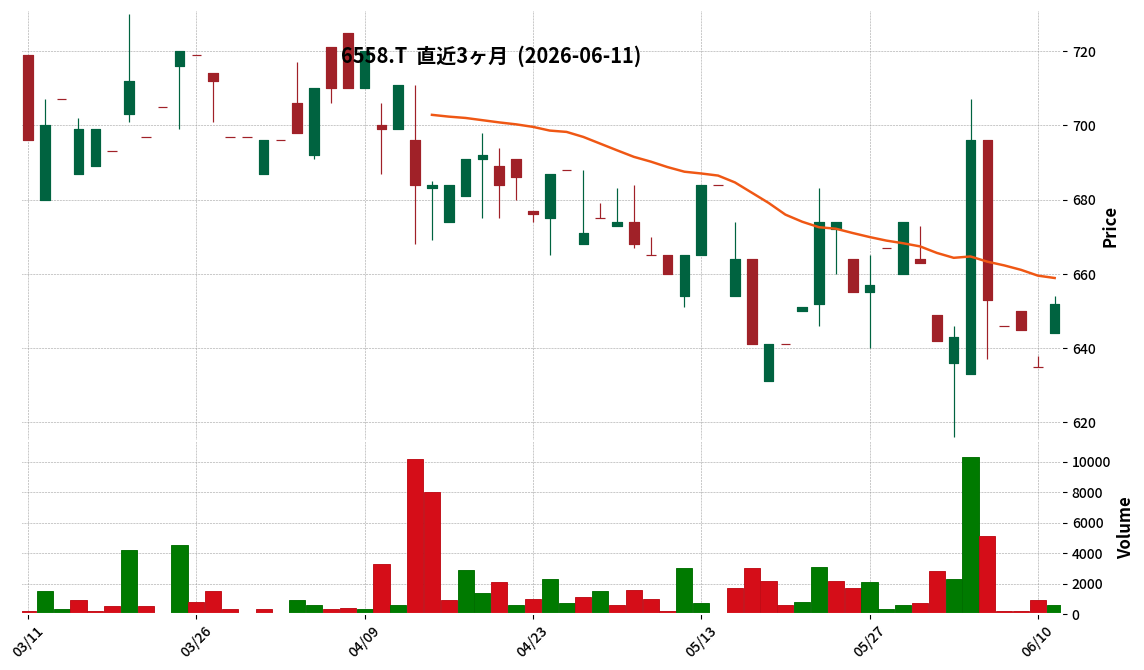
- 6558|G-クックビズ
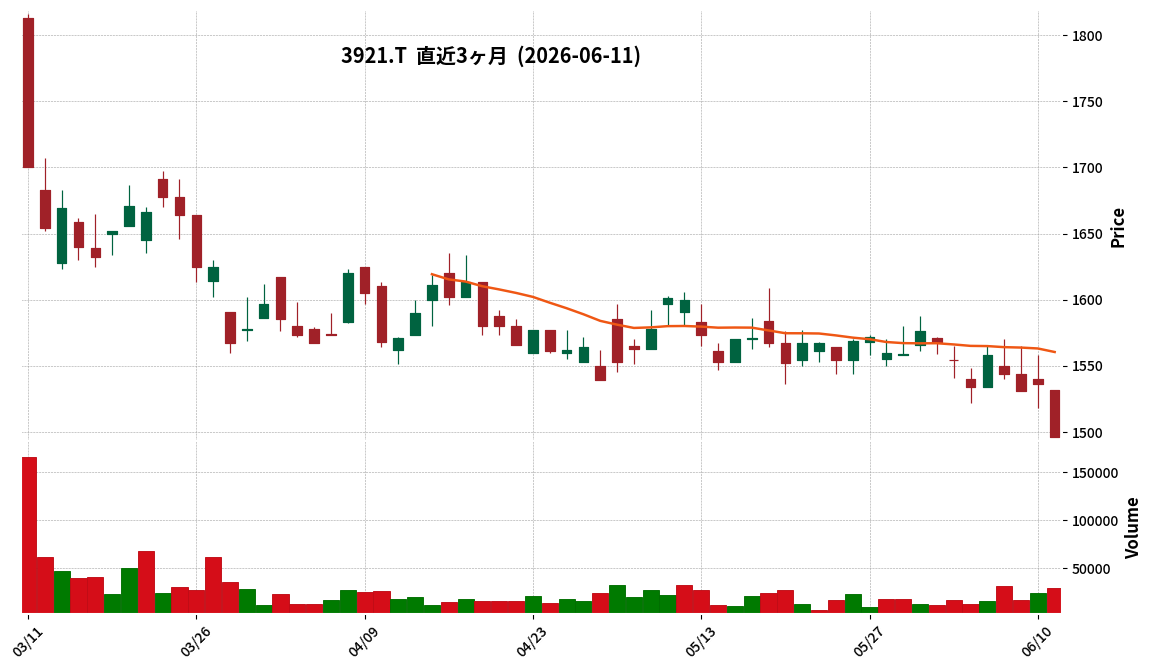
3921|ネオジャパン
1496.0
▼ -2.60%
This article is an AI-generated summary and analysis of official IR disclosures.
📄 Announcement (AI-Reviewed)
- NeoJapan Inc. announced its consolidated financial results for the first quarter of FY2027 (February 1, 2026 – April 30, 2026).
- Consolidated net sales reached ¥2,077 million (up 4.1% year-on-year), operating profit ¥683 million (up 6.2%), ordinary profit ¥713 million (up 9.0%), and net profit attributable to owners of parent ¥487 million (up 9.0%).
- Software business sales amounted to ¥1,581 million (up 5.5%), with cloud services sales totaling ¥1,136 million (up 10.5%).
- Key cloud services saw sales of ¥929 million for “desknet’s NEO Cloud” (up 8.6%), ¥117 million for “AppSuite Cloud” (up 36.2%), and ¥26 million for “ChatLuck Cloud” (up 16.8%).
- The full-year consolidated earnings forecast remains unchanged, projecting net sales of ¥8,619 million (up 4.7% year-on-year) and operating profit of ¥2,680 million (up 7.3%). The annual dividend forecast is also maintained at ¥54.00 (interim ¥27.00, year-end ¥27.00).
🤖 AI Perspective
NeoJapan’s Q1 FY2027 results indicate a solid start to the fiscal year, with all key financial metrics showing year-on-year growth. The robust performance of cloud services within the software business, marked by double-digit growth, suggests a sustained demand for SaaS-based solutions among businesses. The company’s ongoing strategic initiatives in AI-related fields, including business alliances and product enhancements, may be worth monitoring as it navigates the evolving competitive landscape.
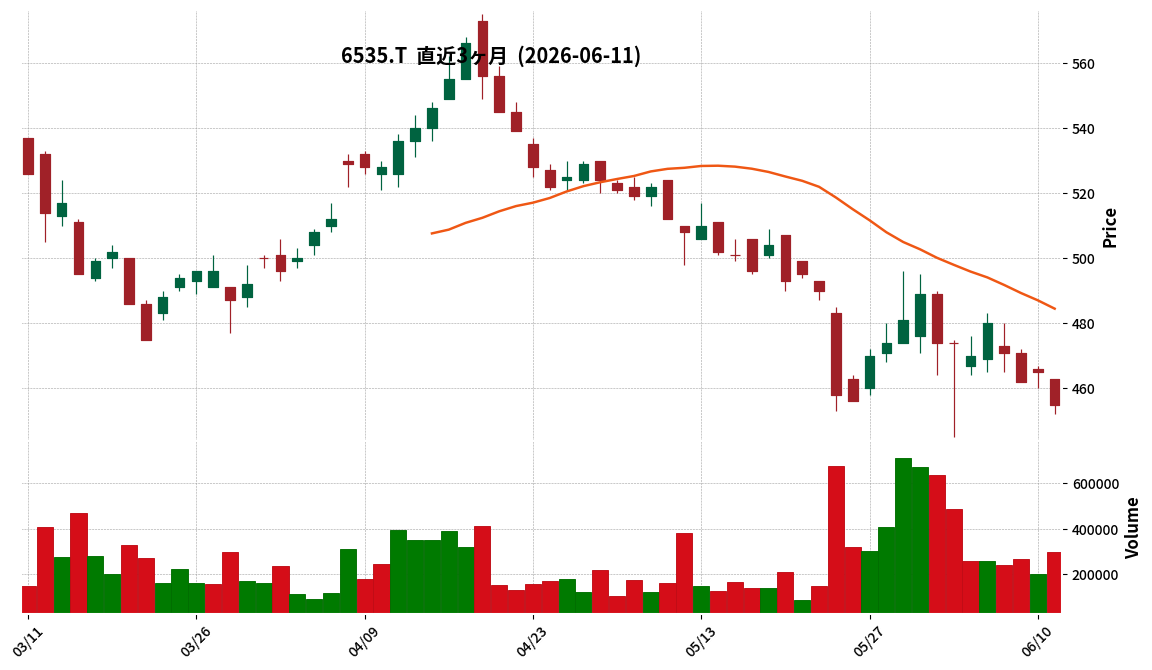
6535|アイモバイル
455.0
▼ -2.15%
This article is an AI-generated summary and analysis of official IR disclosures.
📄 Announcement (AI-Reviewed)
- i-mobile Co., Ltd. announced its consolidated financial results for the third quarter of FY2026 (August 1, 2025 – April 30, 2026).
- Net sales for the cumulative third quarter period reached ¥19,208 million, marking a 3.0% increase year-over-year and setting a new record high.
- Operating profit was ¥3,377 million (down 15.0% YoY), ordinary profit was ¥3,491 million (down 11.8% YoY), and net profit attributable to parent company shareholders was ¥2,438 million (down 16.1% YoY).
- The consolidated full-year forecast for FY2026 remains unchanged, projecting net sales of ¥22,000 million, operating profit of ¥4,500 million, ordinary profit of ¥4,460 million, and net profit attributable to parent company shareholders of ¥3,120 million.
- During the cumulative third quarter, a significant change in the scope of consolidation occurred, with Cyber Consultant Inc. being excluded from consolidation.
🤖 AI Perspective
i-mobile’s Q3 results show a notable divergence between record-high net sales and a decline in profits, which may suggest the impact of strategic investments or shifts in business segment performance. While the Furusato Nozei business shows signs of profit margin recovery due to lower promotional expenses, the ad network business is still in the process of rebuilding its revenue base. The unchanged full-year forecast could indicate management’s confidence in achieving its targets, making the final quarter’s performance worth monitoring.
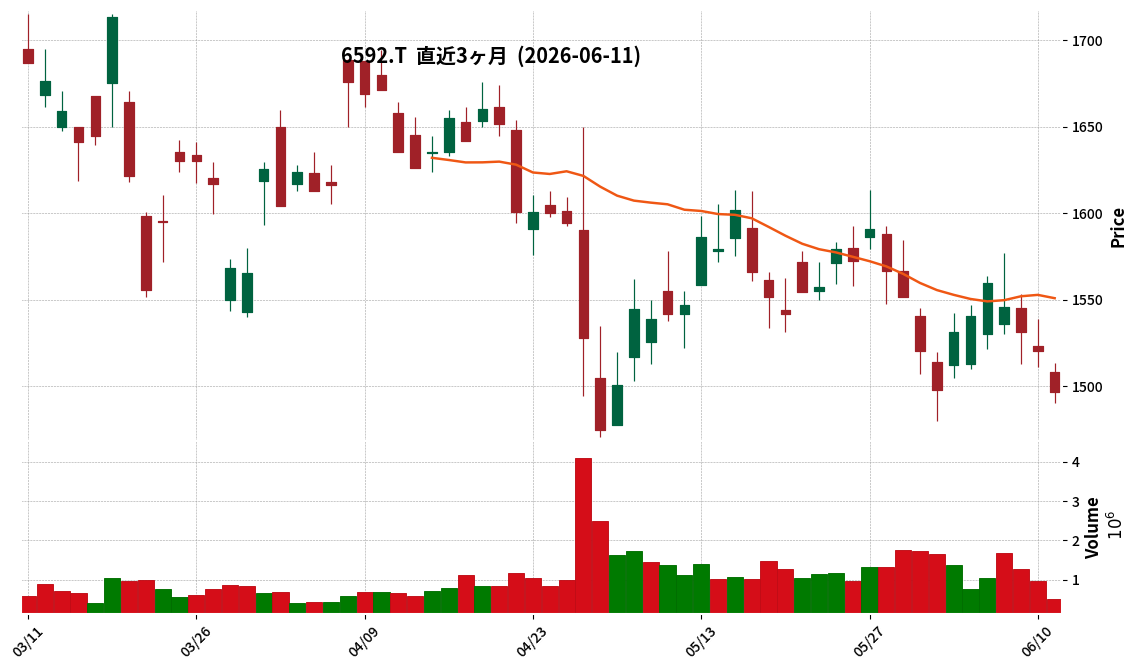
6592|マブチモーター
1496.5
▼ -1.58%
📎 Source:マブチモーター Official IR →
This article is an AI-generated summary and analysis of official IR disclosures.
📄 Announcement (AI-Reviewed)
- Mabuchi Motor Co., Ltd. announced on June 11, 2026, the completion of its acquisition of shares in Masudac Co., Ltd., making it a subsidiary.
- Masudac, established in 1957, is a food machinery manufacturer specializing in confectionery automation, operating both food machinery and food manufacturing businesses.
- The acquisition aims to combine Masudac’s expertise with Mabuchi Motor’s global expansion capabilities and production technology to strengthen overseas development and labor-saving technologies.
- This move is expected to contribute to the business expansion within the three “M” domains (Motion, Machinery, Medical, etc.) under Mabuchi Motor’s “e-MOTO” concept.
- For the fiscal year ended March 2025, Masudac reported consolidated net sales of 14,220 million yen and consolidated operating profit of 881 million yen.
🤖 AI Perspective
This acquisition suggests Mabuchi Motor’s strategic diversification beyond its core motor business into areas related to “motion,” as articulated in its e-MOTO concept. Entering the food machinery sector could indicate an effort to leverage existing production technologies and international presence in new markets. Investors may find it worthwhile to monitor how Masudac’s specialized knowledge and Mabuchi Motor’s resources are integrated and how these synergies are expected to materialize in the future.
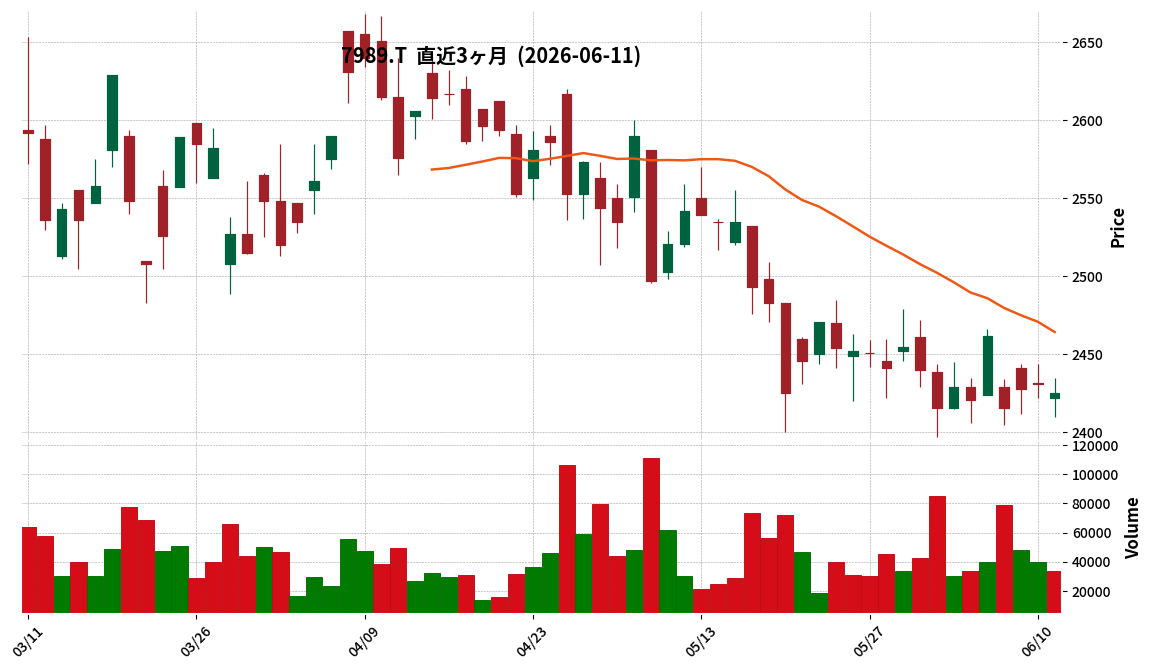
7989|立川ブライ
2425.0
▼ -0.25%
This article is an AI-generated summary and analysis of official IR disclosures.
📄 Announcement (AI-Reviewed)
- Tachikawa Corporation announced the finalization of the financial results for its non-listed parent company, Tachikawa Kousan Co., Ltd., for the fiscal year ended March 2026.
- Tachikawa Kousan Co., Ltd. is an investment company and holds 20.6% of Tachikawa Corporation’s voting rights as an “other affiliated company” (as of December 31, 2025).
- As of March 31, 2026, Tachikawa Kousan Co., Ltd.’s balance sheet shows total assets of ¥1,135,561 thousand and total net assets of ¥1,119,057 thousand.
- For the period from April 1, 2025, to March 31, 2026, the income statement reports net sales of ¥288,211 thousand, operating income of ¥251,383 thousand, ordinary income of ¥253,331 thousand, and net profit of ¥213,421 thousand.
- Major shareholders include Kosei Hogo Hojin Tachikawa Kosei Hogo Zaidan (50.00%) and Kosei Hogo Hojin Kanto Chiho Kosei Hogo Jigyo Kyokai (30.34%).
🤖 AI Perspective
This IR disclosure by Tachikawa Corporation provides transparency regarding the financial performance of its non-listed parent company, Tachikawa Kousan Co., Ltd. While the parent company’s financials, primarily engaged in investment, do not directly impact Tachikawa Corporation’s consolidated results, they offer insights into the broader group’s governance and capital strategy. The fact that the parent company’s major shareholders are rehabilitation aid corporations suggests a unique capital structure that may be worth monitoring for its potential implications on long-term corporate direction.
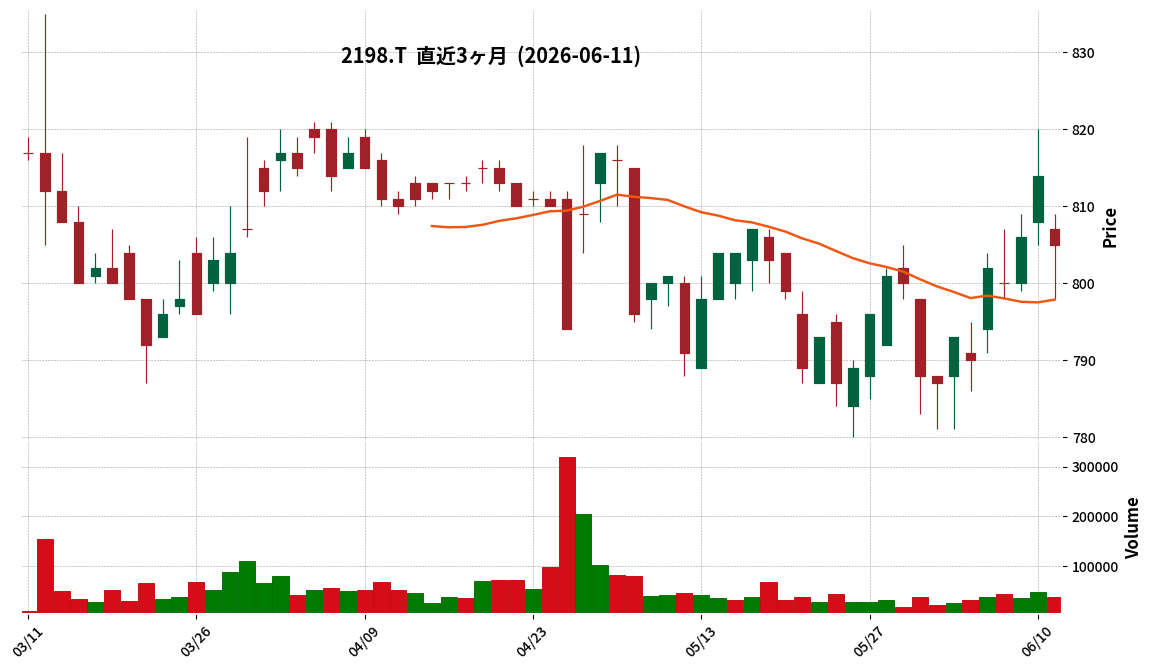
2198|アイ・ケイ・ケイHD
805.0
▼ -1.11%
📎 Source:アイ・ケイ・ケイHD Official IR →
This article is an AI-generated summary and analysis of official IR disclosures.
📄 Announcement (AI-Reviewed)
- IKK Holdings Inc. announced its consolidated financial results for the second quarter (interim period) of the fiscal year ending October 2026.
- For the interim period (November 1, 2025, to April 30, 2026), consolidated net sales were ¥11,022 million (up 4.9% year-on-year), operating profit was ¥577 million (up 60.1% year-on-year), and ordinary profit was ¥663 million (up 74.8% year-on-year).
- Net income attributable to owners of the parent reached ¥494 million (up 150.6% year-on-year).
- Basic earnings per share for the interim period was ¥16.99.
- As for the consolidated financial position, total assets stood at ¥20,269 million, net assets at ¥12,078 million, and the equity ratio was 59.3%.
- The full-year consolidated earnings forecast for the fiscal year ending October 2026 remains unchanged from the most recently announced figures: net sales of ¥22,850 million, operating profit of ¥1,200 million, ordinary profit of ¥1,175 million, and net income attributable to owners of the parent of ¥720 million, with basic earnings per share of ¥25.02.
- By segment, Wedding Business net sales increased by 3.2% to ¥10,043 million, and operating profit increased by 12.1% to ¥820 million. Nursing Care Business net sales increased by 2.3% to ¥331 million, and operating profit increased by 85.2% to ¥27 million. Food Business net sales increased by 121.9% to ¥489 million, recording an operating profit of ¥66 million compared to an operating loss of ¥18 million in the prior year period. Photo Business net sales increased by 31.6% to ¥534 million, but operating profit decreased by 76.7% to ¥18 million.
🤖 AI Perspective
The interim period results show a substantial increase in all profit metrics compared to the previous year, with a notable surge in net income attributable to owners of the parent. While the food business successfully turned a loss into a profit, the photo business, despite increased sales, saw a decrease in operating profit, which might warrant closer examination by investors. The company’s decision to maintain its full-year forecast could suggest a cautious outlook on the upcoming business environment or future operational developments.
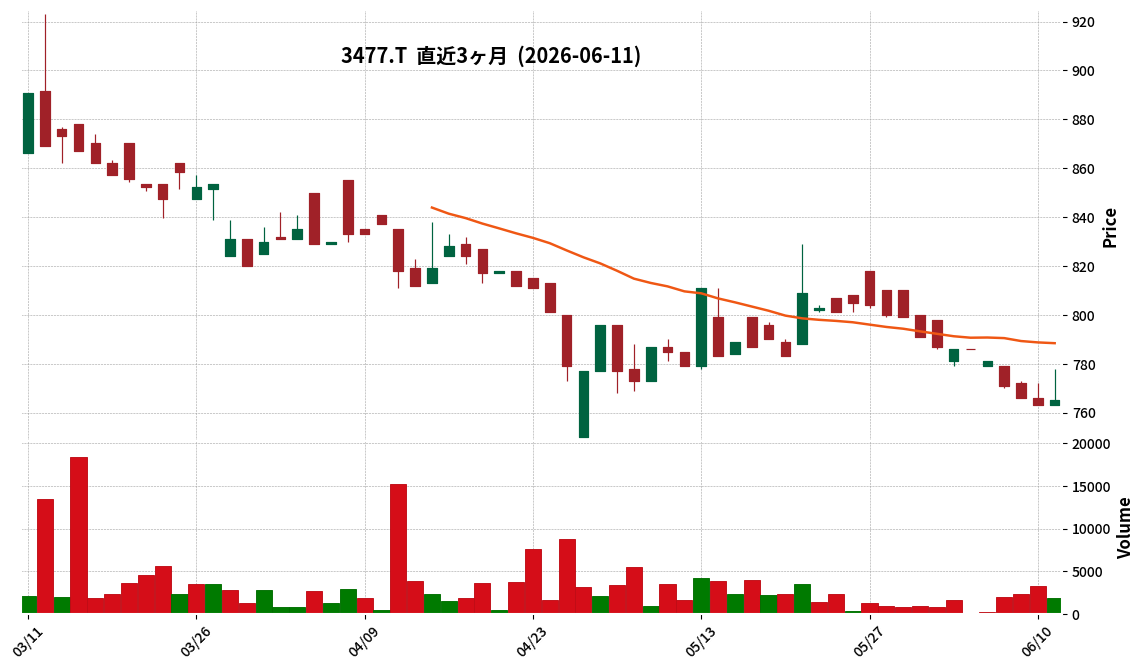
3477|G-フォーライフ
765.0
▲ +0.26%
📎 Source:G-フォーライフ Official IR →
This article is an AI-generated summary and analysis of official IR disclosures.
📄 Announcement (AI-Reviewed)
- G-FORLIFE has resolved to implement a 10th-anniversary shareholder benefit for shareholders of record as of September 30, 2026, and March 31, 2027.
- This special benefit will award 10,000 shareholder benefit points each, totaling 20,000 points, to shareholders holding 1,000 shares or more in the “FORLIFE Premium Shareholder Benefit Club” on each record date.
- The existing regular shareholder benefit program, with a record date of March 31 each year, will continue in parallel. The regular benefit points for the March 31, 2027 record date will be combined with the anniversary benefit points.
- Amazon Gift Cards will be added to the lineup of shareholder benefit items, starting with the shareholder benefit program for the record date of September 30, 2026. Exchange is scheduled to begin in late November 2026, with 1 point equivalent to 1 yen for Amazon Gift Cards.
- The company stated that the impact of this anniversary shareholder benefit on its business performance is minor.
🤖 AI Perspective
The implementation of a 10th-anniversary shareholder benefit may serve to reinforce loyalty among existing shareholders and attract new investors by demonstrating a commitment to shareholder returns. The addition of Amazon Gift Cards to the benefit options could enhance flexibility and appeal for shareholders, providing a widely recognized and utilized reward. The expansion of choices for utilizing shareholder benefit points often indicates an effort to increase the perceived value of the program.
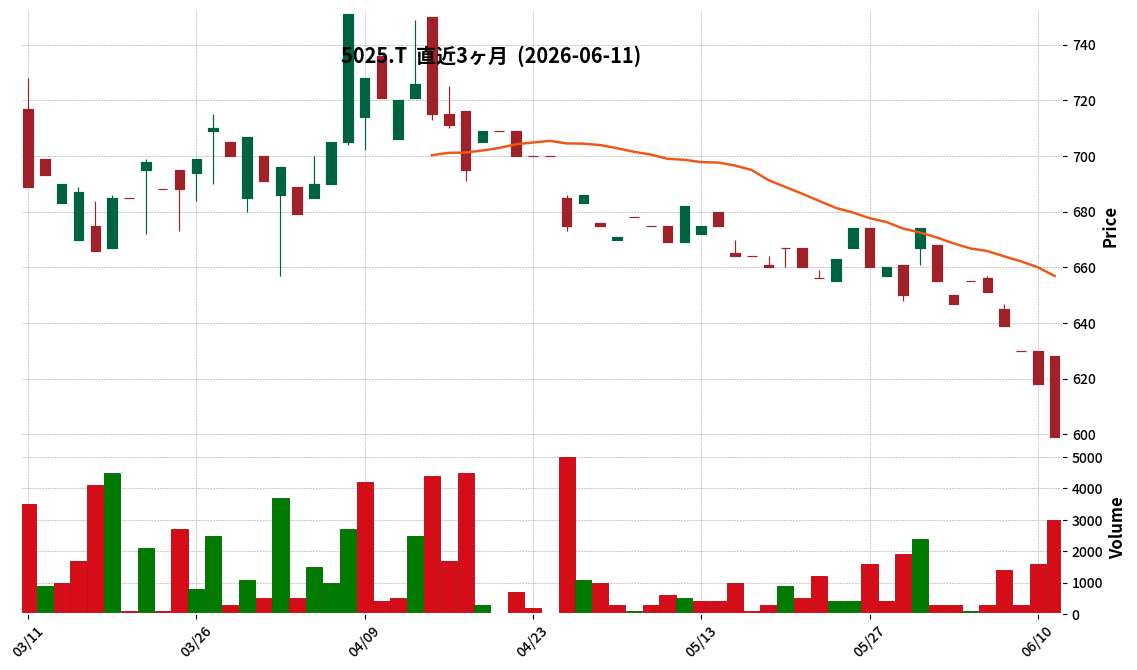
5025|G-マーキュリー
599.0
▼ -3.07%
📎 Source:G-マーキュリー Official IR →
This article is an AI-generated summary and analysis of official IR disclosures.
📄 Announcement (AI-Reviewed)
- G-Mercury Co., Ltd. announced the disclosure of its parent company, GA technologies Co., Ltd.’s financial results for the second quarter (interim) of the fiscal year ending October 2026.
- G-Mercury’s estimated performance figures are included from page 3 onwards in GA technologies’ financial presentation materials.
- The reason G-Mercury’s performance is presented as an estimate is due to the difference in fiscal year-ends between G-Mercury (February) and its parent company (October), making it impossible to finalize G-Mercury’s results by GA technologies’ reporting date of April 30, 2026.
- G-Mercury’s full-year financial results are scheduled to be disclosed in mid-April 2027.
- As of April 30, 2026, GA technologies Co., Ltd. has a capital of JPY 9,967,798,616 and holds a 53.36% voting rights stake in G-Mercury (as of February 28, 2026).
🤖 AI Perspective
This announcement provides initial estimated performance figures for G-Mercury via its parent company’s financial report, which may be of interest to investors tracking the company since its acquisition. While these figures are not finalized due to differing fiscal year-ends, they offer an early indication of G-Mercury’s performance as a consolidated subsidiary. Investors will likely monitor future disclosures for G-Mercury’s finalized full-year results to gain a comprehensive understanding.
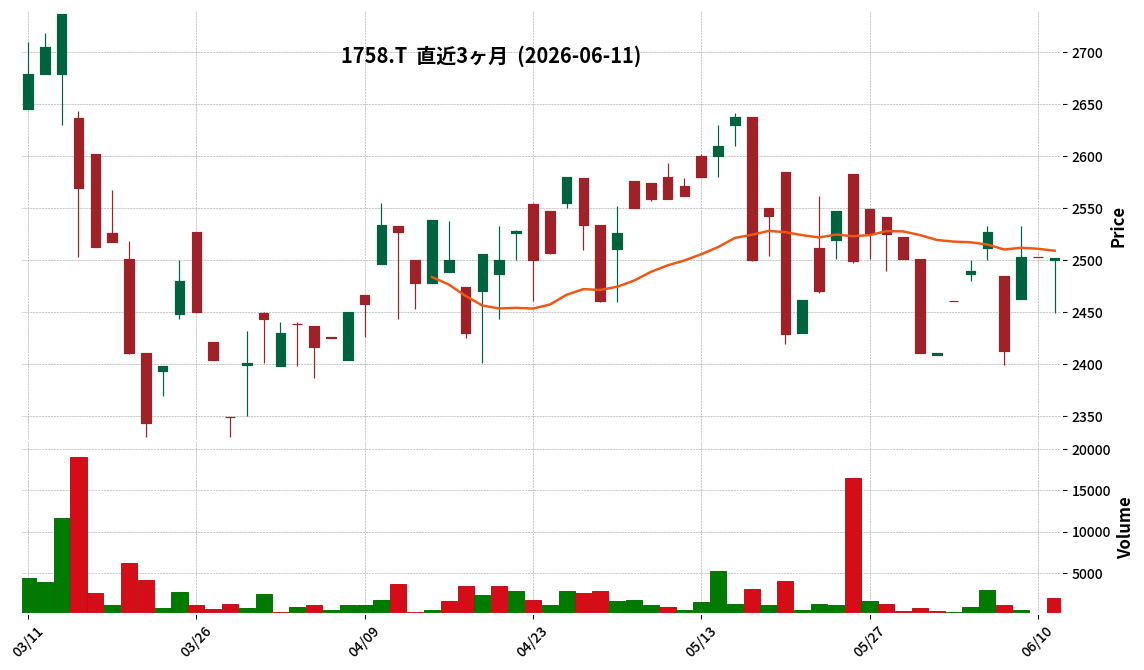
1758|太洋基礎
2502.0
▼ -0.04%
This article is an AI-generated summary and analysis of official IR disclosures.
📄 Announcement (AI-Reviewed)
- Taiyo Kiso announced its non-consolidated financial results for the first quarter of FY2027 (February 1, 2026 – April 30, 2026).
- Net sales for the quarter were ¥3,891 million, a 0.6% increase compared to the same period of the previous year.
- Operating profit reached ¥335 million, marking a 57.9% increase year-on-year.
- Ordinary profit was ¥350 million, up 61.4% from the prior year’s first quarter.
- Quarterly net income was ¥236 million, an increase of 53.5% year-on-year.
- Basic earnings per share for the quarter were ¥118.44.
- As of the end of the first quarter, total assets stood at ¥12,797 million, net assets at ¥9,669 million, and the equity ratio was 75.6%.
- The full-year earnings forecast and dividend forecast (year-end dividend of ¥65.00, total annual dividend of ¥65.00) remain unchanged from the most recently announced figures.
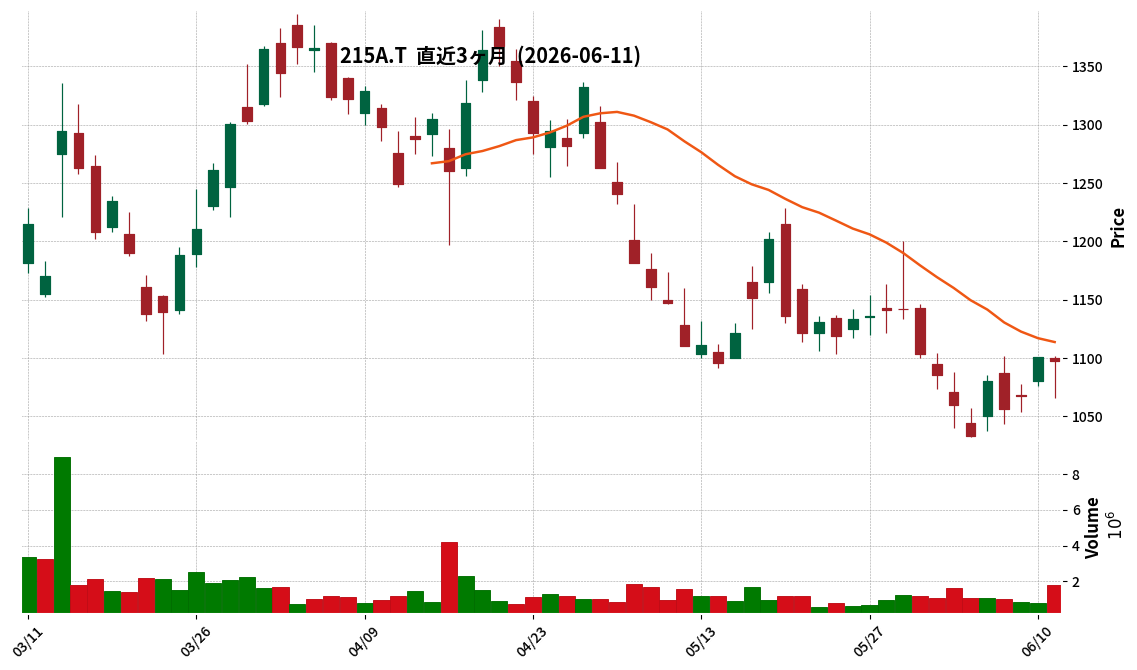
215A|G-タイミー
1097.0
▼ -0.36%
This article is an AI-generated summary and analysis of official IR disclosures.
📄 Announcement (AI-Reviewed)
- G-Timee Co., Ltd. announced its consolidated financial results (Japanese standards) for the fiscal year ended April 2026.
- The fiscal period for April 2026 (November 1, 2025 – April 30, 2026) is a transitional 6-month period due to a change in the fiscal year end.
- During this period, consolidated net sales were ¥21,006 million, operating profit was ¥3,812 million, ordinary profit was ¥3,760 million, and profit attributable to owners of parent was ¥2,439 million.
- For the fiscal year ending April 2027, the consolidated earnings forecast provides a range: net sales of ¥47,613 million to ¥48,823 million, operating profit of ¥8,821 million to ¥9,746 million, and profit attributable to owners of parent of ¥6,002 million to ¥6,927 million.
- Basic earnings per share were ¥24.25 for the fiscal year ended April 2026, and are projected to be ¥59.69 to ¥68.89 for the full fiscal year ending April 2027.
🤖 AI Perspective
G-Timee’s fiscal year ended April 2026 represents a 6-month transitional period due to a change in the fiscal year end, making direct year-over-year comparisons not applicable. The reported figures for this interim period provide a snapshot of the company’s profitability and revenue generation. The provided full-year earnings forecast for FY2027 offers guidance on the company’s expected future performance.
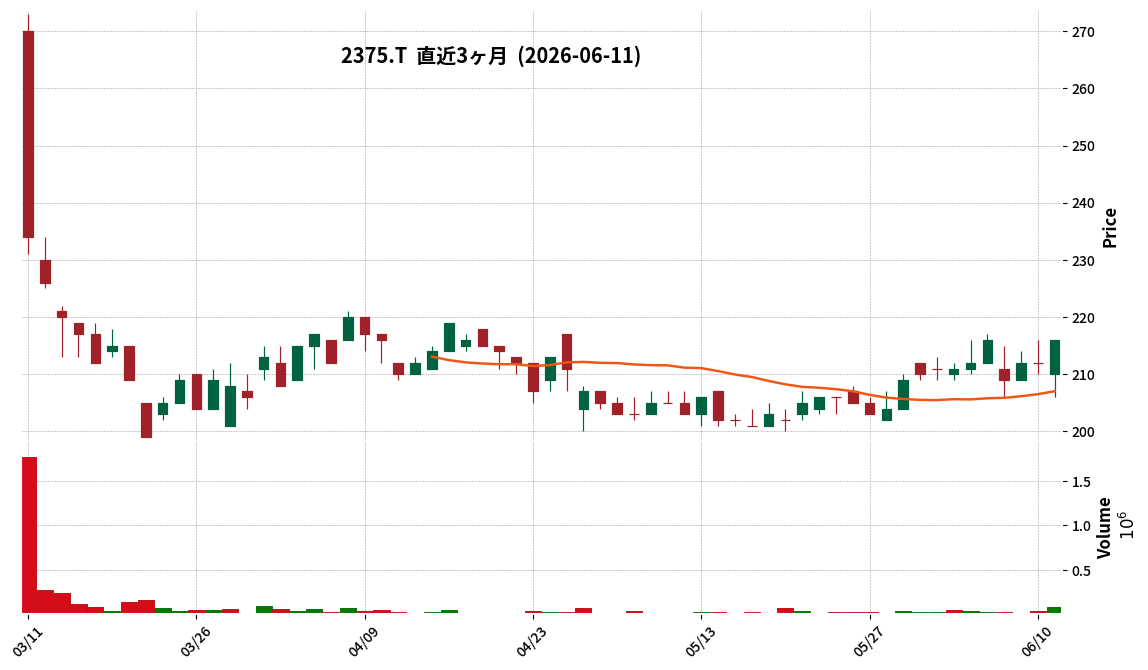
2375|ギグワークス
216.0
▲ +1.89%
This article is an AI-generated summary and analysis of official IR disclosures.
📄 Announcement (AI-Reviewed)
- Gigworks announced its consolidated financial results for the second quarter (interim) of the fiscal year ending October 2026.
- Revenue for the interim period was ¥11,451 million, representing a 3.5% increase compared to the prior interim period.
- Operating income registered ¥290 million, a turnaround from a loss of ¥370 million in the prior interim period.
- Ordinary income was ¥88 million (vs. a loss of ¥475 million in the prior interim period), and net income attributable to owners of parent was ¥9 million (a 91.9% decrease year-over-year).
- The consolidated full-year forecast for FY2026 has been revised, projecting revenue of ¥23,000 million, operating income of ¥400 million, ordinary income of ¥180 million, and net income attributable to owners of parent of ¥50 million.
🤖 AI Perspective
The increase in revenue and the shift to profitability in operating and ordinary income for this interim period may suggest an improvement in business operations. However, the significant decrease in net income attributable to owners of parent is primarily attributed to a ¥209 million impairment loss on crypto assets, which is a factor worth monitoring for its non-recurring nature. The revision of the full-year earnings forecast could reflect updated business conditions and future outlooks.
272A|グリーンクロスHD
—
▲ +0.00%
📎 Source:グリーンクロスHD Official IR →
This article is an AI-generated summary and analysis of official IR disclosures.
📄 Announcement (AI-Reviewed)
- For the consolidated fiscal year ended April 30, 2026 (May 1, 2025 – April 30, 2026), net sales reached ¥29,857 million (up 7.1% year-on-year), operating income ¥2,036 million (up 2.6%), ordinary income ¥2,023 million (up 1.6%), and profit attributable to owners of parent ¥1,356 million (up 11.9%).
- Basic earnings per share were ¥155.62, and return on equity was 11.2%.
- The year-end dividend was ¥39.00 (total annual dividend of ¥39.00), an increase from ¥37.00 in the previous fiscal year.
- For the consolidated fiscal year ending April 30, 2027, the company forecasts net sales of ¥31,514 million (up 5.6% year-on-year), operating income of ¥2,154 million (up 5.8%), ordinary income of ¥2,119 million (up 4.7%), and profit attributable to owners of parent of ¥1,390 million (up 2.5%). Basic earnings per share are projected to be ¥167.09.
- The forecasted annual dividend for the fiscal year ending April 30, 2027, is ¥40.00.
- Sankon Lease Co., Ltd. was newly added to the scope of consolidation during the fiscal year.
🤖 AI Perspective
Green Cross HD’s financial results for the fiscal year ended April 2026 show a notable increase in sales and all profit metrics, with profit attributable to owners of parent achieving double-digit growth. The increase in dividend payout suggests a focus on shareholder returns. The company’s projections for the next fiscal year, anticipating continued revenue and profit growth, could indicate a positive outlook for ongoing business expansion.
3031|ラクーンHD
631.0
▼ -1.25%

This article is an AI-generated summary and analysis of official IR disclosures.
📄 Announcement (AI-Reviewed)
- Consolidated net sales for the fiscal year ended April 2026 were ¥6,574 million, marking a 7.8% increase from the previous fiscal year.
- Adjusted EBITDA reached ¥1,592 million, an increase of 10.6% year-on-year.
- Operating profit stood at ¥1,320 million, up 5.3% from the previous fiscal year.
- Ordinary profit decreased by 11.3% year-on-year to ¥1,240 million.
- Profit attributable to owners of parent was ¥804 million, a decrease of 3.9% from the previous fiscal year.
- For the fiscal year ending April 2027, the company forecasts consolidated net sales of ¥7,500 million (up 14.1% YoY) and operating profit of ¥600 million (down 54.6% YoY).
🤖 AI Perspective
Raccoon Holdings’ FY2026 results show growth in net sales and adjusted EBITDA, contrasting with a decline in ordinary profit and net profit. This disparity may be attributed to factors such as losses from investment limited partnerships and increased fees related to the issuance of convertible bonds with share options. The FY2027 forecast projects continued revenue growth but anticipates a significant decrease in profit items, suggesting that investors may want to monitor the company’s future business strategies and cost structures.
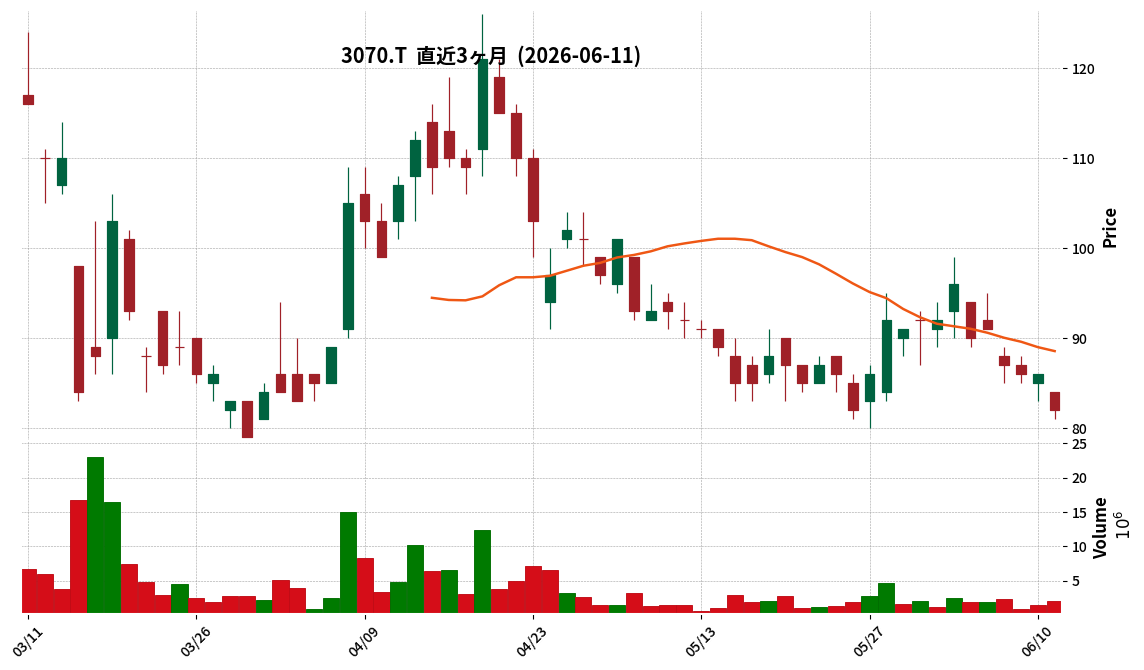
3070|G-ジェリービーンズ
82.0
▼ -4.65%
📎 Source:G-ジェリービーンズ Official IR →
This article is an AI-generated summary and analysis of official IR disclosures.
📄 Announcement (AI-Reviewed)
- G-Jellybeans Group announced its consolidated results for the first quarter of the fiscal year ending January 2027 (February 1, 2026 – April 30, 2026).
- Net sales reached ¥1,801 million, marking a 689.5% increase compared to the same quarter last year.
- The company reported an operating profit of ¥46 million, a turnaround from an operating loss of ¥111 million in the prior year’s first quarter.
- Ordinary profit was ¥15 million (compared to an ordinary loss of ¥113 million YoY), and net loss attributable to owners of parent was ¥36 million (compared to a net loss of ¥116 million YoY).
- Two new companies, Sunrise Co., Ltd. and JB Energy G.K., were newly included in the scope of consolidation during this quarter.
🤖 AI Perspective
G-Jellybeans Group’s Q1 FY2027 results highlight a significant improvement in both net sales and operating profit, largely driven by the inclusion of new consolidated subsidiaries and operational improvements in its lifestyle business. While the top-line performance shows strong growth and a return to operating profitability, the company still reported a net loss for the quarter. Investors may want to monitor how these new ventures and ongoing business transformations contribute to sustained profitability in subsequent periods.
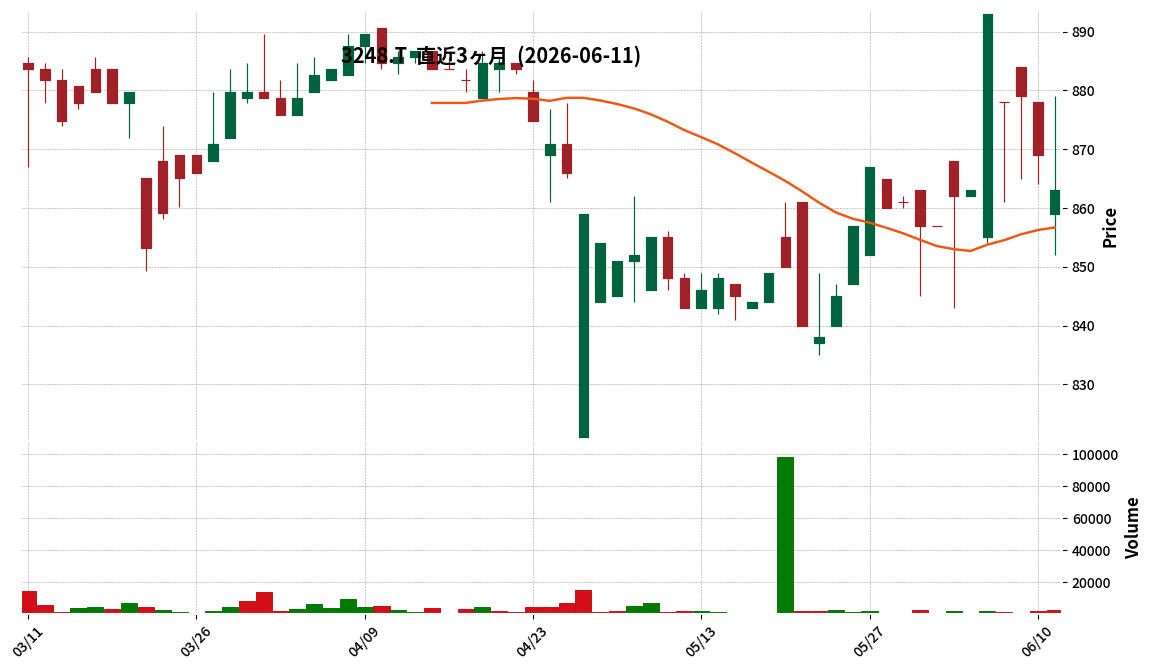
3248|アールエイジ
863.0
▼ -0.69%
This article is an AI-generated summary and analysis of official IR disclosures.
📄 Announcement (AI-Reviewed)
- Early Age Co., Ltd. announced its consolidated financial results for the second quarter (interim period) of the fiscal year ending October 2026.
- Net sales were ¥1,666 million (down 7.7% year-on-year), operating profit was ¥315 million (down 9.0% year-on-year), ordinary profit was ¥257 million (down 6.3% year-on-year), and net income attributable to owners of parent was ¥171 million (down 1.6% year-on-year).
- By segment, revenue from the Operation and Management Business was ¥1,406 million (down 2.4% year-on-year), and revenue from the Development and Sales Business was ¥260 million (down 28.7% year-on-year).
- The full-year consolidated earnings forecast remains unchanged from the most recently announced figures: net sales of ¥3,100 million, operating profit of ¥469 million, ordinary profit of ¥350 million, and net income attributable to owners of parent of ¥231 million.
- An interim dividend of ¥15.00 per share is planned, and the year-end dividend forecast is also maintained at ¥21.00 per share.
🤖 AI Perspective
Early Age’s Q2 FY2026 results show a decline in both revenue and various profit metrics compared to the previous year. The significant decrease in revenue from the Development and Sales Business may be a key point of focus for investors. However, the unchanged full-year earnings forecast suggests the company may anticipate a recovery in the latter half of the fiscal year.
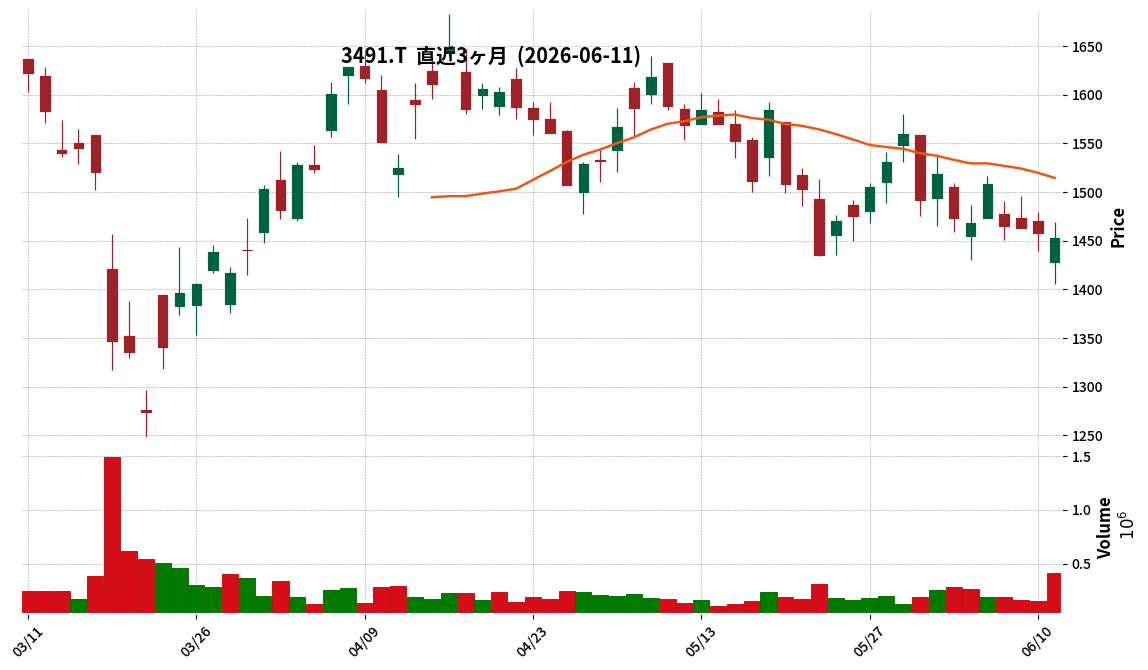
3491|G-GA TECH
1453.0
▼ -0.34%
📎 Source:G-GA TECH Official IR →
This article is an AI-generated summary and analysis of official IR disclosures.
📄 Announcement (AI-Reviewed)
- G-GA TECH announced its consolidated financial results for the second quarter (interim period) of the fiscal year ending October 2026.
- Revenue reached ¥142,403 million, marking a 28.5% increase compared to the prior interim period.
- Business profit was ¥3,863 million, a 7.8% decrease year-on-year. Operating profit decreased by 9.6% to ¥3,759 million, and profit attributable to owners of the parent decreased by 6.8% to ¥1,997 million.
- Basic earnings per share for the interim period was ¥48.66, down from ¥55.66 in the prior interim period.
- The full-year consolidated earnings forecast for FY2026 remains unchanged, projecting revenue of ¥323,000 million and profit attributable to owners of the parent of ¥5,460 million.
- The estimated annual dividend for the fiscal year end is ¥13.00, with no revisions from the most recently announced forecast.
🤖 AI Perspective
While the company reported a significant increase in revenue, the decline in profit metrics year-over-year warrants attention. This could suggest increased costs associated with business expansion or a shift in the business structure. The unchanged full-year forecast may indicate management’s confidence in achieving anticipated profitability in the second half of the fiscal year or adherence to an existing strategic plan.
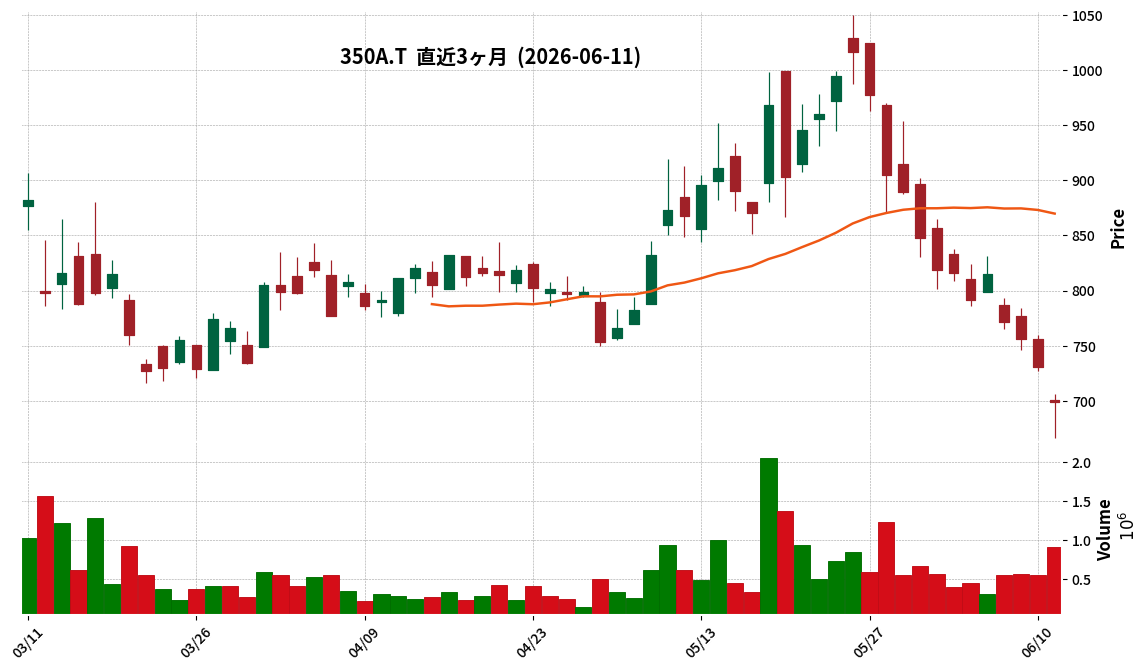
350A|G-デジタルグリッド
699.0
▼ -4.38%
📎 Source:G-デジタルグリッド Official IR →
This article is an AI-generated summary and analysis of official IR disclosures.
📄 Announcement (AI-Reviewed)
- G-Digital Grid announced its consolidated financial results for the third quarter of the fiscal year ending July 2026.
- Revenue reached ¥5,107 million (up 6.6% year-on-year), operating profit ¥2,447 million (up 3.1% YoY), ordinary profit ¥2,551 million (up 12.2% YoY), and net profit attributable to parent company shareholders ¥1,871 million (up 17.9% YoY).
- By segment, Power PF business revenue was ¥4,357 million (up 2.9% YoY), Renewable Energy PF business revenue was ¥493 million (up 54.6% YoY), and Other businesses revenue was ¥256 million (up 8.7% YoY).
- The Renewable Energy PF segment recorded a significant profit increase to ¥253 million (up 113.5% YoY), and the Other businesses segment turned profitable at ¥19 million from a loss in the prior year.
- The full-year consolidated earnings forecast has been revised, projecting revenue of ¥6,595 million (up 7.2% YoY) and net profit attributable to parent company shareholders of ¥1,919 million (up 2.6% YoY).
🤖 AI Perspective
G-Digital Grid’s Q3 FY2026 results show a year-on-year increase across key financial metrics, with the Renewable Energy PF business demonstrating particularly strong growth in both revenue and profit. This segment’s performance appears to be a primary driver for the overall positive results. Investors may want to monitor the company’s progress towards its revised full-year projections.
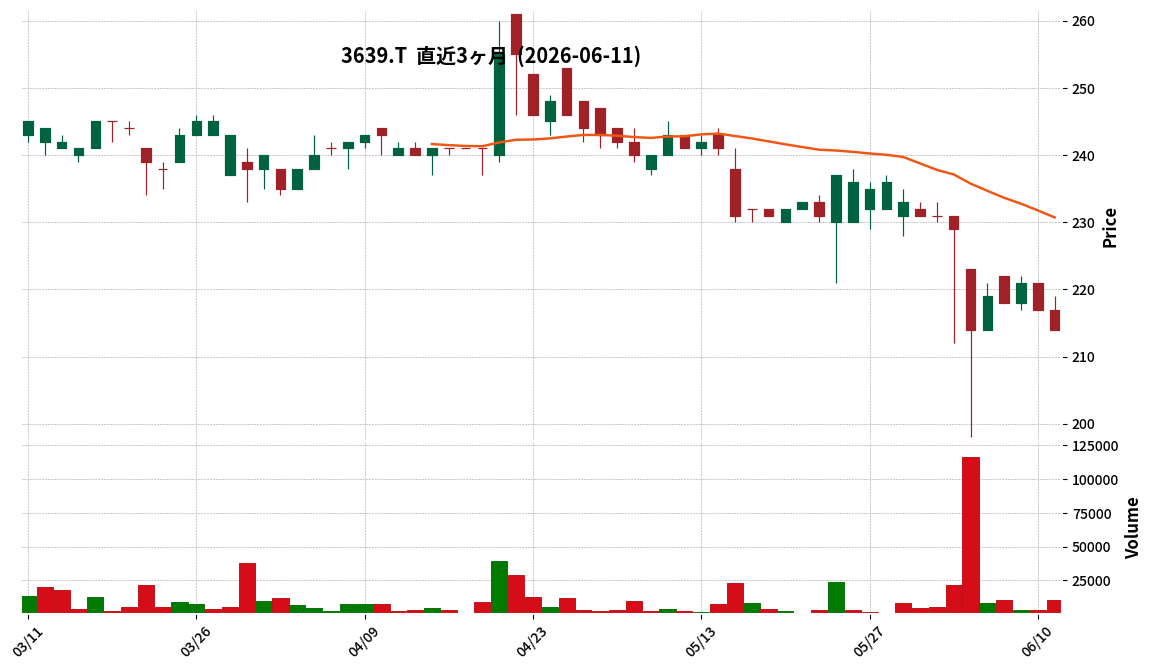
3639|ボルテージ
214.0
▼ -1.38%
This article is an AI-generated summary and analysis of official IR disclosures.
📄 Announcement (AI-Reviewed)
- Voltage Inc. resolved to acquire 100% of the shares (200 shares) of Opera House Co., Ltd., making it a subsidiary, following a board meeting on June 11, 2026.
- The primary purpose of the acquisition is to strengthen Voltage Group’s “Consumer Business,” identified as a new growth area.
- Opera House Co., Ltd. is a production company with expertise in character-driven game development, proprietary assets like novel game engines, and extensive know-how in illustration and animation production.
- Voltage anticipates four key synergies from this acquisition: (1) strengthening consumer game development, (2) enhancing sales in Asia, (3) collaborating with external strong IPs, and (4) expanding publishing businesses including indie games.
- Opera House Co., Ltd. is expected to become a consolidated subsidiary of Voltage starting from the fiscal year ending June 2027.
🤖 AI Perspective
This acquisition suggests Voltage’s strategic focus on the “Consumer Business” as a key growth pillar, aligning with its ongoing business portfolio transformation. Integrating Opera House’s game development capabilities and animation business expertise could enable Voltage to pursue diversified business expansion. The success of this M&A in accelerating Voltage’s shift from existing businesses to new areas will be worth monitoring.
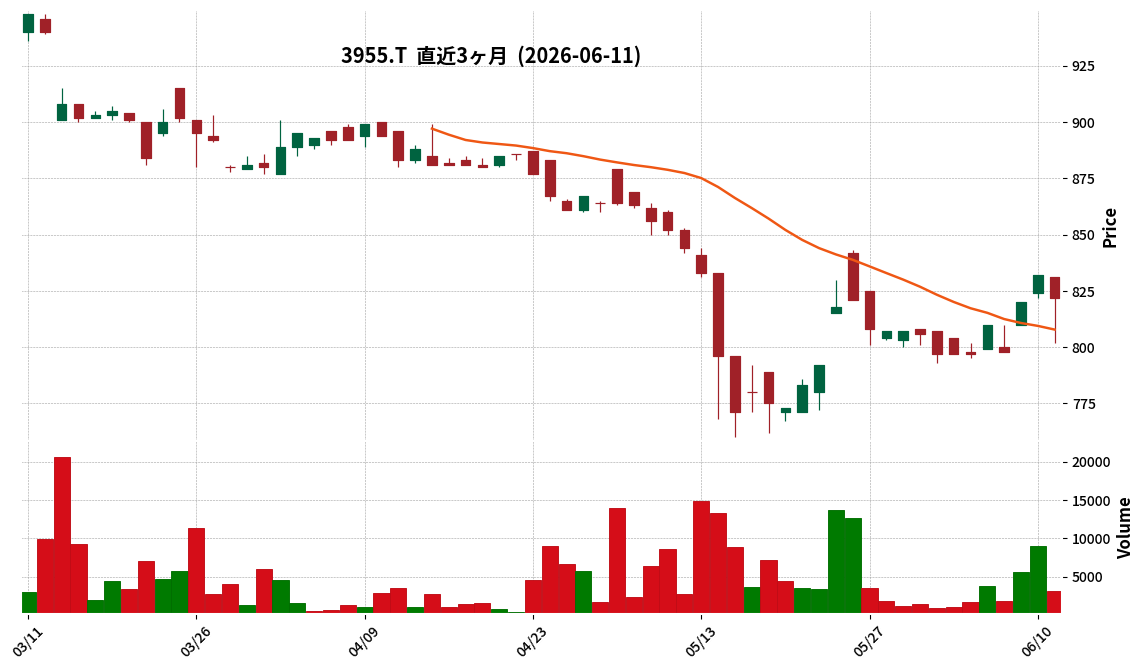
3955|イムラ
822.0
▼ -1.20%
This article is an AI-generated summary and analysis of official IR disclosures.
📄 Announcement (AI-Reviewed)
- Imura Co., Ltd. announced its consolidated financial results for the first quarter of fiscal year 2027 (February 1, 2026 – April 30, 2026).
- Net sales were ¥5,523 million, representing a 2.1% decrease compared to the same period last year.
- Operating profit stood at ¥236 million (down 53.8% year-on-year), and ordinary profit was ¥235 million (down 53.9% year-on-year).
- Net profit attributable to owners of the parent was ¥142 million, a 68.5% decrease from the prior year.
- Key factors for the decline in profits include increased depreciation expenses due to the new factory operation and a significant decrease in public sector demand previously captured in the prior year.
🤖 AI Perspective
Imura’s Q1 results show a notable decline in both sales and profits compared to the previous year, primarily influenced by increased depreciation costs from new factory operations and a reversal of public sector demand from the prior period. However, the “Other” segment, which includes overseas subsidiaries and domestic price revisions, showed an improvement in operating profit, suggesting potential diversification efforts. Investors may monitor how these strategic initiatives, particularly the new factory and overseas restructuring, contribute to overall performance in subsequent quarters.
Disclaimer: This article is for informational purposes only and does not constitute investment advice.
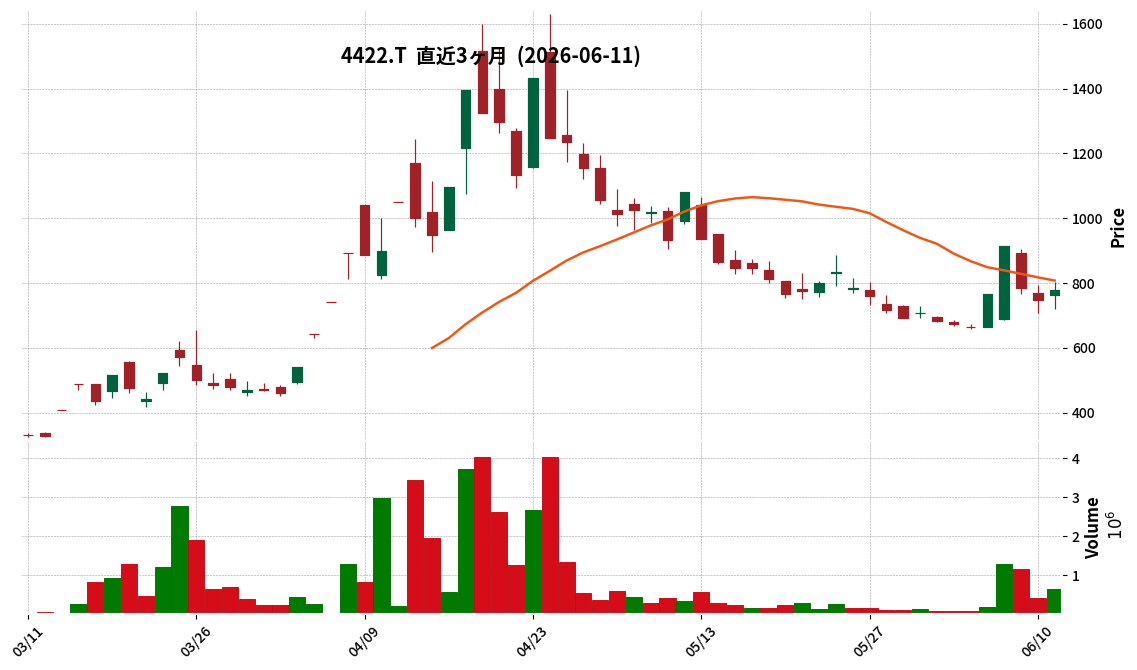
4422|G-VALUENEX
778.0
▲ +4.15%
📎 Source:G-VALUENEX Official IR →
This article is an AI-generated summary and analysis of official IR disclosures.
📄 Announcement (AI-Reviewed)
- G-VALUENEX reported consolidated net sales of ¥665 million for the third quarter of the fiscal year ending July 2026, marking a 37.0% increase year-over-year.
- Operating profit reached ¥121 million, an improvement from a loss of ¥98 million in the same period last year, indicating a widening of the profit margin. Ordinary profit and net profit attributable to parent company shareholders also turned positive.
- Gross profit margin stood at 76.0% (+0.7pt YoY), and operating profit margin was 18.2% (+38.4pt YoY).
- By service, consulting sales increased by 8.1% to ¥158 million, and ASP sales increased by 4.6% to ¥83 million, both surpassing prior year levels.
- Geographically, US sales significantly grew by 138.5% to ¥75 million, while Japan sales decreased by 15.4% to ¥166 million.
- The consolidated earnings forecast for the fiscal year ending July 2026 remains undetermined due to uncertainties such as Trump tariffs and international affairs, making a reasonable prediction difficult at this time.
🤖 AI Perspective
G-VALUENEX achieved substantial revenue growth and improved operating profit significantly in the third quarter. The strong performance in consulting services and notable sales growth in the US market may suggest positive shifts in their business structure. However, the ongoing status of the consolidated earnings forecast as undetermined highlights the company’s caution regarding external market uncertainties.
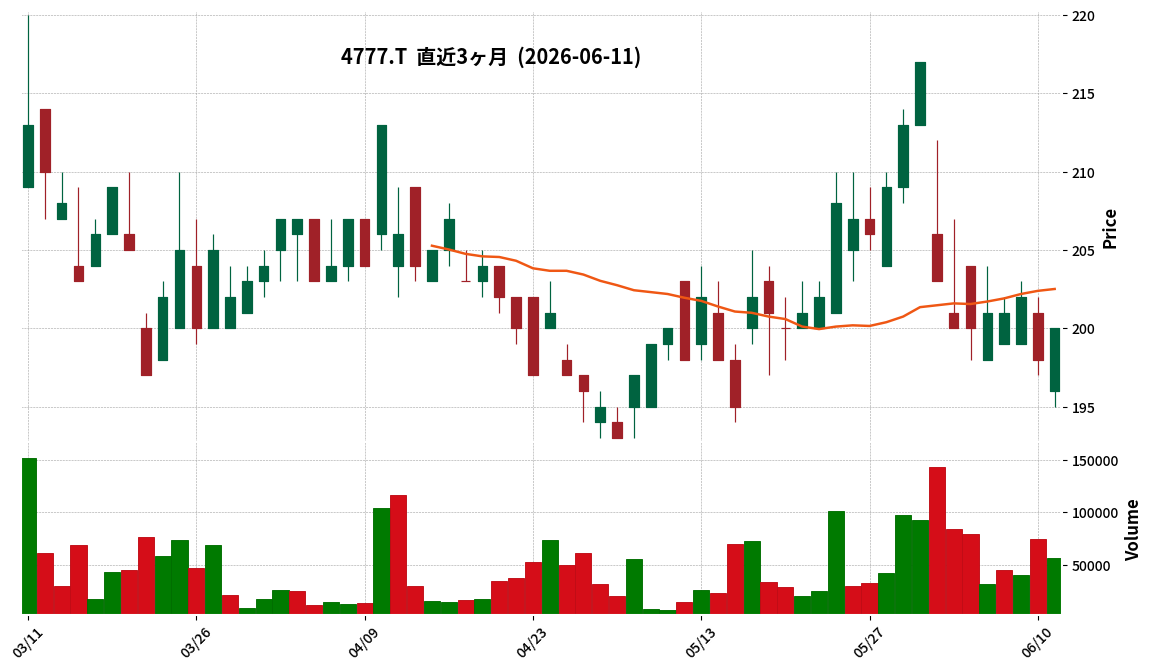
4777|ガーラ
200.0
▲ +1.01%
This article is an AI-generated summary and analysis of official IR disclosures.
📄 Announcement (AI-Reviewed)
- Gala Inc. announced the finalization of the financial results for its unlisted parent company, Megazone Cloud Corporation, for the fiscal year ending December 2025.
- Megazone Cloud Corporation’s capital stock was 361,086,000 Korean Won as of December 31, 2025.
- As of December 31, 2025, the shareholding structure shows other corporations holding 98.36%, foreign corporations and others 0.34%, and financial institutions 1.30%.
- Megazone Corporation is the largest shareholder, holding 53.16% of the shares, followed by Stratus Investment Ltd., Nimbus Limited, and KT Corporation.
- The executive board consists of 16 male officers, with Mr. Joowan Lee serving as the Representative Director. There are no female officers.
🤖 AI Perspective
This disclosure enhances transparency regarding the management status of Gala Inc.’s parent company. The release of key financial data, capital structure, and executive details for Megazone Cloud Corporation may provide investors with a clearer understanding of the overall governance and business foundation of the Gala Group. Given the parent company’s focus on cloud services, potential synergies and strategic implications for Gala’s business development could be worth monitoring.
5075|アップコン
—
▲ +0.00%
This article is an AI-generated summary and analysis of official IR disclosures.
📄 Announcement (AI-Reviewed)
- UPCON Co., Ltd. announced its non-consolidated financial results for the first quarter of the fiscal year ending January 2027 (February 1, 2026 – April 30, 2026).
- Sales reached ¥404 million (up 30.0% year-on-year), operating profit was ¥164 million (up 18.1%), ordinary profit was ¥164 million (up 20.3%), and quarterly net profit was ¥109 million (up 19.9%).
- As of the end of the first quarter of FY2027, total assets stood at ¥2,303 million, net assets at ¥1,926 million, and the equity ratio was 83.6%.
- The full-year performance forecast for the fiscal year ending January 2027 remains unchanged from the forecast announced on March 12, 2026.
- A stock split of 3 shares for 1 ordinary share was implemented on October 1, 2025, and per-share quarterly net income has been calculated assuming this stock split occurred at the beginning of the previous fiscal year.
🤖 AI Perspective
UPCON’s Q1 FY2027 results show significant year-on-year increases in sales and all profit metrics, with sales up 30.0% being a notable highlight. This robust growth appears to be primarily driven by solid orders in large-scale and private sector projects. Furthermore, the company’s high equity ratio of 83.6% suggests a strong and stable financial foundation, which could be a positive factor for investors.
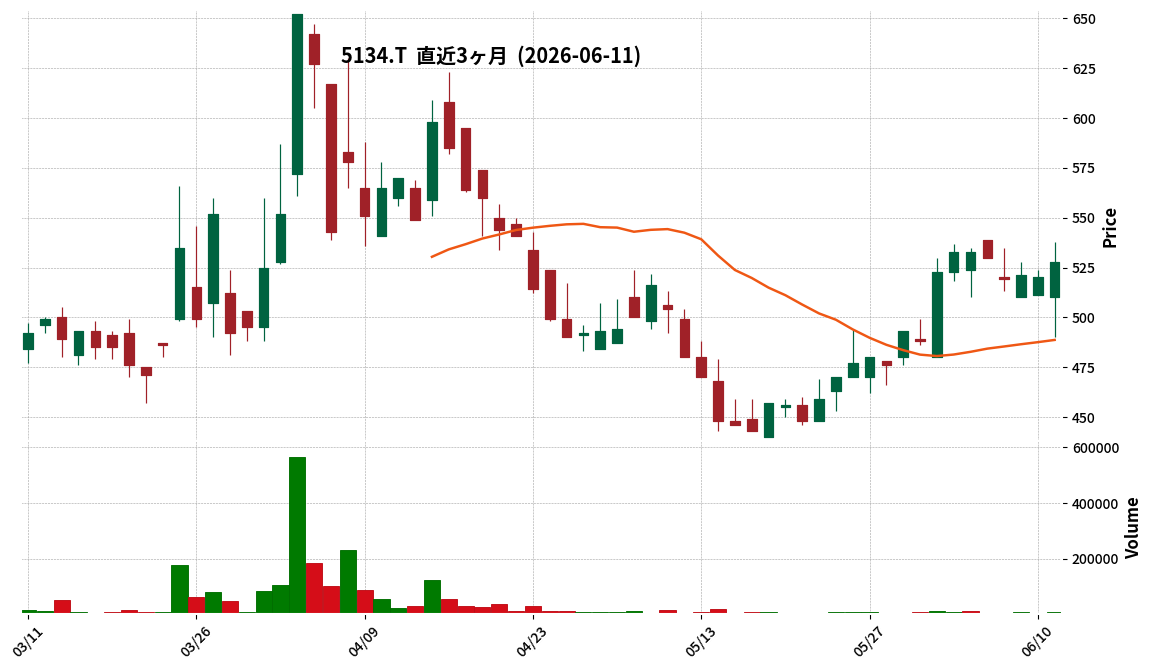
5134|G-POPER
528.0
▲ +1.54%
📎 Source:G-POPER Official IR →
This article is an AI-generated summary and analysis of official IR disclosures.
📄 Announcement (AI-Reviewed)
- G-POPER’s Q2 FY2026 interim non-consolidated financial results show sales revenue of ¥714 million, a 3.3% increase compared to the previous interim period.
- Operating profit was ¥71 million, representing a 39.5% decrease year-on-year. Ordinary profit decreased by 39.2% to ¥71 million, and interim net profit decreased by 57.7% to ¥57 million.
- The number of paid contract companies for the core “Comiru” SaaS service increased by 16.4% year-on-year to 2,103. Applications for the “ComiruPay” payment service reached 673 companies, a 47.6% increase quarter-on-quarter.
- Annual Recurring Revenue (ARR) grew by 6.0% year-on-year to ¥1,167.888 million, and billing student IDs increased by 6.6% to 483 thousand IDs. However, Average Revenue Per User (ARPU) decreased by 9.0% year-on-year to ¥46,279.
- The full-year forecast for FY2026 remains unchanged from the most recent announcement, projecting sales revenue of ¥1,425 million (up 2.6% year-on-year), operating profit of ¥85 million (down 50.8%), and net profit of ¥55 million (down 59.7%).
🤖 AI Perspective
While sales revenue increased, the company reported a decrease in profits for the period. This appears to be influenced by a temporary decline in ARPU and seasonal factors specific to the cram school industry during the academic year transition, despite robust new customer acquisition in the core SaaS business. The growth of the “ComiruPay” payment service could contribute to cross-selling and deeper customer engagement, which may influence future revenue structure.
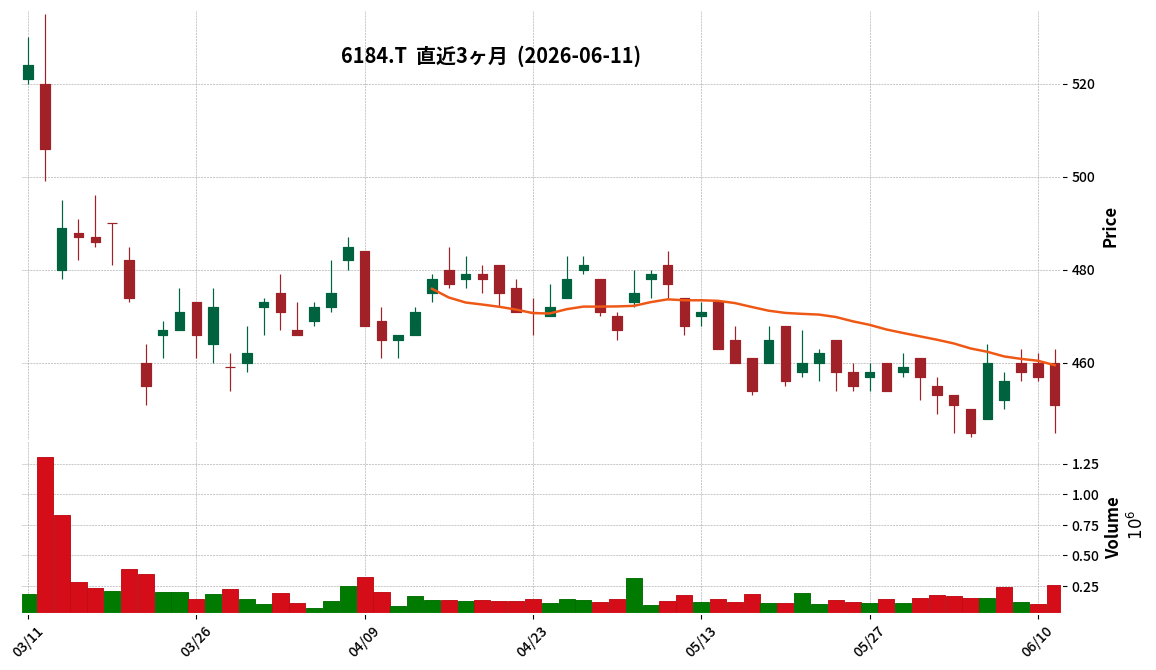
6184|鎌倉新書
451.0
▼ -1.31%
This article is an AI-generated summary and analysis of official IR disclosures.
📄 Announcement (AI-Reviewed)
- Kamakura Shinsho Co., Ltd. announced its consolidated financial results for the first quarter of FY2027 (February 1, 2026 to April 30, 2026).
- Net sales for the quarter reached ¥2,202 million, an increase of 12.0% compared to the same period of the previous year.
- Operating profit was ¥303 million (+30.0% YoY), ordinary profit was ¥311 million (+35.5% YoY), and profit attributable to owners of parent was ¥195 million (+24.8% YoY).
- The consolidated performance for the first quarter cumulative period set a new record high.
- Sales in the nursing care business increased by 48.1% year-on-year, while sales in the funeral business increased by 20.7% year-on-year.
- The full-year consolidated earnings forecast for FY2027 remains unchanged from the forecast announced on March 12, 2026.
🤖 AI Perspective
Kamakura Shinsho achieved substantial growth in both sales and profits during the first quarter of FY2027, setting a new record for its Q1 performance. This strong result appears to be driven by robust performance in its nursing care and funeral businesses. With the full-year earnings forecast remaining unchanged, investors may monitor how the company’s performance evolves throughout the remainder of the fiscal year.
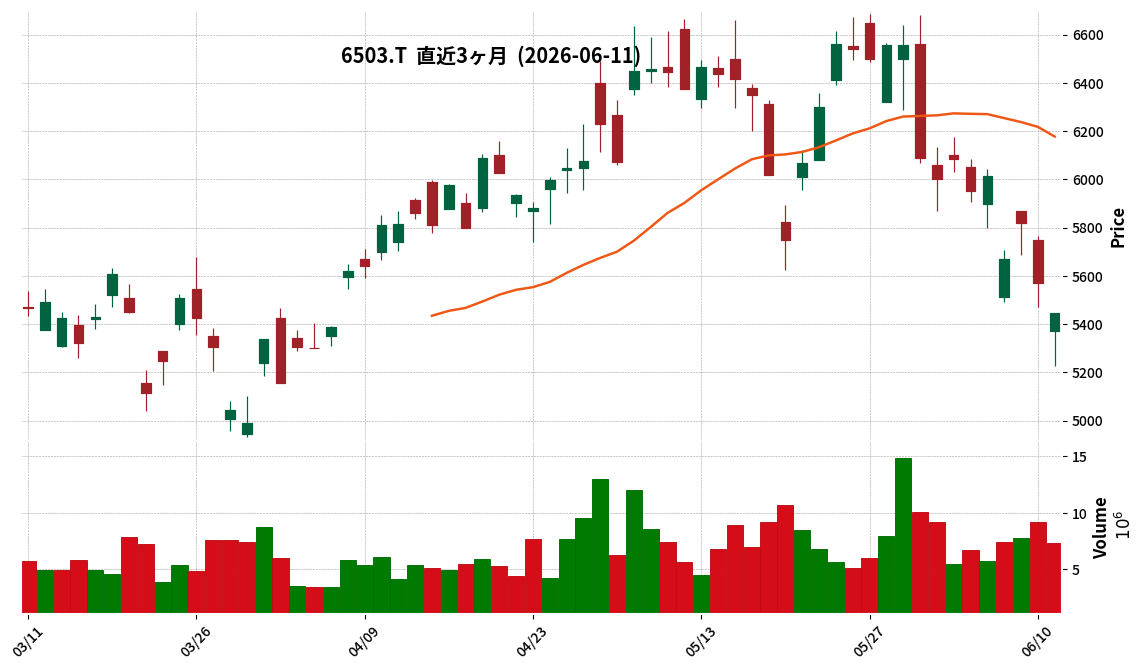
6503|三菱電
5446.0
▼ -2.26%
This article is an AI-generated summary and analysis of official IR disclosures.
📄 Announcement (AI-Reviewed)
- Mitsubishi Electric announced on June 11, 2026, a partial correction to its “Consolidated Financial Results for the Fiscal Year Ended March 31, 2026 [IFRS].”
- The correction was made due to an error in the capital expenditure figures presented in “4. Supplementary Information (7) Capital Expenditure” on page 14 of the financial results released on April 28, 2026.
- No corrections were made to the XBRL data.
- Specifically, the FY2025 actual capital expenditure for the “Industry & Mobility” segment was revised from 38.9 billion yen to 39.9 billion yen, and for the “Life” segment, it was revised from 61.6 billion yen to 67.1 billion yen.
- Consequently, the consolidated total capital expenditure for FY2025 was upwardly revised from 264.0 billion yen to 270.6 billion yen for tangible fixed assets, and the total sum from 304.1 billion yen to 310.7 billion yen.
🤖 AI Perspective
This correction pertains to historical capital expenditure figures in specific segments and is not anticipated to directly impact current earnings forecasts or overall financial health. However, investors may scrutinize the company’s internal controls regarding information disclosure, given that the correction occurred after the initial financial results announcement. The absence of corrections to the XBRL data suggests a limited impact on data users.
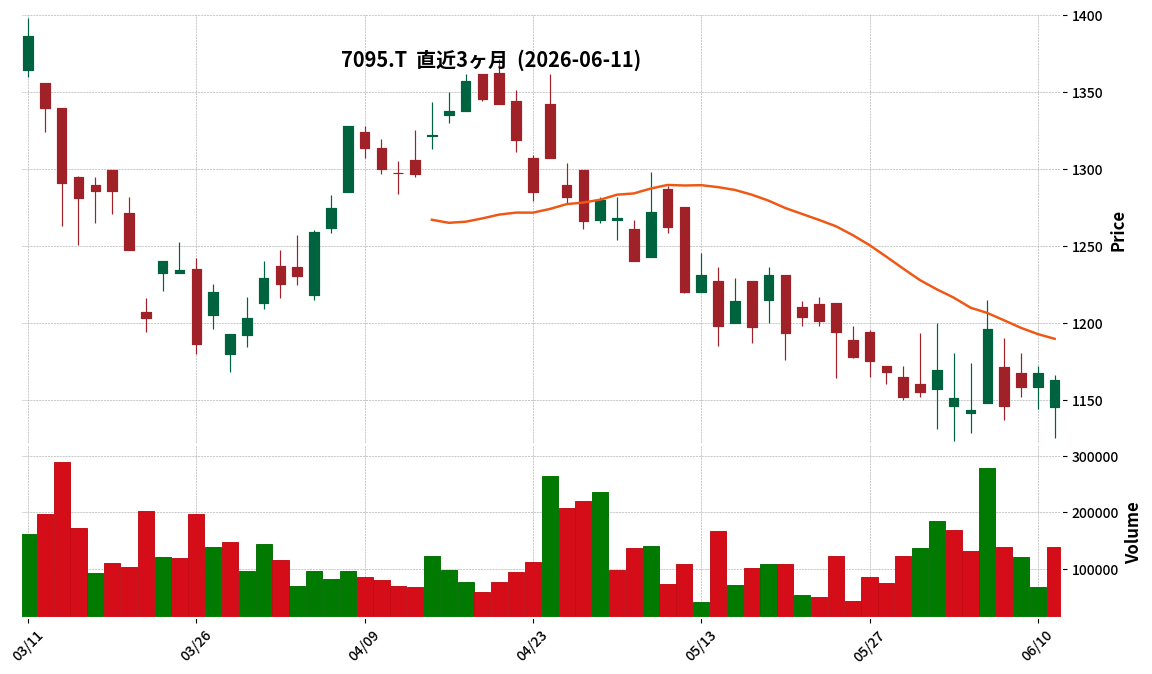
7095|MacbeeP
1163.0
▼ -0.34%
📎 Source:MacbeeP Official IR →
This article is an AI-generated summary and analysis of official IR disclosures.
📄 Announcement (AI-Reviewed)
- Macbee Planet announced its consolidated financial results for the fiscal year ended April 30, 2026. Revenue was 50,579 million yen (down 2.1% year-on-year), operating profit was 3,650 million yen (down 29.4% year-on-year), and profit attributable to owners of the parent was 2,353 million yen (down 31.6% year-on-year).
- Basic earnings per share for the period were 169.49 yen, compared to 243.41 yen in the previous fiscal year.
- At the end of the period, equity attributable to owners of the parent was 12,614 million yen, and equity per share attributable to owners of the parent was 1,012.71 yen.
- The annual dividend for the fiscal year ended April 30, 2026, was 55.00 yen per share (interim 0 yen, year-end 55.00 yen), an increase from 36.00 yen in the previous year. The dividend payout ratio was 28.7%.
- The consolidated earnings forecast for the fiscal year ending April 30, 2027, projects revenue of 51,000 million yen (up 0.8% year-on-year), operating profit of 3,000 million yen (down 17.8% year-on-year), and profit attributable to owners of the parent of 1,900 million yen (down 19.3% year-on-year).
🤖 AI Perspective
The FY2026 results show a decrease in revenue and a double-digit decline in key profit metrics compared to the previous fiscal year. This was attributed to specific factors affecting some major customers, which contrasts with the general growth trend in the internet advertising market. However, the annual dividend increased, indicating a commitment to shareholder returns. The FY2027 forecast anticipates revenue growth but further profit decline, suggesting that adapting to changes in the business environment may remain a key focus.
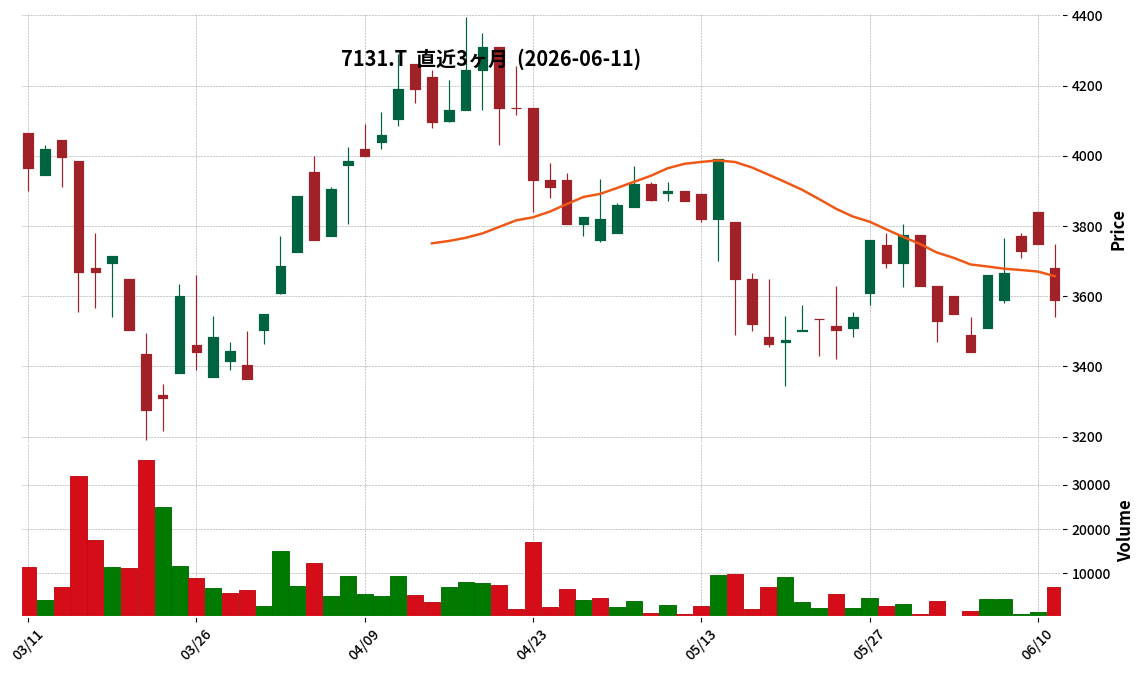
7131|のむら産業
3590.0
▼ -4.27%
This article is an AI-generated summary and analysis of official IR disclosures.
📄 Announcement (AI-Reviewed)
- Nomura Corporation reported for the second quarter of the fiscal year ending October 2026: net sales of ¥3,838 million (up 18.1% year-on-year), operating profit of ¥560 million (up 79.7% year-on-year), and net income attributable to owners of parent of ¥408 million (up 96.6% year-on-year).
- By segment, Packaging-related business recorded sales of ¥3,371 million (up 21.1% year-on-year), and Logistics and Packaging business recorded sales of ¥466 million (up 0.2% year-on-year).
- Within the Packaging-related business, sales of packaging machinery increased from ¥905 million to ¥1,504 million (up 66.1%), while packaging materials decreased from ¥1,878 million to ¥1,866 million (down 0.6%).
- These Q2 results exceeded the initial Q2 performance forecasts announced at the beginning of the fiscal year.
- The progress rate against the full-year consolidated earnings forecast for FY2026 as of Q2 is 52.2% for net sales, 69.1% for operating profit, 69.2% for ordinary profit, and 74.5% for net income attributable to owners of parent.
🤖 AI Perspective
Nomura Corporation’s Q2 FY2026 results show significant year-on-year growth across key profit metrics, exceeding initial forecasts. This strong performance appears to be driven by the packaging machinery within the Packaging-related business, likely due to the realization of outstanding orders from the previous fiscal year and the early delivery of projects originally slated for the second half. Given the high progress rates against full-year forecasts, future business trends warrant close monitoring.
7196|Casa
762.0
▼ -0.13%

This article is an AI-generated summary and analysis of official IR disclosures.
📄 Announcement (AI-Reviewed)
- Casa Co., Ltd. announced its consolidated financial results for the first quarter of the fiscal year ending January 2027 (February 1, 2026 – April 30, 2026).
- Revenue reached ¥3,295 million, marking a 4.5% increase year-over-year.
- EBITDA was a loss of ¥0 million, compared to a profit of ¥5 million in the same period last year.
- Operating loss was ¥148 million, widening from an operating loss of ¥146 million in the prior year’s first quarter.
- Ordinary loss was ¥131 million, compared to an ordinary loss of ¥115 million in the prior year’s first quarter.
- Net loss attributable to owners of the parent was ¥114 million, a decline from a profit of ¥88 million in the same period last year.
- The full-year consolidated earnings forecast remains unchanged, projecting revenue of ¥13,830 million, EBITDA of ¥990 million, operating profit of ¥355 million, ordinary profit of ¥426 million, and net profit attributable to owners of the parent of ¥187 million.
🤖 AI Perspective
Casa’s Q1 results indicate revenue growth but a deterioration in EBITDA and all profit stages, leading to a shift from net profit to net loss attributable to parent. This can primarily be attributed to an 11.2% increase in selling, general and administrative expenses year-over-year. Conversely, the cost of sales decreased by 1.4% due to reduced provision for doubtful accounts and litigation/disposal expenses, suggesting ongoing efforts to improve cost structure. With the full-year forecast unchanged, investors may monitor the company’s progress in expanding sales, managing costs, and controlling expenses in the coming quarters.
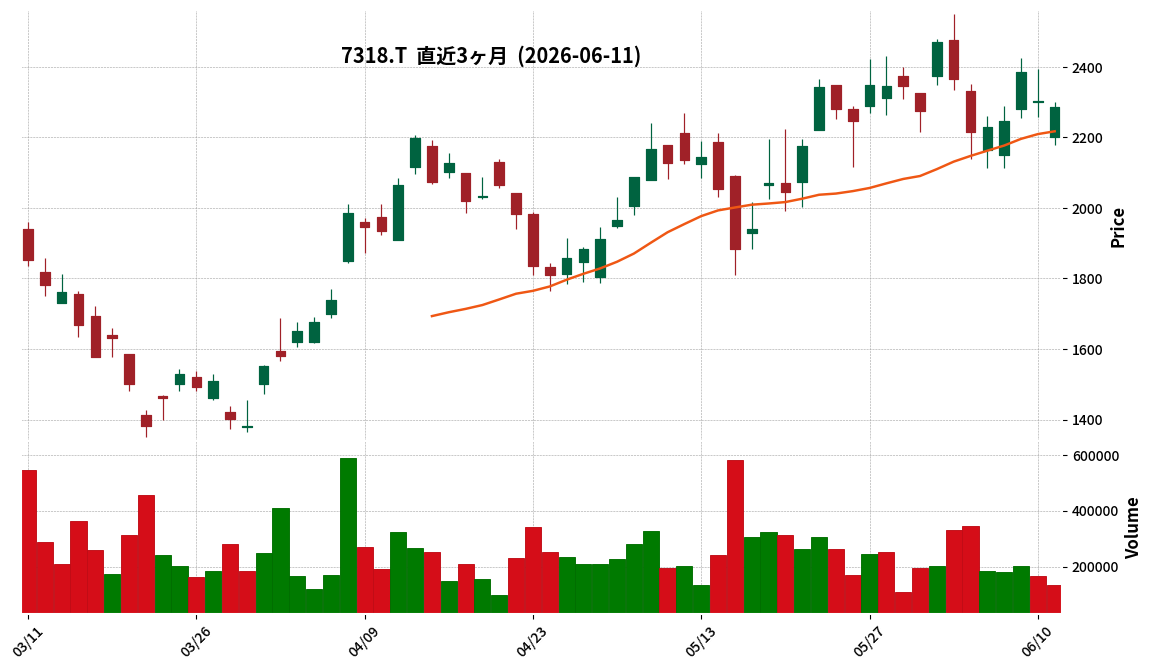
7318|G-セレンディップ
2287.0
▼ -0.65%
📎 Source:G-セレンディップ Official IR →
This article is an AI-generated summary and analysis of official IR disclosures.
📄 Announcement (AI-Reviewed)
- Serendipity Holdings Co., Ltd. resolved at its Board of Directors meeting on June 11, 2026, to acquire shares of Nikken Sangyo Co., Ltd. through its Special Purpose Company (SPC), Serendipity SPC3 Co., Ltd., making it a subsidiary.
- Nikken Sangyo operates both trading business, primarily for construction machinery parts, and processing business, including lining steel pipes. For the fiscal year ended March 2026 (non-consolidated), it reported ¥9.5 billion in net sales, ¥690 million in operating profit, ¥700 million in ordinary profit, ¥4.2 billion in total assets, and ¥1.7 billion in net assets.
- This acquisition aims to expand the G-Serendipity Group into the construction machinery related sector and to enlarge its sales bases and business domains in the Kansai region.
- Serendipity SPC3 Co., Ltd. is expected to become a subsidiary of Monozukuri Business Succession Holdings Co., Ltd. (JMS), making this the first investment case for JMS.
- Mr. Takehiro Hamaguchi, the current Representative Director and President of Nikken Sangyo, will retain his position, while Mr. Yuki Mizuta from G-Serendipity is scheduled to assume the role of Director and CFO.
🤖 AI Perspective
This acquisition marks a strategic entry for G-Serendipity into the construction machinery sector, potentially leveraging its existing manufacturing expertise from the automotive components industry. The combination of Nikken Sangyo’s customer base and supply model with G-Serendipity’s management support capabilities could drive business synergies and expansion in the Kansai region. Furthermore, as the inaugural investment for Monozukuri Business Succession Holdings (JMS), this move may offer insights into the future direction and investment strategy of JMS.
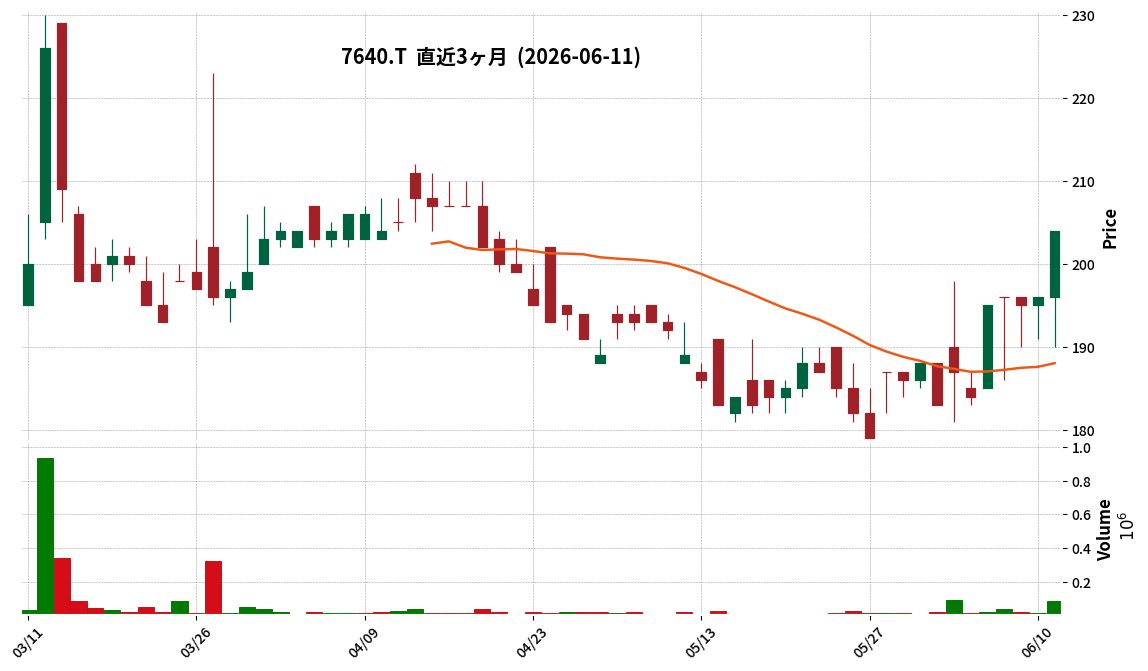
7640|トップカルチャ
204.0
▲ +4.08%
📎 Source:トップカルチャ Official IR →
This article is an AI-generated summary and analysis of official IR disclosures.
📄 Announcement (AI-Reviewed)
- TOPCULTURE Co., Ltd. announced its consolidated financial results for the second quarter of the fiscal year ending October 2026 (November 1, 2025 – April 30, 2026).
- Net sales increased by 1.0% year-over-year to ¥9,398 million.
- Operating income was ¥142 million and ordinary income was ¥113 million, marking a turnaround from losses in the previous interim period.
- Net income attributable to owners of parent was ¥812 million (compared to a loss of ¥262 million in the previous interim period).
- Basic earnings per share were ¥52.02, and diluted earnings per share were ¥51.96.
- Total assets stood at ¥17,732 million, net assets at ¥1,531 million, and the equity ratio at 8.3%.
- Effective April 1, 2026, TOPCULTURE acquired the bookstore business of nine stores from MEIBUNDO PLANNER Co., Ltd., adding one new company to the scope of consolidation.
- The full-year consolidated earnings forecast is currently under review and remains undetermined.
🤖 AI Perspective
TOPCULTURE’s Q2 FY2026 results show a modest increase in net sales and a significant shift to profitability. The turnaround in operating income, ordinary income, and net income attributable to owners of parent from losses in the prior year’s interim period suggests an improvement in the company’s financial health. The acquisition of MEIBUNDO PLANNER’s bookstore business and its impact on future performance is a point worth monitoring.
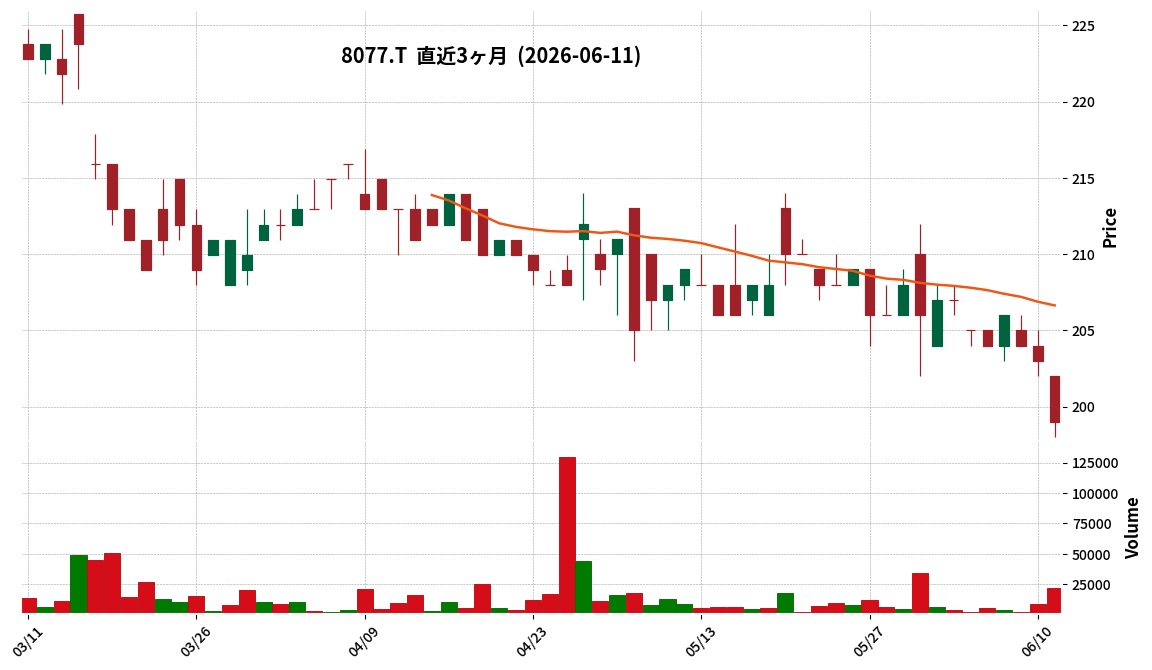
8077|トルク
199.0
▼ -1.97%
This article is an AI-generated summary and analysis of official IR disclosures.
📄 Announcement (AI-Reviewed)
- TORQ Corporation’s consolidated results for the second quarter (interim) of the fiscal year ending October 2026 showed net sales of ¥10,606 million (down 6.6% year-on-year), operating profit of ¥326 million (down 43.4%), ordinary profit of ¥399 million (down 33.5%), and net income attributable to owners of parent of ¥249 million (down 37.0%).
- As of the end of the interim period, consolidated total assets were ¥34,080 million (up 0.1% from the previous fiscal year-end), net assets were ¥14,457 million (up 1.2%), and the equity ratio was 42.4%.
- The forecast for the annual dividend for the fiscal year ending October 2026 remains unchanged from the most recently announced forecast, with an interim dividend of ¥3.00 and a year-end dividend of ¥3.00, totaling ¥6.00.
- The full-year consolidated earnings forecast for the fiscal year ending October 2026 also remains unchanged, projecting net sales of ¥21,000 million (down 6.8% from the previous year), operating profit of ¥650 million (down 35.6%), ordinary profit of ¥950 million (down 25.7%), and net income attributable to owners of parent of ¥550 million (down 39.2%).
- During this interim period, the company focused on improving the “Neji Net” web sales system and expanding product offerings, but the challenging market conditions due to labor shortages and rising material costs in the construction industry impacted orders and demand.
🤖 AI Perspective
The announced results indicate a decline in revenue and all profit metrics compared to the prior interim period, suggesting that the challenging business environment in the construction industry has affected the company’s performance. However, the full-year earnings forecast remains unchanged, which could imply an expectation of recovery in the second half of the fiscal year. The evolution of the business environment and the progress of the company’s initiatives will be worth monitoring.
Disclaimer: This article is for informational purposes only and does not constitute investment advice.
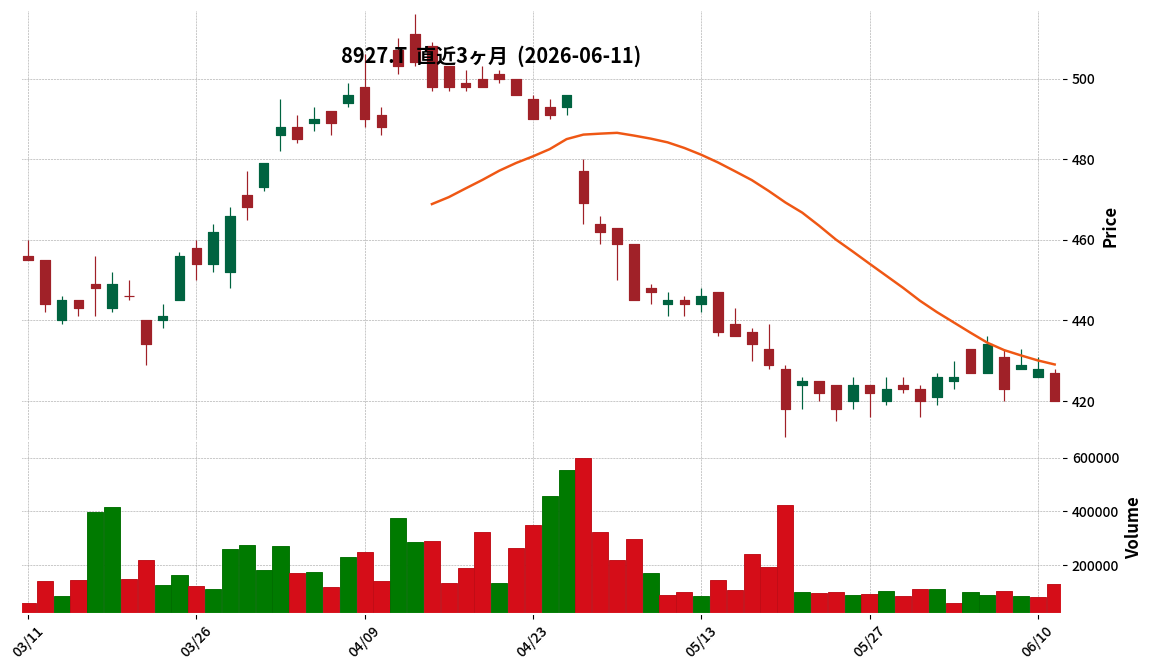
8927|明豊エンター
420.0
▼ -1.87%
This article is an AI-generated summary and analysis of official IR disclosures.
📄 Announcement (AI-Reviewed)
- Meiho Enterprise announced its consolidated financial results for the third quarter of the fiscal year ending July 2026 (August 1, 2025, to April 30, 2026).
- Consolidated net sales for the cumulative period reached ¥23.47 billion, marking an 18.3% increase compared to the same period of the previous year.
- Operating profit was ¥2.66 billion (up 28.1% year-on-year), and ordinary profit was ¥2.20 billion (up 39.3% year-on-year).
- Net profit attributable to owners of the parent reached ¥1.56 billion (up 49.5% year-on-year), with basic earnings per share of ¥51.67.
- The full-year consolidated earnings forecast and annual dividend forecast (¥6.50 for year-end, total ¥13.00) remain unchanged from the most recently published figures.
- In the Real Estate Development segment, sales were ¥18.96 billion (up 17.5% year-on-year) and segment profit was ¥2.64 billion (up 15.4% year-on-year).
🤖 AI Perspective
Meiho Enterprise’s Q3 FY2026 results demonstrate strong year-on-year growth across net sales and all profit metrics, with a particularly significant increase in net profit attributable to owners of the parent. This performance appears to be primarily driven by robust property handovers within the real estate development segment. The reiteration of the full-year earnings forecast suggests that the company considers its current progress to be in line with its initial plans.
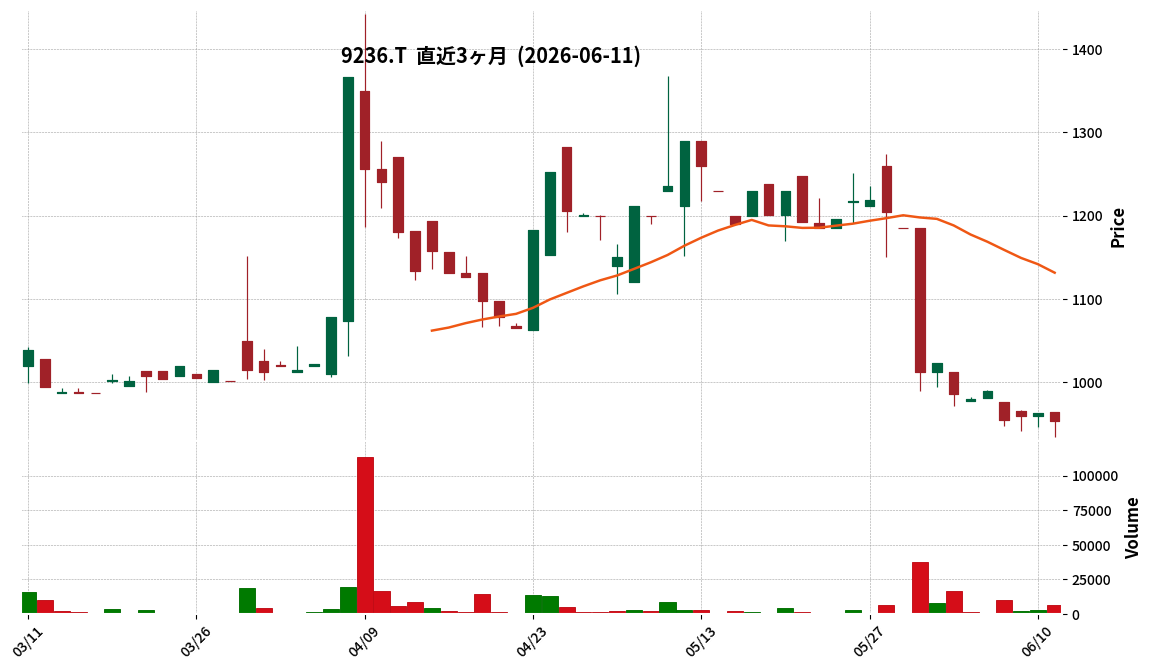
9236|G-ジャパンM&A
954.0
▼ -0.93%
📎 Source:G-ジャパンM&A Official IR →
This article is an AI-generated summary and analysis of official IR disclosures.
📄 Announcement (AI-Reviewed)
- For the second quarter of the fiscal year ending October 2026 (interim), net sales were ¥526 million, representing a 41.2% increase compared to the previous interim period.
- Operating profit for the same interim period was ¥142 million (compared to an operating loss of ¥17 million in the prior interim period), ordinary profit was ¥159 million (compared to an ordinary loss of ¥12 million), and interim net profit was ¥127 million (compared to an interim net loss of ¥8 million), all turning profitable.
- Interim net profit per share was recorded at ¥85.93.
- The full-year earnings forecast for the fiscal year ending October 2026 has been revised upwards, projecting net sales of ¥990 million (a 51.3% increase year-on-year) and net profit of ¥143 million (net profit per share of ¥96.71).
- The annual dividend forecast has been revised to ¥10.00 per share for the fiscal year-end.
🤖 AI Perspective
G-Japan M&A Solutions demonstrated significant revenue growth and a return to profitability across key earnings metrics in its interim results, compared to the previous year. This performance appears to be driven by a robust increase in advisory contracts and completed deals, alongside an expansion of its M&A advisor team. The upward revision of full-year forecasts and dividend expectations may suggest positive momentum for the company.
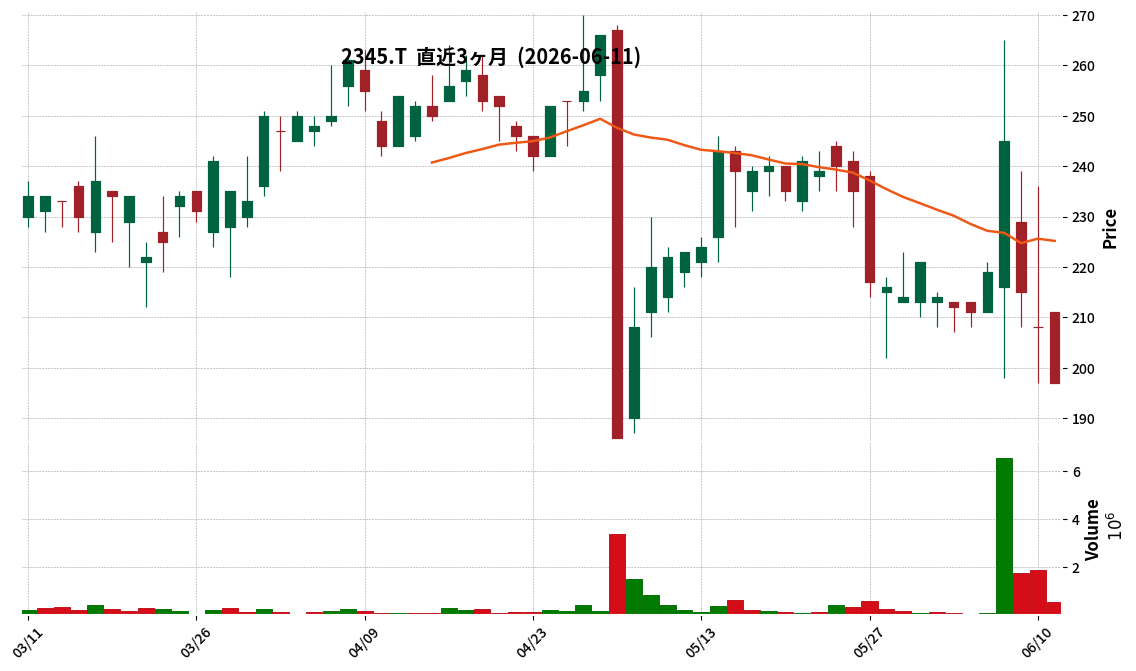
2345|HODL1
197.0
▼ -5.29%
This article is an AI-generated summary and analysis of official IR disclosures.
📄 Announcement (AI-Reviewed)
- HODL1 Co., Ltd. signed a basic agreement for business alliance (MoU) with Hakuhodo Key3 Inc. on June 11, 2026, aimed at promoting digital bond-related businesses.
- The alliance seeks to combine HODL1’s blockchain technology with Hakuhodo Key3’s expertise in Web3 business production and marketing support to concretely advance digital bond-related projects.
- Collaborative activities include planning, promotion, and development of digital bond projects, integration of stablecoin settlements, and joint initiatives such as establishing a Steering Committee, external presentations, event participation, joint marketing, and community building.
- Through this MoU, HODL1 aims to generate revenue from support fees for digital bond project planning and structuring, system development and technology implementation support, stablecoin settlement introduction and operation support, and marketing and community building assistance.
- HODL1 plans to initiate the first digital bond project by the end of 2026, aiming to create revenue-generating transactions through digital bond issuance support and stablecoin settlement implementation.
🤖 AI Perspective
This alliance could indicate HODL1’s strategic move to capitalize on the growing digital bond market by leveraging Hakuhodo Key3’s strong presence in Web3 business development and marketing. The combination of HODL1’s specialized blockchain technology and Hakuhodo Key3’s market engagement capabilities may create new revenue streams and accelerate the adoption of digital bonds across various industries, including entertainment and infrastructure. Investors may monitor the progress of specific project formations and the actual generation of revenue, as the current MoU does not yet carry legal binding force.
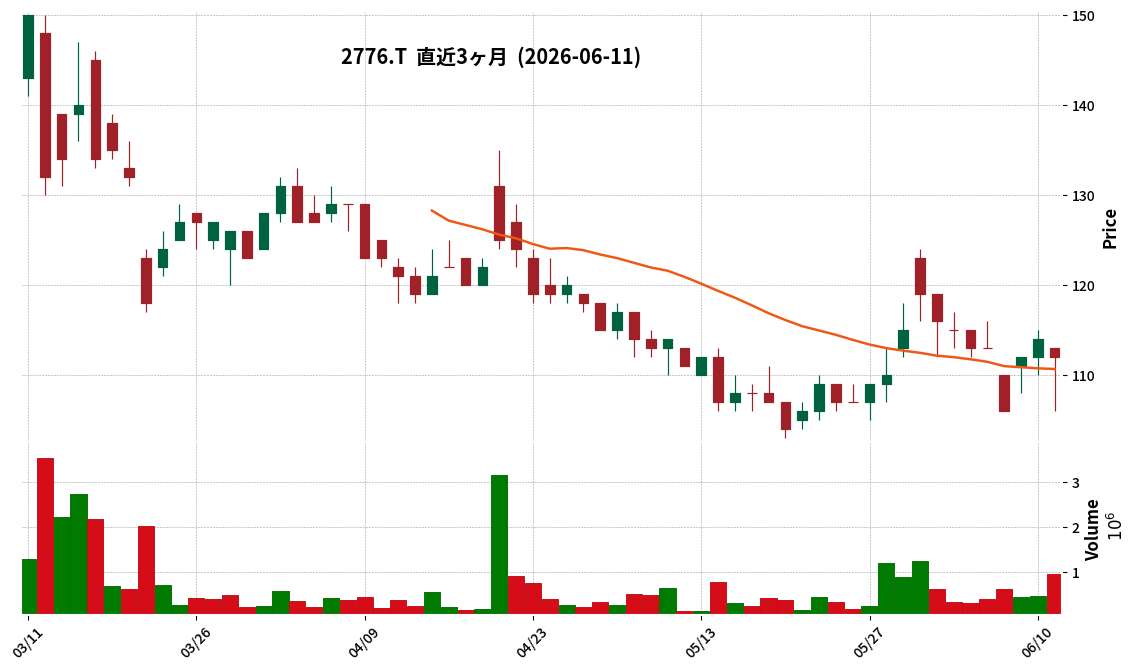
2776|新都HD
112.0
▼ -1.75%
This article is an AI-generated summary and analysis of official IR disclosures.
📄 Announcement (AI-Reviewed)
- Shinto Holdings (2776) reported consolidated net sales of ¥18,849 million for the first quarter of the fiscal year ending January 2027 (February 1, 2026, to April 30, 2026), marking a 326.59% increase year-on-year.
- Operating income turned profitable at ¥69 million (compared to an operating loss of ¥29 million in the prior year), and ordinary income also turned profitable at ¥64 million (compared to an ordinary loss of ¥97 million in the prior year).
- Net income attributable to parent company shareholders was a positive ¥9 million (compared to a net loss of ¥121 million in the prior year).
- Diluted earnings per share for the quarter were ¥0.17 (compared to ¥-3.11 in the prior year).
- As of the end of the first quarter, total assets stood at ¥16,449 million, net assets at ¥4,165 million, and the equity ratio at 20.41%.
- The full-year consolidated earnings forecast remains unchanged from the most recently announced figures: net sales of ¥48,330 million, operating income of ¥784 million, ordinary income of ¥715 million, net income attributable to parent company shareholders of ¥202 million, and basic earnings per share of ¥3.78.
🤖 AI Perspective
Shinto Holdings’ Q1 results show a significant increase in revenue and a return to profitability across key income metrics, which may suggest a positive operational shift. The metal recycling business segment’s substantial sales growth of 344.67% year-on-year, alongside increased sales in real estate-related services and other businesses, appears to be a key driver for these results. The progress against the full-year forecast will be a crucial point for investors to monitor going forward.
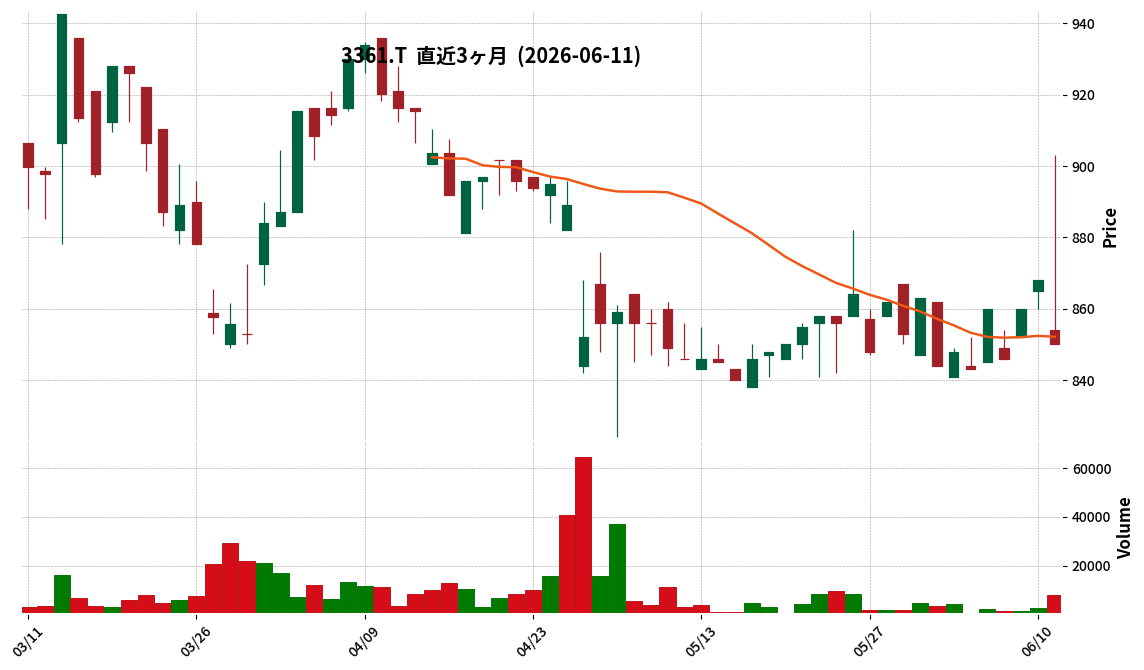
3361|トーエル
850.0
▼ -2.07%
This article is an AI-generated summary and analysis of official IR disclosures.
📄 Announcement (AI-Reviewed)
- TOELL Co., Ltd. announced its consolidated financial results for the fiscal year ended April 2026.
- Net sales were JPY 27,039 million, a decrease of 1.3% compared to the previous fiscal year.
- Operating profit reached JPY 1,982 million (up 2.4% year-on-year), and ordinary profit was JPY 2,455 million (up 8.4% year-on-year).
- Net profit attributable to owners of parent significantly increased by 91.6% year-on-year to JPY 1,612 million.
- For the fiscal year ending April 2027, the company forecasts consolidated net sales of JPY 29,460 million (up 9.0% year-on-year) and net profit attributable to owners of parent of JPY 1,310 million (down 18.8% year-on-year).
- The annual dividend per share is JPY 23.00, same as the previous fiscal year.
574A|P-LASSIC
887.0
▲ +0.00%
📎 Source:P-LASSIC Official IR →
This article is an AI-generated summary and analysis of official IR disclosures.
📄 Announcement (AI-Reviewed)
- P-LASSIC reported net sales of ¥4,987 million for the fiscal year ended April 2026 (non-consolidated), marking a 4.2% increase from the previous year.
- Operating profit was ¥191 million (down 5.5% year-on-year), ordinary profit was ¥192 million (down 7.5% year-on-year), and net profit was ¥118 million (down 19.0% year-on-year).
- Earnings per share (EPS) stood at ¥37.40, compared to ¥46.20 in the previous fiscal year.
- In terms of financial position, total assets increased to ¥1,832 million (up ¥65 million from prior year), net assets to ¥1,065 million (up ¥118 million), and the equity ratio rose to 58.1% from 53.6%.
- The forecast for the fiscal year ending April 2027 projects net sales of ¥5,517 million (up 10.6% year-on-year), operating profit of ¥72 million (down 62.2%), ordinary profit of ¥59 million (down 69.2%), and net profit of ¥37 million (down 68.8%).
🤖 AI Perspective
P-LASSIC’s financial results for the fiscal year ended April 2026 show revenue growth, but a decline in profits. This was attributed to increased expenses related to business expansion, including reinforced hiring, system-related costs, and temporary depreciation from the relocation of the Tokyo head office. The forecast for the fiscal year ending April 2027 projects continued sales growth but a significant decrease in various profit metrics, suggesting investors may want to monitor the company’s cost structure and strategies for improving profitability moving forward.
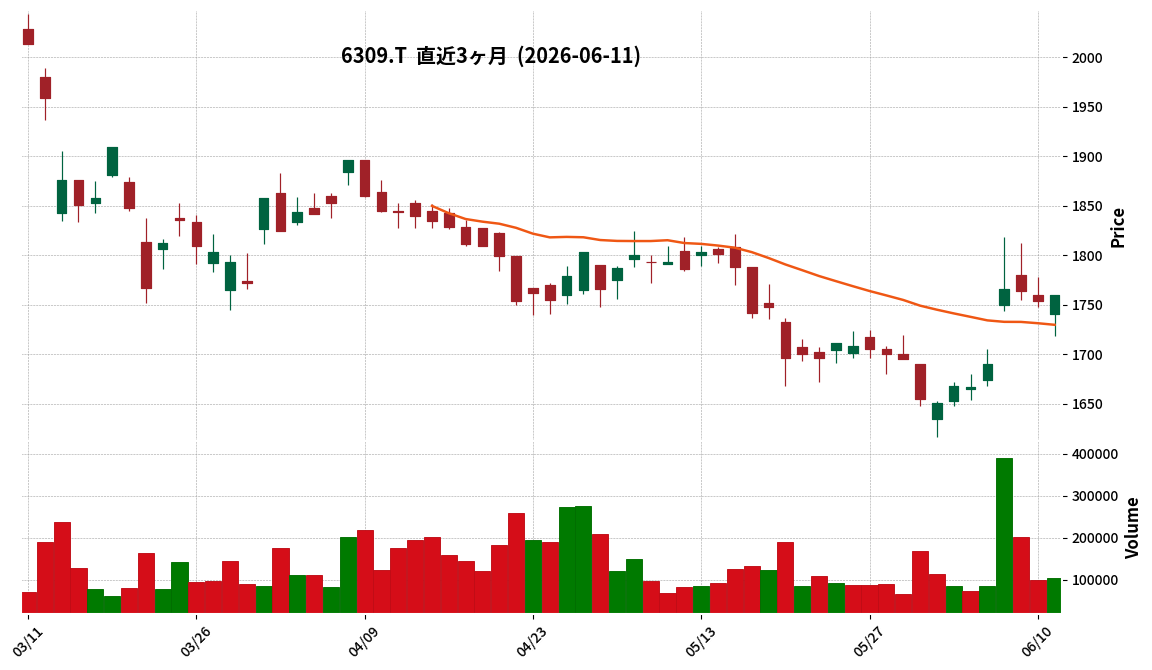
6309|巴工業
1760.0
▲ +0.34%
This article is an AI-generated summary and analysis of official IR disclosures.
📄 Announcement (AI-Reviewed)
- Consolidated net sales for the second quarter of FY2026 (interim) were ¥30,849 million, representing a 1.5% decrease compared to the previous interim period.
- Net profit attributable to owners of the parent company increased by 8.9% to ¥2,793 million compared to the prior interim period.
- Operating profit was ¥3,703 million (△0.2% decrease YoY), and ordinary profit was ¥3,794 million (1.8% increase YoY).
- The full-year dividend forecast for FY2026 is ¥76.00 per share (interim: ¥36.00, year-end: ¥40.00), representing an increase of ¥15.67 compared to the split-adjusted FY2025 annual dividend of ¥60.33.
- The full-year consolidated performance forecast remains unchanged, with net sales of ¥62,900 million (6.0% increase YoY) and net profit attributable to owners of the parent company of ¥4,400 million (14.2% increase YoY).
🤖 AI Perspective
While sales experienced a slight decrease, the increase in net profit attributable to owners of the parent company could indicate shifts in the company’s profitability structure or the impact of specific factors. The upward revision of the annual dividend forecast may signal a positive stance on shareholder returns, potentially drawing investor interest. With the full-year earnings forecast remaining unchanged, the company’s performance in the latter half of the fiscal year will be a key area for investors to monitor.
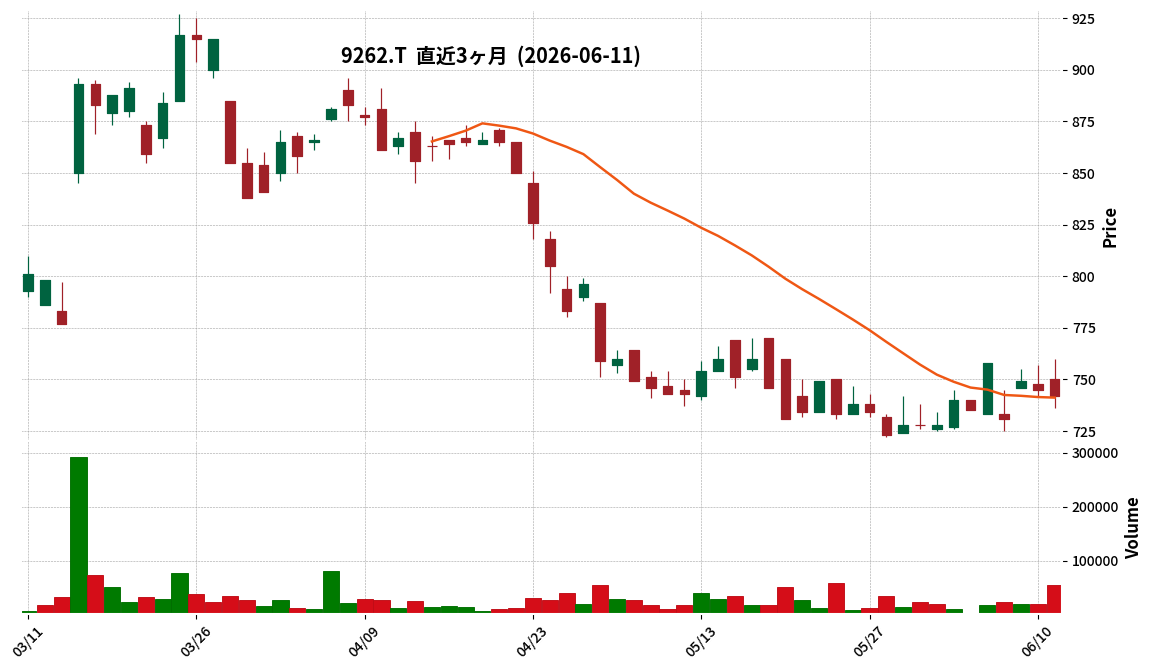
9262|シルバーライフ
742.0
▼ -0.40%
📎 Source:シルバーライフ Official IR →
This article is an AI-generated summary and analysis of official IR disclosures.
📄 Announcement (AI-Reviewed)
- Silver Life Co., Ltd. announced its non-consolidated financial results for the third quarter of the fiscal year ending July 2026 (August 1, 2025 – April 30, 2026).
- During this period, net sales were JPY 12,125 million (up 10.9% year-on-year), operating profit was JPY 794 million (up 18.3% year-on-year), ordinary profit was JPY 916 million (up 17.4% year-on-year), and quarterly net profit was JPY 563 million (up 17.9% year-on-year).
- By sales segment, sales to FC加盟店 (franchise stores) were JPY 7,057 million (up 2.0% year-on-year), sales to elderly care facilities, etc. were JPY 1,899 million (up 40.1% year-on-year), and direct sales and others were JPY 3,168 million (up 18.9% year-on-year).
- As of the end of the third quarter, total assets stood at JPY 10,720 million, net assets at JPY 7,363 million, and the equity ratio was 68.7%.
- The full-year earnings forecast for the fiscal year ending July 2026 remains unchanged from the most recently published figures, projecting net sales of JPY 15,500 million, operating profit of JPY 1,040 million, ordinary profit of JPY 1,170 million, and net profit of JPY 810 million.
🤖 AI Perspective
Silver Life’s Q3 FY2026 results show double-digit growth in sales and all profit categories, with notable expansion in sales to elderly care facilities. This suggests that price revisions and increased in-house production may have contributed to profitability improvements despite rising raw material and logistics costs. Investors may monitor the company’s progress against its unchanged full-year forecasts to assess the sustainability of this performance.
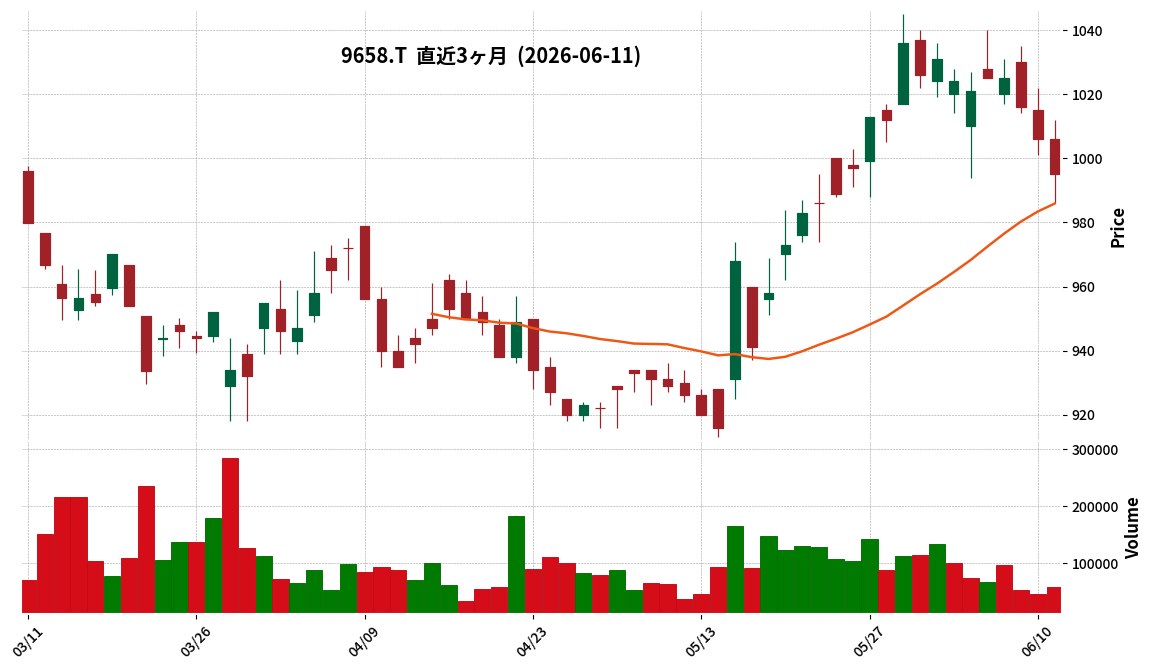
9658|ビジ太田昭和
995.0
▼ -1.09%
This article is an AI-generated summary and analysis of official IR disclosures.
📄 Announcement (AI-Reviewed)
- Business Brain Showa-Ota Inc. has announced corrections and additions to its “FY2026/3 Earnings Presentation Materials” initially disclosed on May 14, 2026.
- The reason for the correction is an error in the “Performance Forecast by Segment” section.
- The reason for the addition is the relevance of matters concerning the “Notice Regarding Business Alliance with Nihon Knowledge Co., Ltd.” disclosed on May 15, 2026, to the overall document structure.
- The specific corrected section is the FY2027/3 performance forecast by segment, highlighted with an underline within a red frame.
- The table of contents, including the progress report for the Mid-term Management Plan BBS2026, the prior investment plan for G2030 realization, FY2026/3 earnings explanation, and FY2027/3 performance forecast, remains consistent.
🤖 AI Perspective
This correction and addition appear to aim at ensuring the accuracy of disclosed materials and providing investors with more complete information. The revision to segment-specific performance forecasts could be a significant factor in understanding the company’s future business strategy and revenue structure. Furthermore, the inclusion of information regarding the business alliance with Nihon Knowledge Co., Ltd. may supplement the company’s future business developments and its strategy to transition to an AI-driven business model.
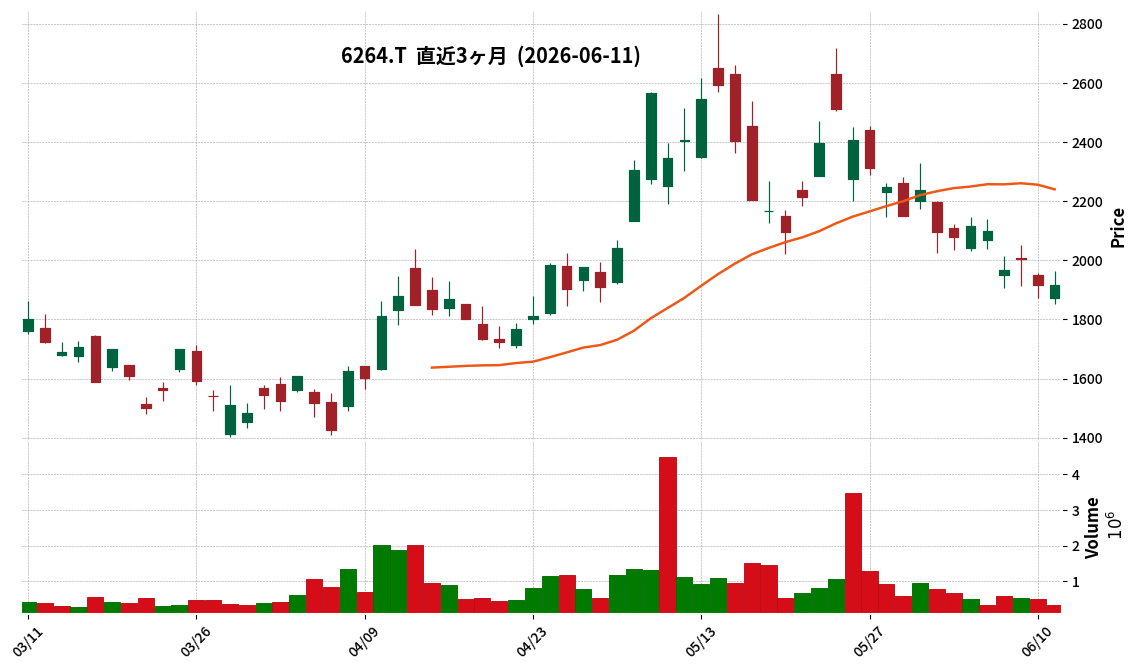
6264|マルマエ
1915.0
▲ +0.00%
This article is an AI-generated summary and analysis of official IR disclosures.
📄 Announcement (AI-Reviewed)
- Marumae Co., Ltd. announced on June 11, 2026, revisions to its consolidated earnings forecast and dividend forecast for the fiscal year ending August 2026.
- Net sales are revised from ¥17,700 million to ¥20,000 million, operating profit from ¥3,200 million to ¥4,100 million, ordinary profit from ¥3,000 million to ¥3,900 million, and profit attributable to owners of parent from ¥2,700 million to ¥3,300 million.
- The revisions are attributed to the favorable performance of the semiconductor manufacturing equipment market and a rapid expansion in orders received by the company group, with strong demand outlooks from all relevant customers.
- The year-end dividend forecast is revised from ¥19 per share to ¥26 per share, making the total annual dividend ¥26.00.
- The dividend revision is based on the company’s policy of maintaining a dividend payout ratio target of 35% or more, reflecting the updated earnings forecast.
🤖 AI Perspective
The upward revision of Marumae’s earnings forecast suggests a strong correlation with the robust demand in the semiconductor manufacturing equipment market. The significant percentage increases across key financial metrics could indicate an accelerating growth momentum for the company. Furthermore, the increased dividend forecast reflects a commitment to shareholder returns, aligning with the company’s stated payout ratio policy, which is a point worth monitoring for investors.
9936|王将フード
2719.0
▲ +1.64%
This article is an AI-generated summary and analysis of official IR disclosures.
📄 Announcement (AI-Reviewed)
- Ohsho Food Service Co., Ltd. resolved to expand and digitize its shareholder benefit program at a board meeting held on June 11, 2026.
- The value of the gift certificates will be increased by approximately 1.25 times, varying by the number of shares held. For example, shareholders holding 100 to less than 300 shares will receive an increase from 4,000 yen to 5,000 yen annually, and those holding 4,000 or more shares will see an increase from 35,000 yen to 42,000 yen annually.
- The traditional paper gift certificates will be replaced with an electronic ticket format, usable via smartphones and also printed paper.
- Digitization introduces features such as usage in 1-yen increments, a gifting function for family and friends, and a sharing function among multiple users.
- The process for exchanging gift certificates for company products (e.g., ramen packs) for shareholders unable to visit stores will be moved online, and the product exchange course lineup will be revised.
- The new shareholder benefit program will be applicable to shareholders recorded in the shareholder registry as of September 30, 2026.
🤖 AI Perspective
This enhancement of the shareholder benefit program suggests a commitment to increasing shareholder returns and improving corporate value. The digitization of the gift certificates aims to improve convenience for shareholders while promoting environmental sustainability. Features like 1-yen increment usage and the gifting option could broaden the appeal and utility of the shareholder benefits. Investors may wish to monitor the implementation and impact of these changes, which are set to begin from September 2026.
5132|G-pluszero
1558.0
▲ +11.44%
📎 Source:G-pluszero Official IR →
This article is an AI-generated summary and analysis of official IR disclosures.
📄 Announcement (AI-Reviewed)
- G-pluszero published Q&A and an online briefing video for its Q2 FY2026 financial results on June 11, 2026.
- The company identified two main factors for the recent sharp stock price decline: internal (insufficient IR/PR for full-scale AI projects in sales) and external (market trends like “SaaS is Dead” and perceived value shift to generative AI engines).
- AEI Operator’s scope of supported operations is expected to expand, currently handling high-difficulty tasks like personal information hearings at securities firms.
- Delays in IR/PR are attributed to the strategic importance and sensitivity of information disclosure from client side, with an expectation that stock prices will reflect performance once results become public.
- The lower Q2 revenue growth rate compared to the full-year forecast was an intentional plan, prioritizing engineer and scientist resources for service development in the first half.
🤖 AI Perspective
The company’s detailed responses to investor questions regarding recent market concerns provide clarity on both internal and external factors impacting its performance. The emphasis on expanding AEI Operator’s capabilities and plans for early disclosure of AI implementation successes could be key areas for investors to monitor for future growth indicators. Furthermore, the explanation for the planned lower revenue growth in the first half highlights a strategic investment approach, which may influence how investors perceive its medium-to-long-term trajectory.
2164|地域新聞社
288.0
▼ -0.69%
This article is an AI-generated summary and analysis of official IR disclosures.
📄 Announcement (AI-Reviewed)
- Chiiki Shinbunsha resolved at its Board of Directors meeting on June 5, 2026, to establish a wholly-owned subsidiary and commence paid job placement services.
- The new subsidiary is named “Allegro Vivace Co., Ltd.”, established on June 11, 2026, with a capital of 10 million yen.
- The basic agreement for business integration with UniGrowth Co., Ltd. was dissolved, with discussions officially concluded at the Board of Directors meeting on May 12, 2026.
- To support the launch of the paid job placement business, a partnership agreement for new business development support was signed with AO Co., Ltd. on May 26, 2026.
- The company anticipates a limited impact on its current fiscal year (ending August 2026) performance, with contributions expected from the subsequent fiscal year.
🤖 AI Perspective
Chiiki Shinbunsha’s decision to establish a wholly-owned subsidiary for its job placement business, rather than proceeding with integration with UniGrowth, suggests a strategic shift towards greater direct control over this key growth area. The collaboration with AO Co., Ltd. for business launch support indicates a focused effort to leverage specialized expertise and achieve early monetization, potentially mitigating initial operational risks. This move aligns with the company’s “Strategic Plan” to build a regional revitalization model connecting local businesses with talent.
6558|G-クックビズ
652.0
▲ +2.68%
📎 Source:G-クックビズ Official IR →
This article is an AI-generated summary and analysis of official IR disclosures.
📄 Announcement (AI-Reviewed)
- Cookbiz Co., Ltd. (G-Cookbiz) resolved on June 11, 2026, to acquire shares and subscribe to a third-party allotment of TECH CREW Corporation, making it a consolidated subsidiary.
- By July 1, 2026, G-Cookbiz will acquire 12,044 outstanding common shares and subscribe to 21,250 common shares through a third-party allotment of TECH CREW Corporation.
- Following these transactions, G-Cookbiz will hold 79.5% of TECH CREW Corporation’s voting rights.
- TECH CREW Corporation provides the cloud labor management system “JINJI CREW” and reported sales of 164,198 thousand yen and an operating loss of △46,140 thousand yen for the fiscal year ended March 2026.
- The impact of this acquisition and third-party allotment on G-Cookbiz Group’s consolidated performance for the fiscal year ending November 2026 is currently under review, and any material developments will be disclosed promptly.
🤖 AI Perspective
This acquisition appears to be a strategic move by G-Cookbiz to expand its service offerings within the restaurant industry, moving beyond talent acquisition to encompass labor management solutions. Incorporating TECH CREW’s product development capabilities could enhance G-Cookbiz’s DX acceleration efforts. While TECH CREW has reported recent losses, the IR indicates an improving profitability trend, suggesting potential for synergy benefits post-integration that investors may want to monitor.
💡 Start investing with IR insights
※ 本ページには広告が含まれます(PR)
Disclaimer: This article is for informational purposes only and does not constitute investment advice. All investment decisions are at your own risk.

コメント