
📌 Today’s Highlights
Today we cover 80 IR announcements. Notable among them: 橋本総業HD (7570), G-note (5243), ヨドコウ (5451). Use the table of contents below to navigate to each company.
- 7570|橋本総業HD
- 5243|G-note
- 5451|ヨドコウ
- 3401|帝人
- 4203|住友ベーク
- 9739|NSW
- 4404|ミヨシ油脂
- 9101|郵船
- 2790|ナフコ
- 5035|G-HOUSEI
- 3777|G-環境フレンドリー
- 7443|横浜魚類
- 1807|佐藤渡辺
- 3447|信和
- 4624|イサム塗料
- 5660|神鋼鋼線
- 6364|AIRMAN
- 6928|エノモト
- 7636|ハンズマン
- 9273|コーア商事HD
- 3577|東海染工
- 7199|プレミアグループ
- 2903|シノブフーズ
- 4186|東応化
- 4189|KHネオケム
- 5867|G-エスネット
- 7994|オカムラ
- 8850|スターツ
- 9304|渋沢倉
- 1813|不動テトラ
- 1783|fantasista
- 5713|住友鉱
- 1447|G-SAAFHD
- 1826|佐田建
- 204A|P-タイヨーパッケー
- 2763|エフティグループ
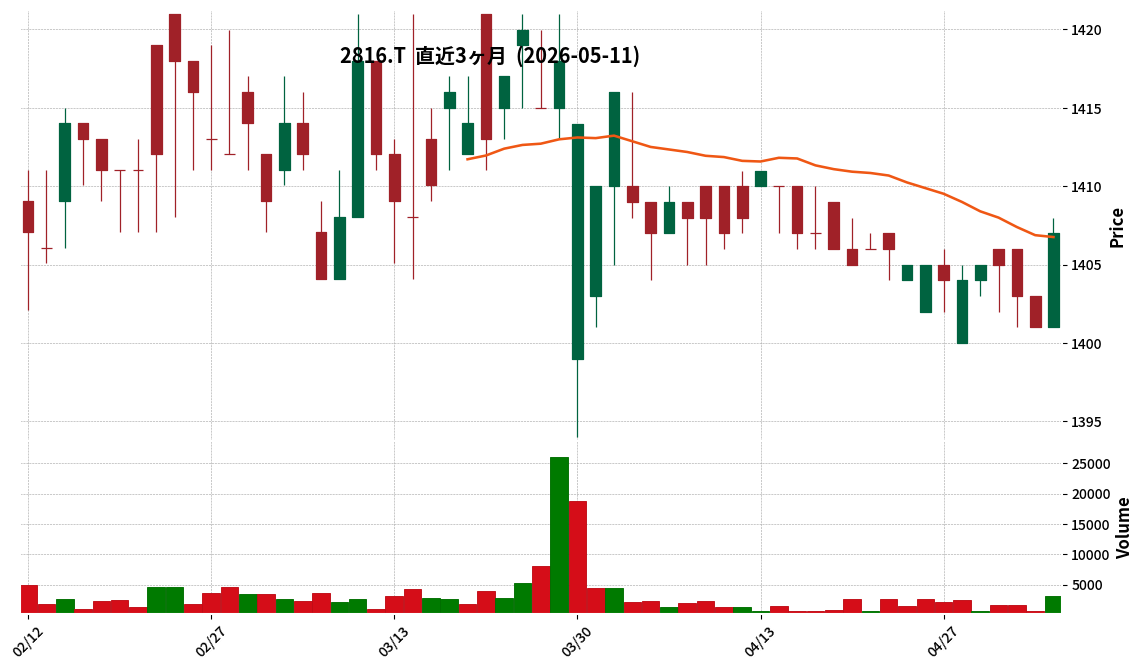
- 2816|ダイショー
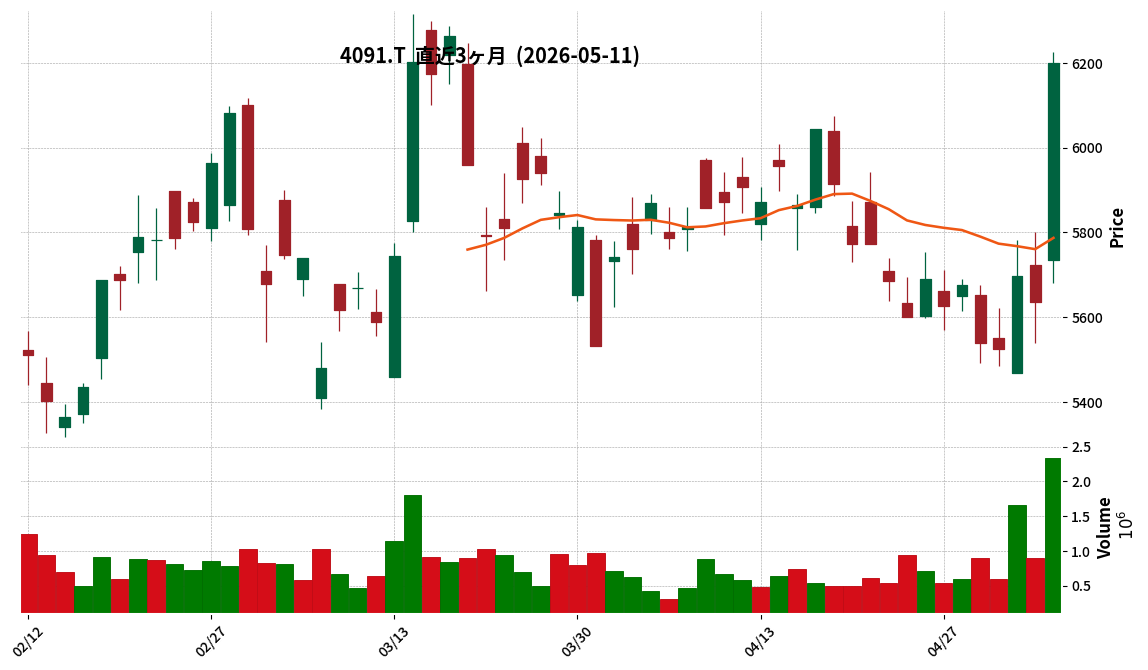
- 4091|日本酸素HD
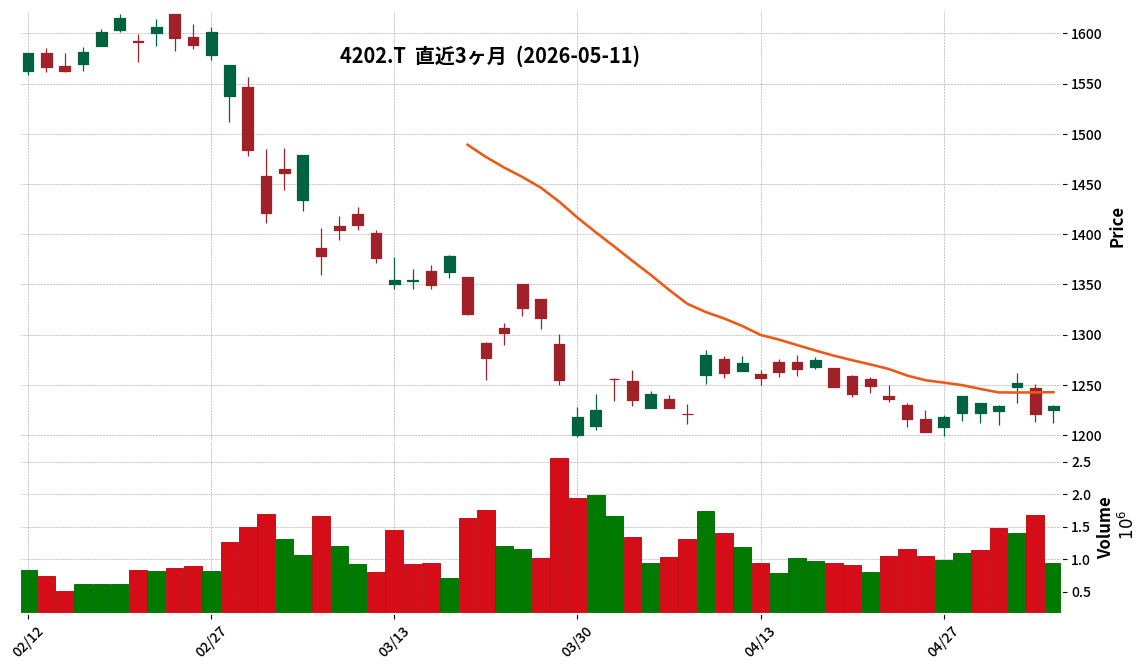
- 4202|ダイセル
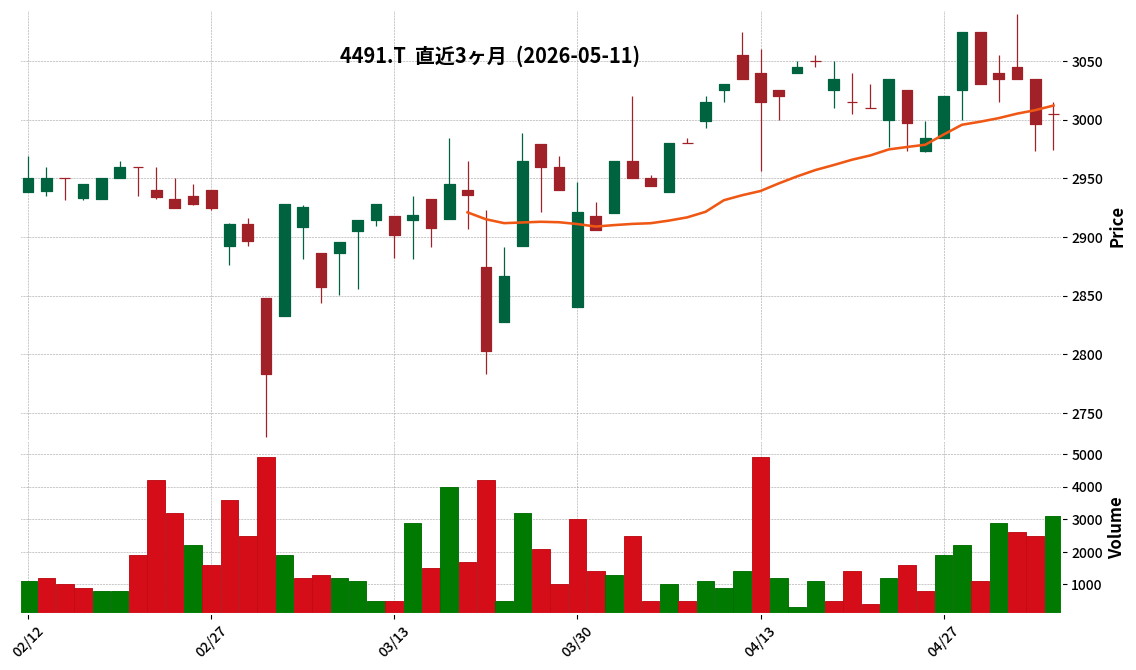
- 4491|Cマネージメント
- 4633|サカタインクス
- 7931|未来工業
- 9342|G-スマサポ
- 130A|G-VIS
- 1375|ユキグニファクトリー
- 1414|ショーボンド
- 189A|G-D&Mカンパニー
- 1992|神田通機
- 265A|G-エイチエムコム
- 3070|G-ジェリービーンズ
- 3288|オープンハウスG
- 3294|イーグランド
- 3317|フライングG
- 3970|G-イノベーション
- 4385|メルカリ
- 438A|G-インフキュリオン
- 4553|東和薬品
- 4568|第一三共
- 4627|ナトコ
- 6632|JVCKW
- 2811|カゴメ
- 4062|イビデン
- 4884|G-クリングル
- 4960|ケミプロ化成
- 9664|御園座
- 208A|構造計画HD
- 2902|太陽化
- 3276|JPMC
- 3762|テクマト
- 4366|ダイトーケミックス
- 6023|ダイハツインフィ
- 7537|丸文
- 7846|パイロット
- 8518|アジア投資
- 5016|JX金属
- 1787|ナカボーテック
- 2162|nms HD
- 6466|TVE
- 8173|Joshin
- 9942|ジョイフル
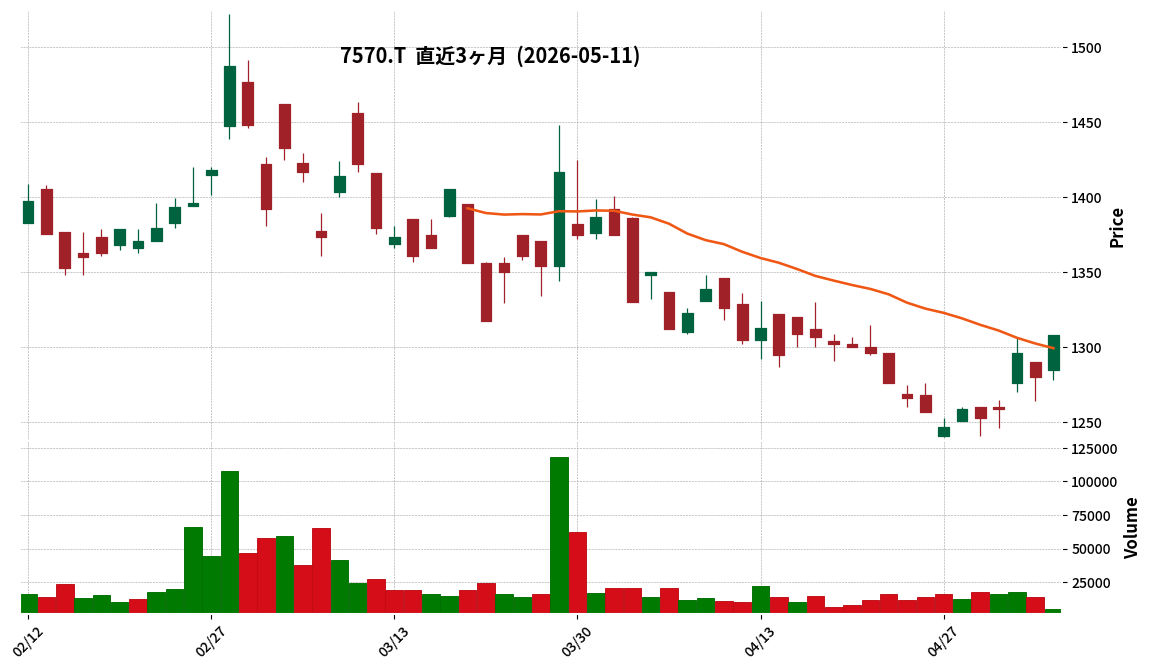
7570|橋本総業HD
1308.0
▲ +2.19%
This article is an AI-generated summary and analysis of official IR disclosures.
📄 Announcement (AI-Reviewed)
- On May 11, 2026, Hashimoto Sogyo Holdings Co., Ltd. (TSE Standard, Code: 7570) announced its dividend forecast for the fiscal year ending March 2027.
- The company plans to pay an annual dividend of JPY 52.00 per share for the fiscal year ending March 2027, consisting of JPY 26.00 for the interim and JPY 26.00 for the year-end dividend.
- This represents a JPY 2.00 increase from the previous fiscal year (March 2026), which had an annual dividend of JPY 50.00 (JPY 25.00 interim, JPY 25.00 year-end).
- With this increase, the company is set to achieve its 11th consecutive year of dividend increases, including commemorative dividends.
- The company’s basic policy for profit distribution includes stable dividends through improved profitability, performance-linked shareholder returns, and maintaining a strong management foundation through internal reserves.
🤖 AI Perspective
- The announcement of an 11th consecutive year of dividend increases may signal a consistent commitment to shareholder returns and robust financial health.
- This long-term trend of increasing dividends could be viewed by investors as an indication of stable business performance and a positive management outlook.
- The stated aim for continued revenue growth and further shareholder returns might suggest a proactive stance towards enhancing corporate value in the medium term.
- Disclaimer: This article is for informational purposes only and does not constitute investment advice.
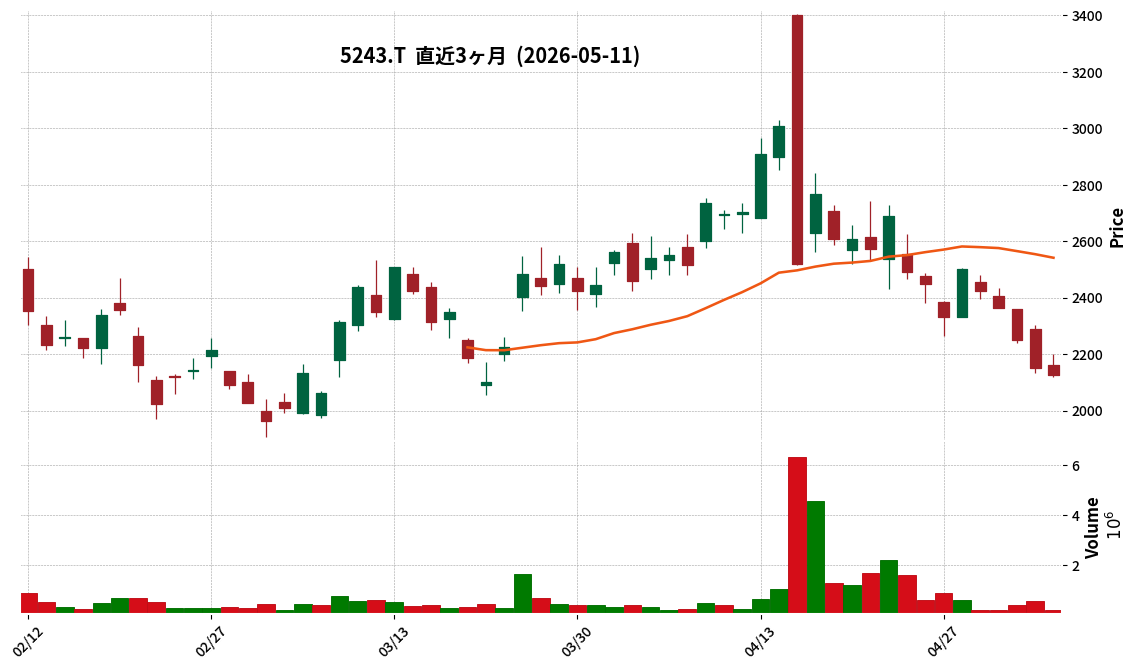
5243|G-note
2128.0
▼ -1.02%
This article is an AI-generated summary and analysis of official IR disclosures.
📄 Announcement (AI-Reviewed)
- For the first quarter of the fiscal year ending November 2026, G-note reported Net Sales of 1,218 million yen (up 27.3% year-on-year), Adjusted EBITDA of 255 million yen (up 1,273.5% year-on-year), and Operating Income of 235 million yen (up 4,167.1% year-on-year).
- Despite strong Q1 progress rates against full-year forecasts (Net Sales 21.8%, Adjusted EBITDA 31.6%), the full-year earnings forecast remains unchanged. This is attributed to anticipated increases in personnel costs from hiring in Q2 and beyond, and the concentration of the GENIAC project’s 500 million yen full-year sales in Q2 onwards.
- The company is enhancing operational efficiency through AI utilization, leading to a decrease in headcount at the end of Q1 compared to the previous quarter. However, a net increase of 10-20 personnel is projected from Q2, primarily in new business areas.
- The note business’s Q1 GMV reached 6,203 million yen (up 25% year-on-year), with the company expressing confidence in maintaining a high GMV growth rate of approximately 20-30% going forward.
- Transitioning to the Prime Market is positioned as a key mid-to-long-term management objective. While certain requirements such as tradable share ratio are met, profit criteria are not yet achieved. The company aims for Net Sales of 10 billion yen and an EBITDA margin of 30-40% around 2028-2030 to support this transition.
🤖 AI Perspective
The first quarter results demonstrate significant growth, particularly in profitability, suggesting that the company’s AI-driven productivity initiatives are effectively containing costs while business expands. The decision to maintain the full-year forecast, despite strong initial profit performance, appears to be a prudent approach, considering planned future personnel investments and specific project revenue recognition timelines. The sustained high growth in note’s GMV, coupled with the clear mid-to-long-term goal of a Prime Market transition and specified financial targets, could indicate a strategic focus on both current operational efficiency and future market positioning.
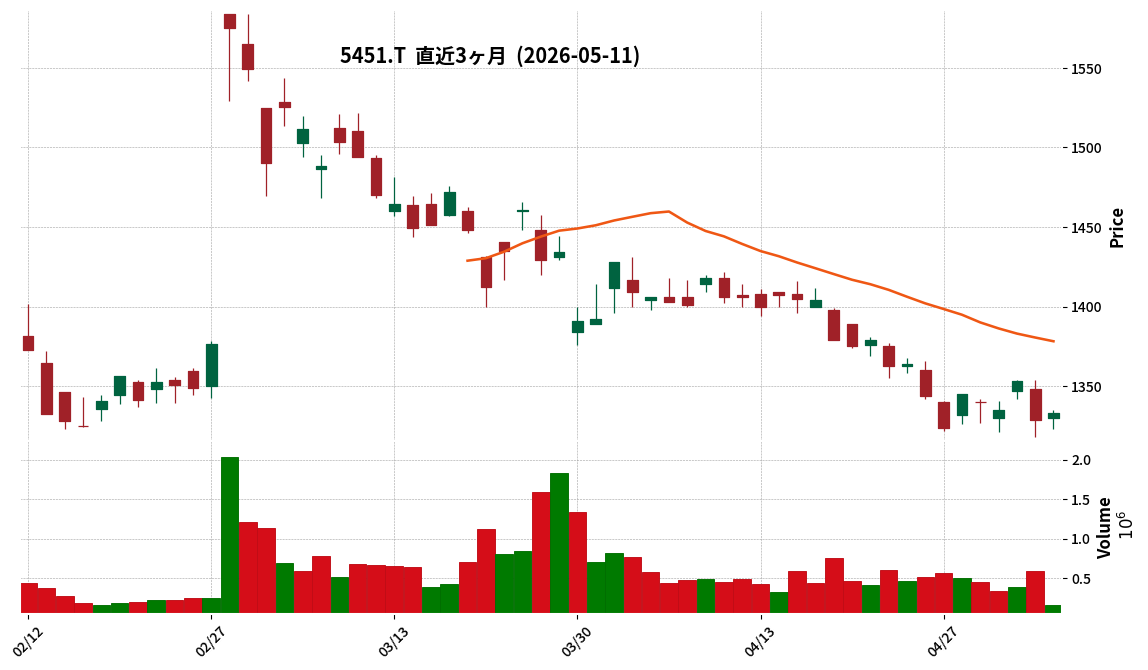
5451|ヨドコウ
1333.0
▲ +0.30%
This article is an AI-generated summary and analysis of official IR disclosures.
📄 Announcement (AI-Reviewed)
- YODOKO Co., Ltd. announced its consolidated financial results for the fiscal year ended March 2026. Sales reached ¥195,373 million (down 6.3% year-on-year), operating profit was ¥11,868 million (down 14.5%), and ordinary profit was ¥17,517 million (down 18.7%).
- Net profit attributable to owners of parent increased by 28.9% to ¥17,404 million for the period.
- The annual dividend for the fiscal year ended March 2026 is ¥91.00 per share, with the year-end dividend changed from the initially announced ¥69 to ¥71.
- For the fiscal year ending March 2027, the company forecasts consolidated sales of ¥196,000 million (up 0.3% year-on-year), operating profit of ¥10,300 million (down 13.2%), ordinary profit of ¥11,900 million (down 32.1%), and net profit attributable to owners of parent of ¥10,000 million (down 42.5%).
- The company implemented a 1-for-5 stock split of its common shares effective July 1, 2025. Per-share indicators and dividend figures are calculated and stated considering this stock split.
🤖 AI Perspective
For the fiscal year ended March 2026, while sales, operating profit, and ordinary profit decreased, the significant increase in net profit attributable to owners of parent stands out, and the factors contributing to this divergence may be a key point for investors. Looking ahead, the consolidated earnings forecast for the fiscal year ending March 2027 projects declines in key profit figures, suggesting that investors may want to monitor the company’s future business environment and strategies. The dividend trend, with ¥91 for the current period and a forecast of ¥53 for the next, could also attract interest, particularly in conjunction with the impact of the stock split.
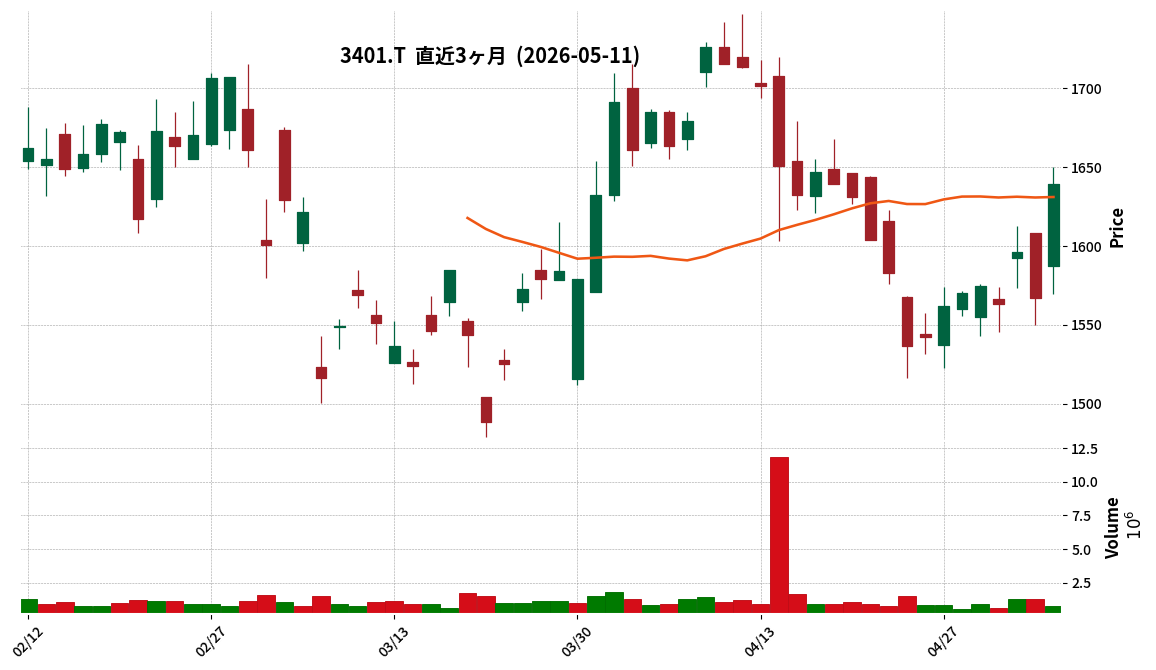
3401|帝人
1639.5
▲ +4.63%
This article is an AI-generated summary and analysis of official IR disclosures.
📄 Announcement (AI-Reviewed)
- Teijin reported consolidated revenue of JPY 873,190 million for the fiscal year ended March 31, 2026, marking a 13.2% decrease from the previous fiscal year.
- The net loss attributable to owners of parent amounted to JPY 88,003 million, a significant shift from the JPY 28,347 million profit recorded in the prior year.
- Business profit decreased by 6.6% to JPY 25,781 million, and the company posted an operating loss of JPY 70,714 million.
- Impairment losses were recorded in the Aramid and Healthcare business segments during the fiscal year.
- For the fiscal year ending March 31, 2027, the company forecasts consolidated revenue of JPY 850,000 million (a 2.7% decrease) and anticipates a return to net profit attributable to owners of parent of JPY 45,000 million.
- The annual dividend per share is projected to remain at JPY 50.00 for both FY2026/3 (actual) and FY2027/3 (forecast), comprising an interim dividend of JPY 25.00 and a year-end dividend of JPY 25.00.
🤖 AI Perspective
Teijin’s FY2026/3 results show a significant net loss primarily due to impairment charges, despite an increase in cash flow from operating activities. The company’s FY2027/3 forecast anticipates a return to profitability across business, operating, and net profit levels, which may suggest expected improvements from ongoing cost structure reforms and segment-specific strategies. The consistent dividend policy could indicate management’s confidence in future recovery.
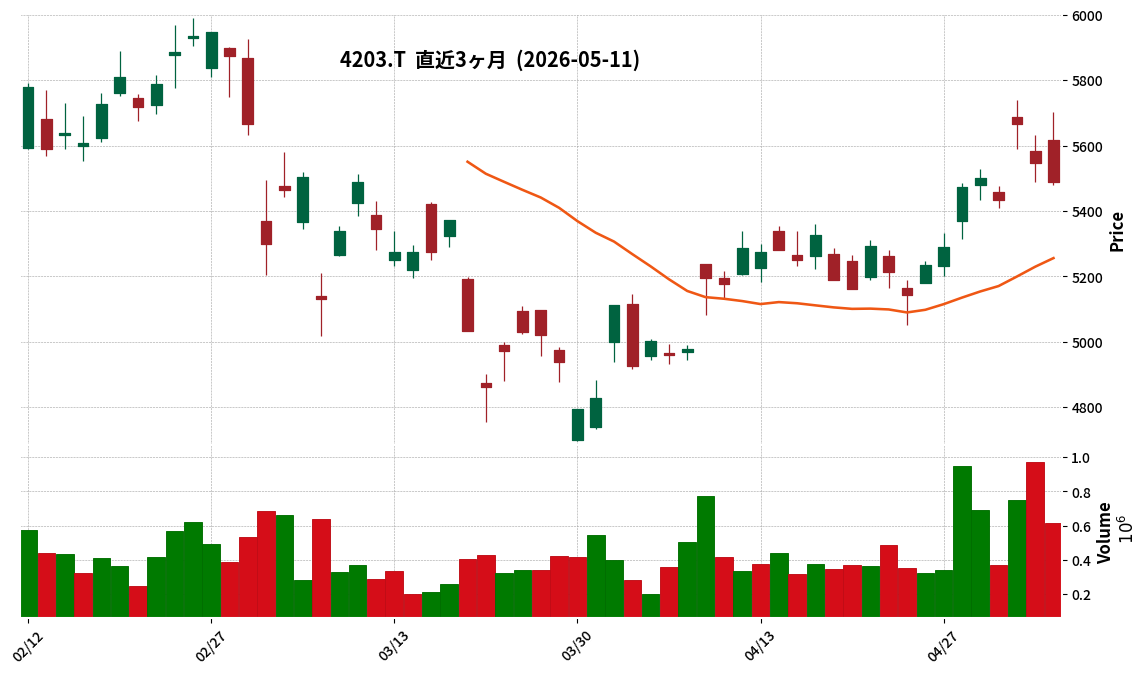
4203|住友ベーク
5489.0
▼ -1.03%
This article is an AI-generated summary and analysis of official IR disclosures.
📄 Announcement (AI-Reviewed)
- Sumitomo Bakelite Co., Ltd. announced its consolidated financial results (IFRS) for the fiscal year ended March 31, 2026, on May 11, 2026.
- For FY2026/3, consolidated revenue was ¥319,867 million (+5.0% year-on-year), business profit was ¥34,490 million (+11.8%), operating profit was ¥35,478 million (+43.1%), and profit attributable to owners of parent was ¥28,014 million (+45.3%).
- The annual dividend for FY2026/3 was ¥110.00 per share (¥50.00 interim, ¥60.00 year-end).
- The consolidated earnings forecast for FY2027/3 projects revenue of ¥337,000 million (+5.4% year-on-year), business profit of ¥38,000 million (+10.2%), operating profit of ¥37,500 million (+5.7%), and profit attributable to owners of parent of ¥28,500 million (+1.7%).
- The annual dividend forecast for FY2027/3 is ¥120.00 per share (¥60.00 interim, ¥60.00 year-end).
🤖 AI Perspective
The strong performance in FY2026/3, particularly the significant increases in profits, may be attributed to robust demand for semiconductor-related materials and successful efforts in shifting to high-value-added products and improving profit structures, as well as a rebound from impairment losses in the previous period. The positive outlook for FY2027/3, including projected increases in revenue, profits, and dividends, could indicate management’s confidence in continued favorable market conditions and strategic execution. These trends are worth monitoring for insights into the company’s sustained growth potential.
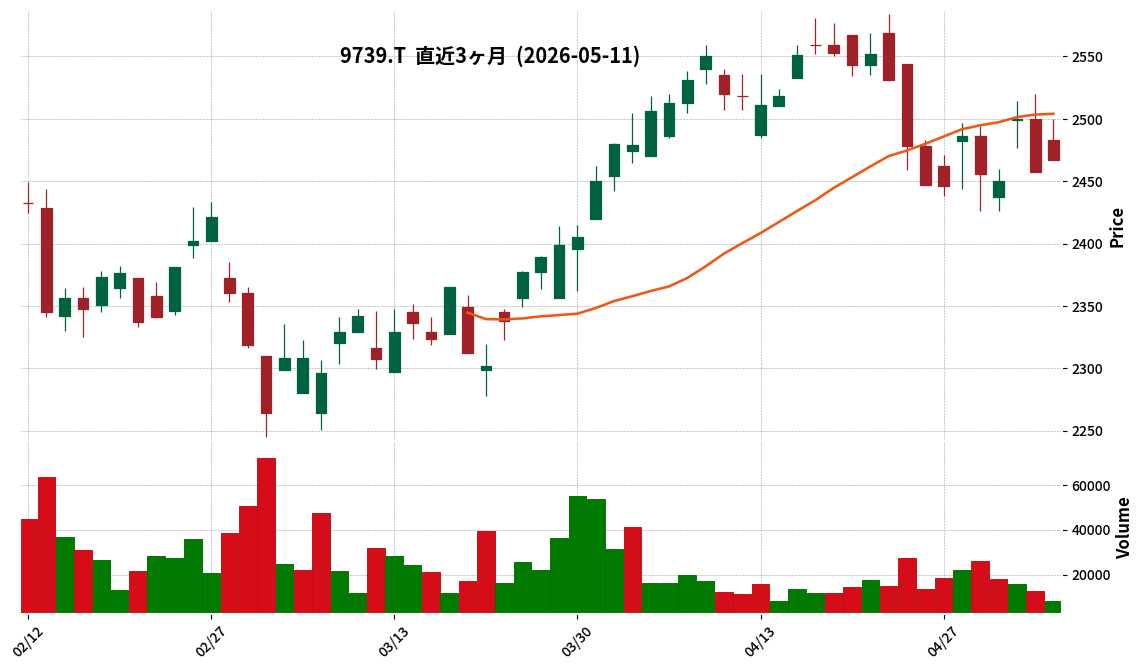
9739|NSW
2467.0
▲ +0.41%
This article is an AI-generated summary and analysis of official IR disclosures.
📄 Announcement (AI-Reviewed)
- NSW announced on May 11, 2026, that its Board of Directors resolved to increase the year-end dividend for the fiscal year ended March 31, 2026.
- The year-end dividend per share is set at JPY 85.00, which is an increase of JPY 40.00 from the previous forecast of JPY 45.00.
- This decision results in a total annual dividend of JPY 125.00 per share for the fiscal year ended March 31, 2026, including the JPY 40.00 interim dividend.
- The company cited its established business foundation, including consolidated net sales exceeding JPY 50 billion for three consecutive years in FY2026/3, as a primary reason for the dividend change.
- NSW stated its policy to clarify its commitment to shareholder returns by setting a dividend payout ratio of 50% as a near-term guideline.
🤖 AI Perspective
This dividend increase suggests that NSW is strengthening its commitment to shareholder returns, supported by a solid performance foundation. The establishment of a 50% dividend payout ratio as a guideline could offer investors clearer expectations regarding future capital distribution policies. This move, combined with the stated policy of continuous stable dividends, might be viewed as a positive indicator of the company’s financial health and shareholder-centric approach.
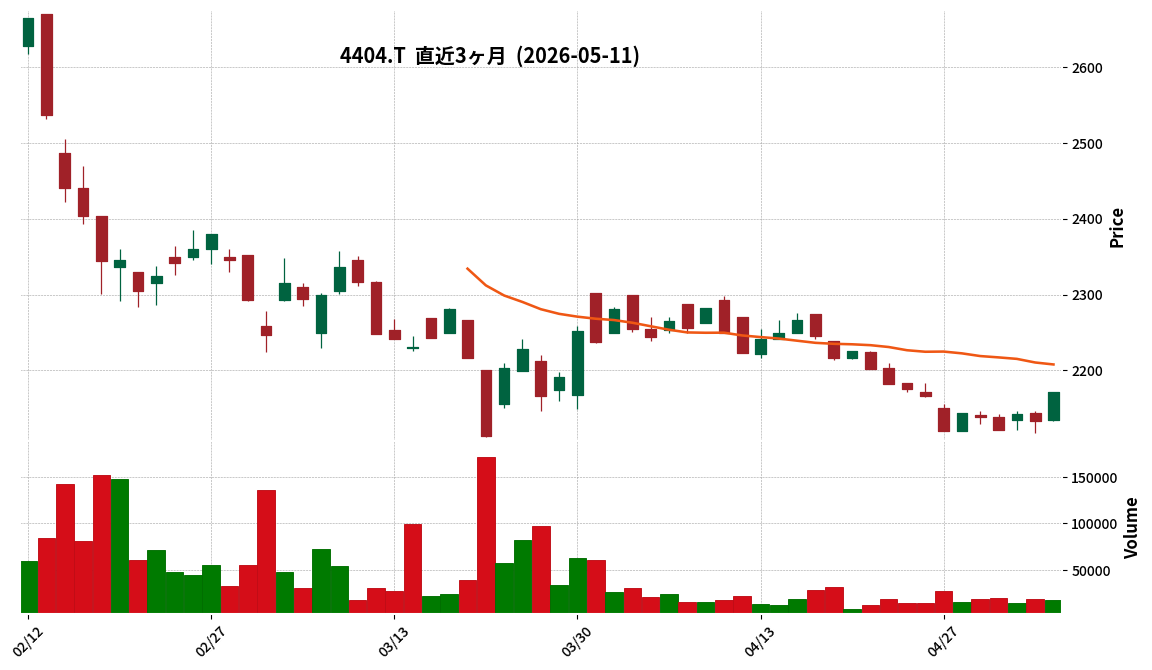
4404|ミヨシ油脂
2172.0
▲ +1.83%
This article is an AI-generated summary and analysis of official IR disclosures.
📄 Announcement (AI-Reviewed)
- For the first quarter of the fiscal year ending December 2026 (January 1, 2026 – March 31, 2026), consolidated net sales reached ¥15,154 million, marking a 5.9% increase compared to the prior-year period.
- Consolidated operating profit was ¥543 million (up 54.1% year-over-year), and consolidated ordinary profit was ¥481 million (up 89.3% year-over-year).
- Net income attributable to owners of parent soared by 145.0% year-over-year to ¥279 million.
- By segment, the Food Business reported sales of ¥10,589 million (up 5.0% year-over-year) and operating profit of ¥486 million (up 264.0% year-over-year).
- The Oil & Fat Chemicals Business segment recorded sales of ¥4,457 million (up 6.6% year-over-year), but its operating profit decreased by 73.9% to ¥36 million.
- The consolidated earnings forecast for the full fiscal year ending December 2026 remains unchanged from the announcement made on February 13, 2026.
🤖 AI Perspective
The company’s first-quarter consolidated results demonstrate significant growth across sales and all profit metrics, with net income attributable to owners of parent showing a substantial increase of 145.0% year-over-year.
The strong performance of the Food Business segment, which saw significant growth in both sales and operating profit, appears to be a primary driver for the overall positive results. Conversely, the Oil & Fat Chemicals Business experienced a notable decline in profit despite increased sales, suggesting varying performance dynamics between segments.
The decision to maintain the full-year earnings forecast might indicate that the company had already incorporated the robust Q1 performance into its initial projections or is adopting a cautious outlook for the remainder of the fiscal year.
Disclaimer: This article is for informational purposes only and does not constitute investment advice.
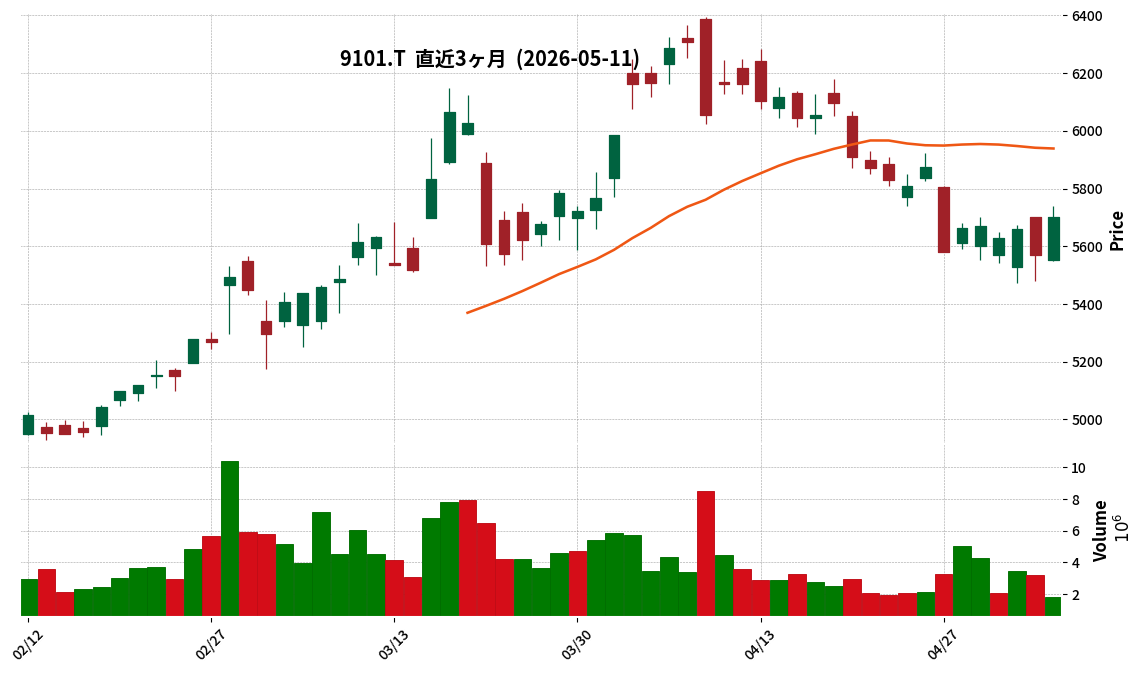
9101|郵船
5703.0
▲ +2.37%
This article is an AI-generated summary and analysis of official IR disclosures.
📄 Announcement (AI-Reviewed)
- Nippon Yusen Kabushiki Kaisha (NYK Line) announced its consolidated financial results for the fiscal year ended March 31, 2026 (April 1, 2025 – March 31, 2026).
- Consolidated operating results show net sales of ¥2,423,689 million (down 6.4% year-on-year), operating profit of ¥138,601 million (down 34.3% year-on-year), ordinary profit of ¥211,135 million (down 57.0% year-on-year), and profit attributable to owners of parent of ¥211,750 million (down 55.7% year-on-year).
- Basic earnings per share was ¥504.85.
- The annual dividend for the fiscal year ended March 31, 2026, was ¥230.00 per share (interim: ¥115.00, year-end: ¥115.00). The year-end dividend includes an ordinary dividend of ¥90.00 and a commemorative dividend of ¥25.00.
- For the fiscal year ending March 31, 2027 (April 1, 2026 – March 31, 2027), the company forecasts consolidated net sales of ¥2,605,000 million (up 7.5% year-on-year), operating profit of ¥145,000 million (up 4.6% year-on-year), ordinary profit of ¥185,000 million (down 12.4% year-on-year), and profit attributable to owners of parent of ¥195,000 million (down 7.9% year-on-year).
- The forecast for the annual dividend for the fiscal year ending March 31, 2027, is ¥200.00 per share (interim: ¥100.00, year-end: ¥100.00).
🤖 AI Perspective
The consolidated results for the fiscal year ended March 31, 2026, indicate a significant decline across all profit categories, with ordinary profit and profit attributable to owners of parent seeing reductions exceeding 50% from the previous fiscal year. This performance may be influenced by factors such as a substantial decrease in equity method investment income compared to the prior period. For the fiscal year ending March 31, 2027, while net sales and operating profit are projected to increase, ordinary profit and profit attributable to owners of parent are expected to continue their decline, suggesting that trends in equity method investment income will be a key area for monitoring.
2790|ナフコ
2192.0
▲ +0.87%
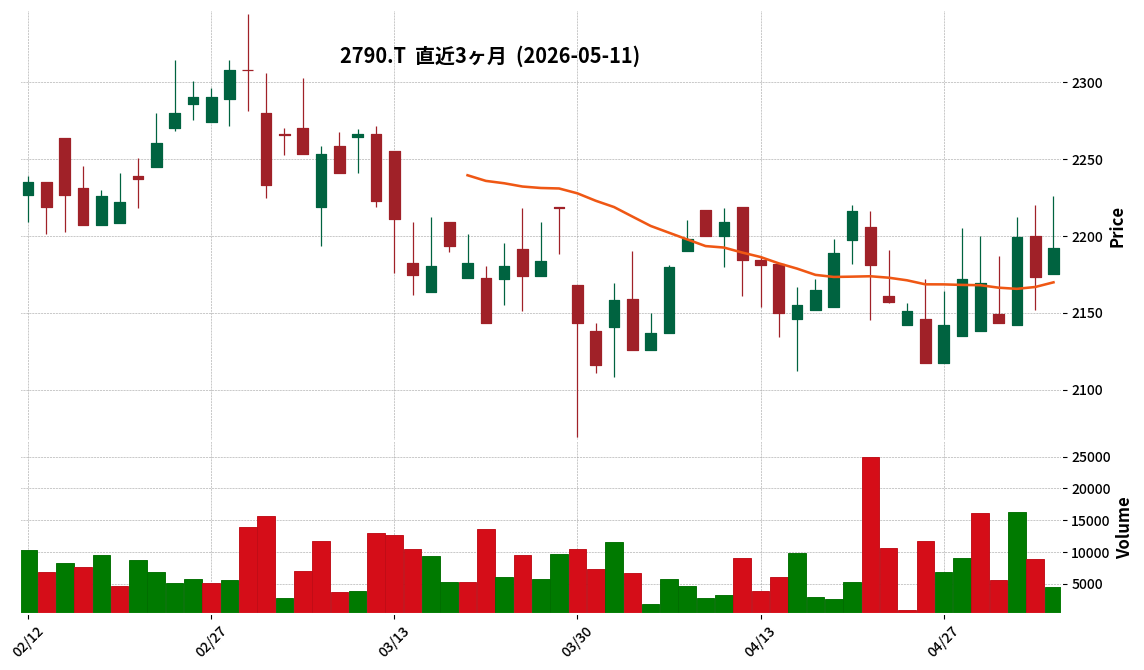
This article is an AI-generated summary and analysis of official IR disclosures.
📄 Announcement (AI-Reviewed)
- NAFCO Co.,Ltd. reported its FY2026/3 financial results (April 1, 2025 – March 31, 2026), with operating revenue of JPY 175,272 million (96.4% year-on-year). Operating profit increased to JPY 1,636 million (129.2% year-on-year), ordinary profit to JPY 1,488 million (111.9% year-on-year), and net profit to JPY 223 million (121.6% year-on-year).
- The increase in operating profit was primarily attributed to “cost review and suppression” and “review of sales promotion resulting in gross profit retention.”
- On the balance sheet, total assets stood at JPY 215,957 million and net assets at JPY 152,842 million. The equity ratio improved by 2.4 percentage points from the previous fiscal year-end, reaching 70.8%.
- In the cash flow statement, cash flow from operating activities turned positive at JPY 3,064 million, compared to a negative JPY 709 million in the previous fiscal year.
- The Private Brand (PB) ratio was 45.5% (down 0.1 percentage points from the previous period).
🤖 AI Perspective
- The significant profit increase despite a revenue decline may suggest the effectiveness of NAFCO’s strategies in cost management and profit margin optimization amid challenging market conditions.
- The improvement in the equity ratio and positive operating cash flow could indicate a strengthening of the company’s financial stability.
- Investors might monitor how the company sustains these efficiency gains while navigating external factors such as inflation and seasonal demand in the upcoming periods.
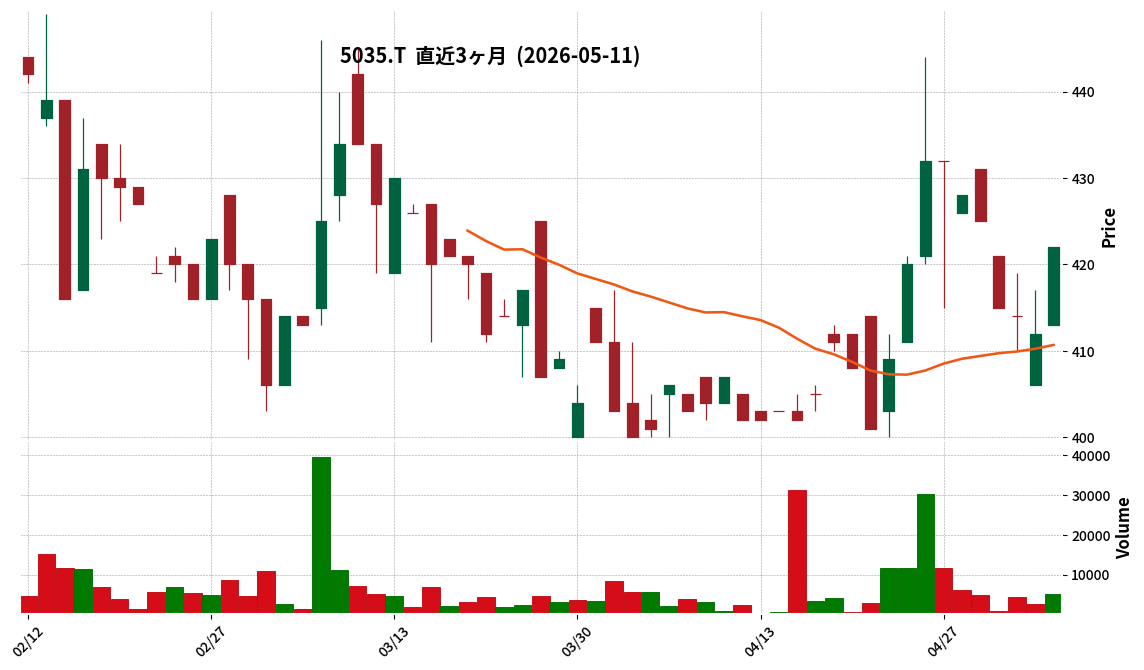
5035|G-HOUSEI
422.0
▲ +2.43%
📎 Source:G-HOUSEI Official IR →
This article is an AI-generated summary and analysis of official IR disclosures.
📄 Announcement (AI-Reviewed)
- For the first quarter of the fiscal year ending December 2026 (January 1 to March 31, 2026), consolidated net sales were ¥1,214 million, representing a 6.5% decrease year-over-year.
- Despite the decrease in sales, operating profit increased by 50.3% to ¥46 million, ordinary profit by 95.0% to ¥50 million, and net profit attributable to parent company shareholders surged by 151.4% to ¥36 million.
- The Domestic IT segment reported sales of ¥1,120,598 thousand (down 6.1% YoY) and operating profit of ¥76,350 thousand (up 184.4% YoY). The Overseas IT segment had sales of ¥94,106 thousand (down 11.0% YoY) and an operating loss of ¥36,238 thousand.
- During the quarter, the company reported initiating technology research with Juntendo University utilizing its generative low-code development platform “imprai” and commencing sales of the WMS solution “LOGIFLUX WMS.”
- The consolidated full-year earnings forecast for the fiscal year ending December 2026 remains unchanged, projecting net sales of ¥5,200 million (up 8.8% YoY), operating profit of ¥240 million (up 556.6% YoY), and net profit attributable to parent company shareholders of ¥170 million.
🤖 AI Perspective
- Although sales decreased year-over-year, the significant increase in profit figures suggests improved gross profit margins and reduced selling, general, and administrative expenses.
- The improved profitability of the Domestic IT segment appears to have contributed to the overall results, while the Overseas IT segment continues to record losses, which may warrant further monitoring of the company’s business portfolio strategy.
- The company is advancing business investments aimed at medium-to-long-term growth, including AI-driven technology research in the medical field and the deployment of new WMS solutions.
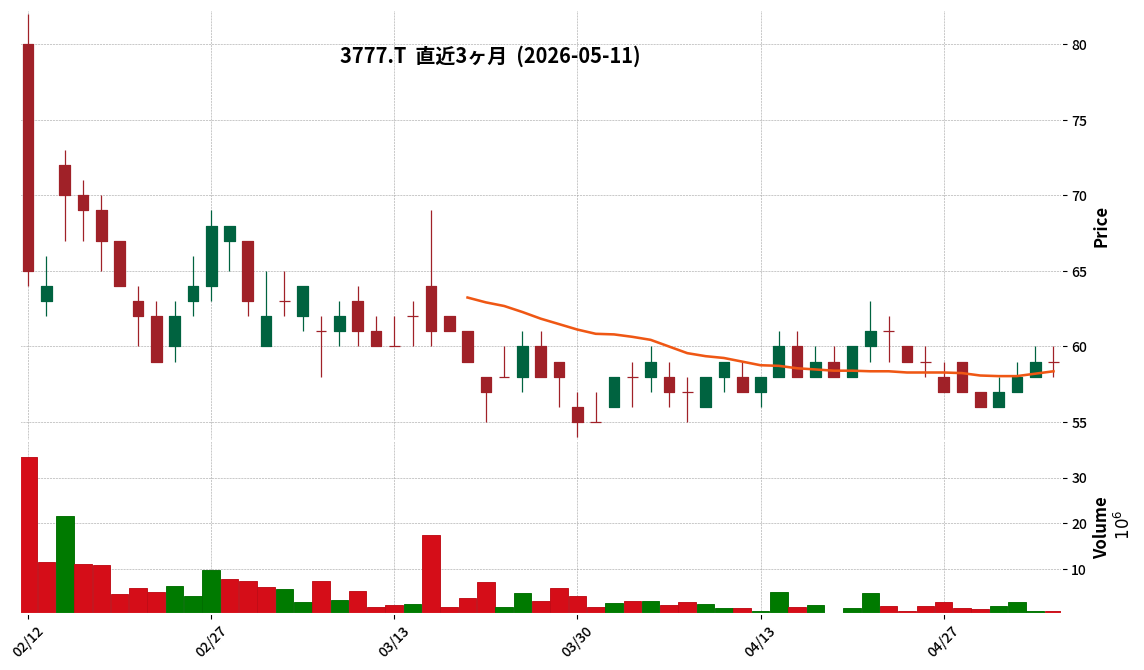
3777|G-環境フレンドリー
59.0
▲ +0.00%
📎 Source:G-環境フレンドリー Official IR →
This article is an AI-generated summary and analysis of official IR disclosures.
📄 Announcement (AI-Reviewed)
- G-Kankyo Friendly Holdings Co., Ltd. resolved on May 11, 2026, for its consolidated subsidiary, EF Investment, to acquire shares of three special purpose companies (EFI Solar 1 Co., Ltd., EFI Solar 2 Co., Ltd., and EFI Solar 3 Co., Ltd.) in South Korea, making them consolidated subsidiaries.
- This acquisition is the first project under the strategic business alliance memorandum with Econetwork Co., Ltd., previously disclosed on March 17, 2026.
- It represents EF Investment’s first direct investment in the South Korean solar power business and is positioned as the initial step in its strategy to expand into the Asian market.
- The three acquired SPCs will operate solar power plants with a total planned capacity of approximately 2.6MW, located in Wonju City, Gangwon Province, and Chungju City, Chungcheongbuk Province, South Korea.
- These power plants are currently in the pre-construction phase, with completion scheduled for July 2026. The total acquisition cost for the shares is 201,000,000 KRW.
🤖 AI Perspective
This development marks G-Kankyo Friendly Group’s concrete entry into the South Korean renewable energy market. The strategy of leveraging EF Investment’s expertise cultivated in Japan for the development and operation of solar power plants in South Korea may suggest potential synergies for future business expansion. Positioning this as the first step in its Asian market expansion strategy indicates that the company’s future international business growth could be worth monitoring.
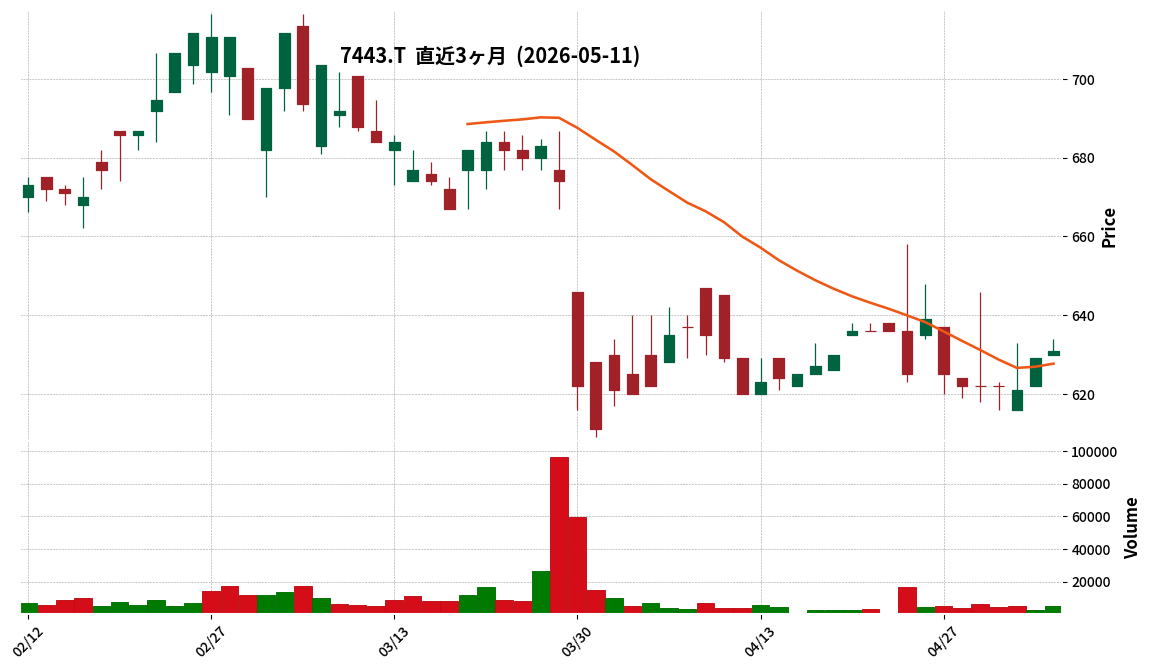
7443|横浜魚類
631.0
▲ +0.32%
This article is an AI-generated summary and analysis of official IR disclosures.
📄 Announcement (AI-Reviewed)
- Yokohama Gyorui Co., Ltd. (Code: 7443) announced its non-consolidated financial results for the fiscal year ended March 31, 2026 (April 1, 2025 – March 31, 2026).
- For the period, net sales increased by 3.8% year-on-year to ¥20,978 million, operating income surged by 34.7% to ¥211 million, ordinary income rose by 30.2% to ¥236 million, and net income increased by 2.5% to ¥185 million.
- Earnings per share (EPS) for the period was ¥29.67, and net assets per share was ¥430.63.
- The year-end dividend for FY2026 was raised to ¥8.00 from ¥6.00 in the previous fiscal year, resulting in a total annual dividend of ¥8.00 (total dividend payment of ¥50 million).
- For the fiscal year ending March 31, 2027, the company forecasts net sales of ¥21,200 million (up 1.1% year-on-year), but expects a decline in profits with operating income at ¥180 million (down 14.9%), ordinary income at ¥200 million (down 15.6%), and net income at ¥150 million (down 19.2%).
🤖 AI Perspective
Yokohama Gyorui demonstrated strong performance in FY2026 with increases across all key profit metrics, notably a 34.7% surge in operating income, potentially supported by reduced bad debt write-off expenses. However, the company’s forecast for FY2027 projects a decline in operating and net income despite a modest increase in sales, which may suggest that rising costs could impact future profitability. The increase in the annual dividend could be interpreted as a positive signal regarding the company’s commitment to shareholder returns.
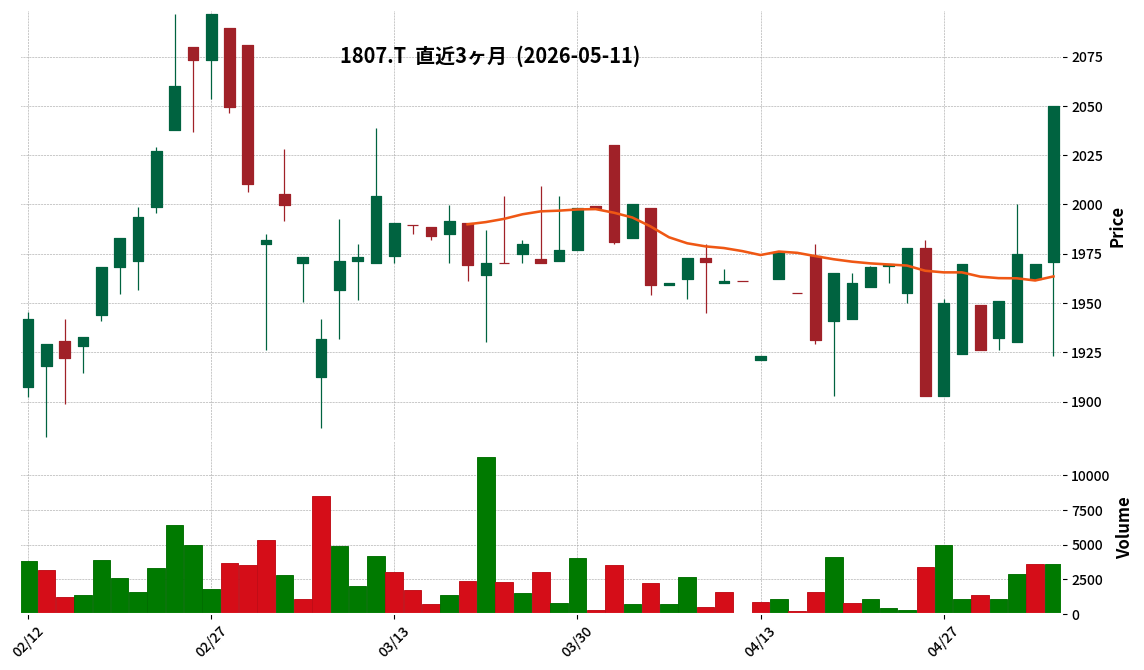
1807|佐藤渡辺
2050.0
▲ +4.06%
This article is an AI-generated summary and analysis of official IR disclosures.
📄 Announcement (AI-Reviewed)
- Sato Watana Co., Ltd. reported consolidated financial results for the fiscal year ended March 2026, with net sales of ¥33,704 million (down 16.6% year-on-year), operating profit of ¥1,070 million (down 9.1%), ordinary profit of ¥1,369 million (up 3.1%), and profit attributable to owners of parent of ¥883 million (down 0.9%).
- The decline in net sales for the current fiscal year was primarily due to a 120-day business suspension order from the Kanto Regional Development Bureau of the Ministry of Land, Infrastructure, Transport and Tourism (effective from April 9 to August 6, 2025), which impacted order intake and sales in the construction division.
- Regarding the financial position, total assets at the end of March 2026 were ¥32,672 million, and net assets were ¥22,920 million, with the equity ratio improving to 69.8% from 60.2% at the end of the previous fiscal year.
- Cash flow from operating activities significantly improved to ¥5,095 million (compared to △¥3,964 million in the previous year), with cash and cash equivalents at the end of the period totaling ¥6,394 million.
- The consolidated earnings forecast for the fiscal year ending March 2027 projects net sales of ¥38,000 million (up 12.7% year-on-year), operating profit of ¥1,100 million (up 2.8%), ordinary profit of ¥1,300 million (down 5.1%), and profit attributable to owners of parent of ¥900 million (up 1.9%). An annual dividend of ¥80.00 per share is also forecast.
🤖 AI Perspective
In FY2026, while net sales significantly decreased year-on-year due to the business suspension, it is notable that ordinary profit saw a slight increase, and the decline in net profit was limited compared to the sales decrease. The substantial improvement in operating cash flow and the higher equity ratio suggest a potential strengthening of the company’s financial foundation. The FY2027 forecast, projecting increases in both sales and profit, indicates an anticipated recovery in business activities, possibly reflecting a rebound from the previous period’s challenges.
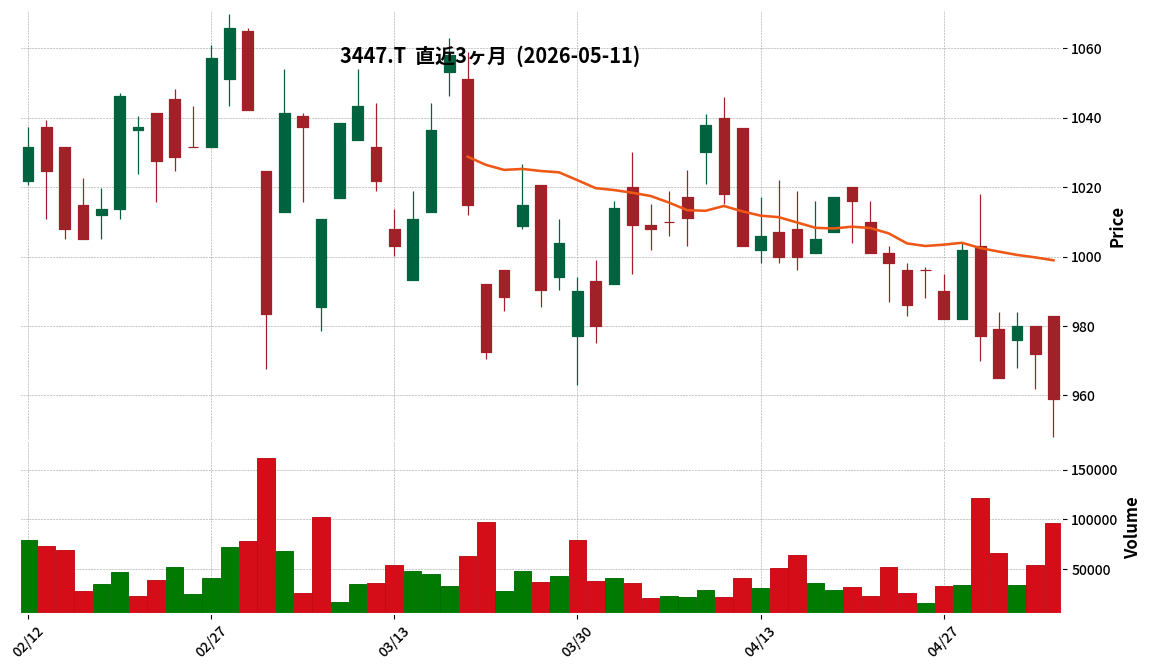
3447|信和
959.0
▼ -1.34%
This article is an AI-generated summary and analysis of official IR disclosures.
📄 Announcement (AI-Reviewed)
- Shinwa reported consolidated revenue of ¥20,138 million (+15.1% YoY), operating profit of ¥2,488 million (+53.4% YoY), and profit attributable to owners of parent of ¥1,718 million (+76.2% YoY) for the fiscal year ended March 31, 2026.
- Both revenue and all stages of profit reached record highs since listing.
- The annual dividend for FY2026/3 was ¥34.00 (year-end dividend of ¥18.00), an increase of ¥2.00 from the previous fiscal year’s ¥32.00.
- For FY2027/3, Shinwa forecasts consolidated revenue of ¥22,000 million (+9.2% YoY) but anticipates profit attributable to owners of parent to be ¥1,600 million (-6.9% YoY).
- During the current consolidated fiscal year, Kaizu Construction Co., Ltd. was newly added to the scope of consolidation.
🤖 AI Perspective
The achievement of record-high revenue and profits, along with an increased annual dividend for the fiscal year ended March 2026, could be viewed favorably by investors. However, the forecast for a decrease in profit attributable to owners of parent for the fiscal year ending March 2027 may raise questions regarding future profitability and business strategies. The addition of a new consolidated subsidiary suggests business expansion, and its integration effects on future performance will be worth monitoring.
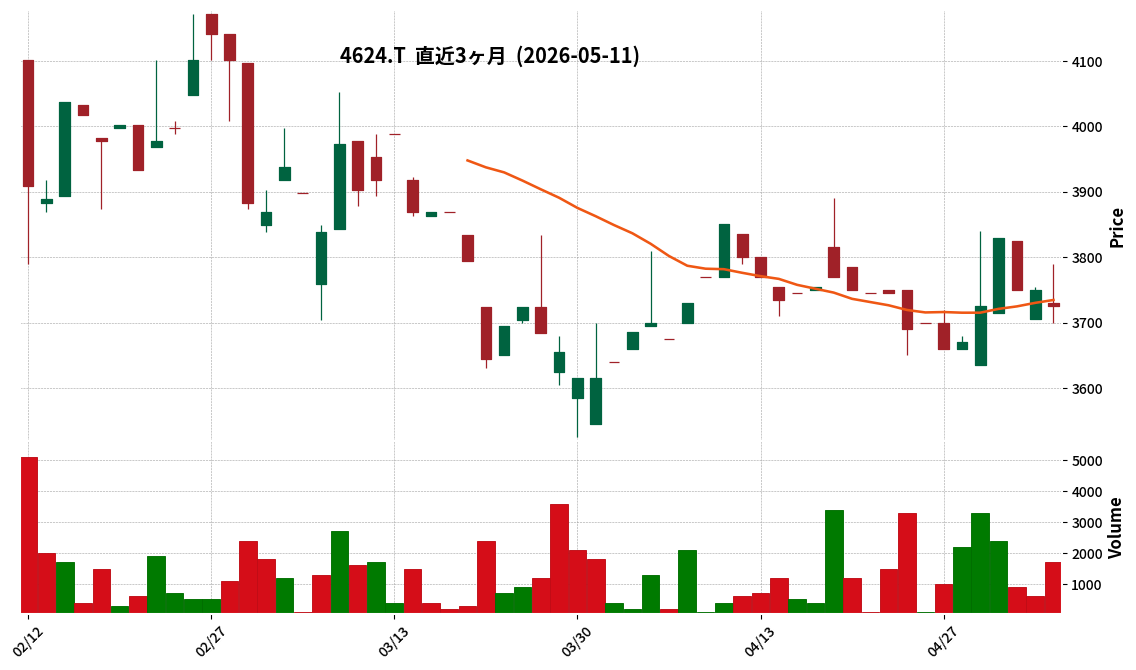
4624|イサム塗料
3725.0
▼ -0.67%
This article is an AI-generated summary and analysis of official IR disclosures.
📄 Announcement (AI-Reviewed)
- For the fiscal year ended March 31, 2026, consolidated net sales were ¥8,403 million, an increase of 3.0% year-on-year.
- Consolidated operating profit increased by 45.9% to ¥915 million, ordinary profit by 40.5% to ¥1,077 million, and profit attributable to owners of parent by 37.6% to ¥755 million.
- Diluted earnings per share for the period was ¥396.34, up from ¥288.00 in the previous fiscal year.
- The consolidated equity ratio remained high at 82.5%.
- The annual dividend for the fiscal year ended March 31, 2026, was ¥50.00 (interim ¥25.00, year-end ¥25.00), maintaining the same level as the previous year.
- The consolidated earnings forecast for the fiscal year ending March 31, 2027, has been announced as undecided due to the difficulty in making a reasonable estimate amid the impact of the Middle East situation.
🤖 AI Perspective
The FY2026 results show a notable increase in sales, driven by price revisions and speculative demand for certain products, leading to significant growth across all profit metrics compared to the previous year. The company also maintains a strong financial position, as indicated by a high consolidated equity ratio of 82.5%. However, the decision to leave the FY2027 earnings forecast undecided, citing the Middle East situation, suggests potential uncertainties regarding future business conditions that warrant monitoring.
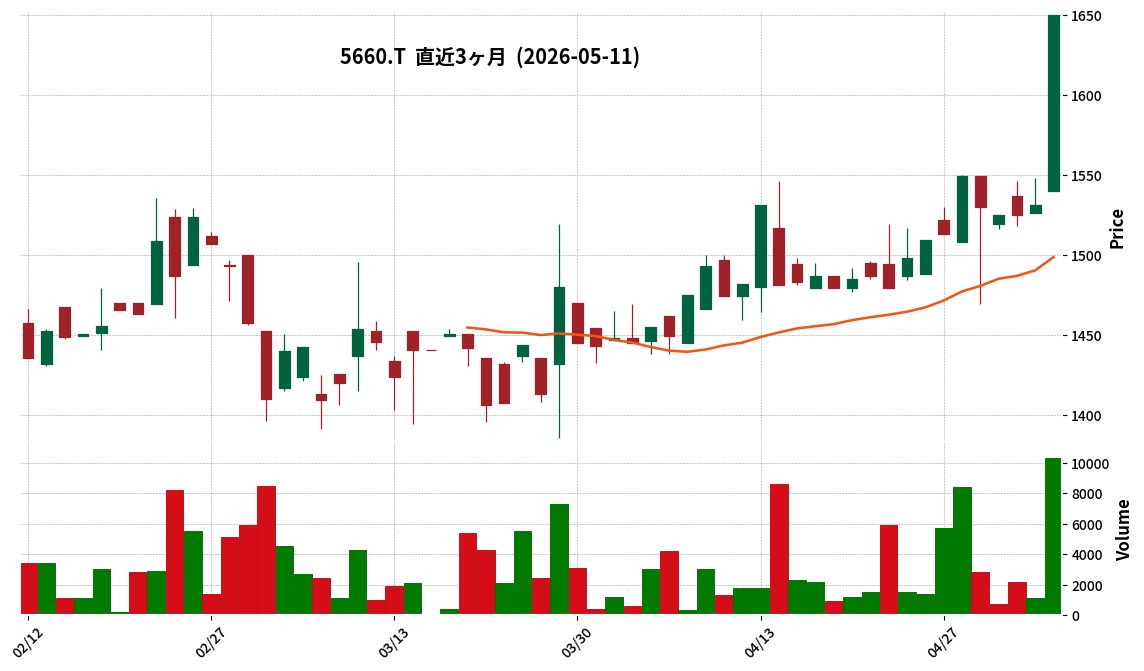
5660|神鋼鋼線
1650.0
▲ +7.77%
This article is an AI-generated summary and analysis of official IR disclosures.
📄 Announcement (AI-Reviewed)
- Shinko Wire Co., Ltd. reported consolidated results for the fiscal year ended March 31, 2026, with net sales of ¥33,074 million (down 3.6% year-on-year), operating profit of ¥653 million (down 44.0% year-on-year), and ordinary profit of ¥660 million (down 46.6% year-on-year).
- Profit attributable to owners of parent increased by 8.3% year-on-year to ¥1,120 million, primarily due to special gains from the sale of policy-held shares and insurance proceeds related to hailstorm damage at a rope manufacturing plant.
- The annual dividend for the fiscal year ended March 31, 2026, was ¥65.00 per share (interim ¥25.00, year-end ¥40.00), representing an increase of ¥5.00 from the previous year’s ¥60.00.
- Consolidated earnings forecasts and dividend forecasts for the fiscal year ending March 31, 2027, have been withheld due to the planned delisting on August 28, 2026, following a share exchange with Kobe Steel, Ltd.
- In terms of consolidated financial position, total assets stood at ¥44,582 million, net assets at ¥25,386 million, and the equity ratio improved to 56.9% from 54.5% at the end of the previous fiscal year.
🤖 AI Perspective
The reported decrease in net sales, operating, and ordinary profits, offset by an increase in net profit attributable to owners of parent due to special gains, highlights a mixed financial performance for the period. The decision to withhold forecasts for the next fiscal year and dividends, stemming from the impending delisting due to a share exchange with Kobe Steel, suggests a significant transition period for the company. Investors may consider monitoring the implications of this corporate restructuring.
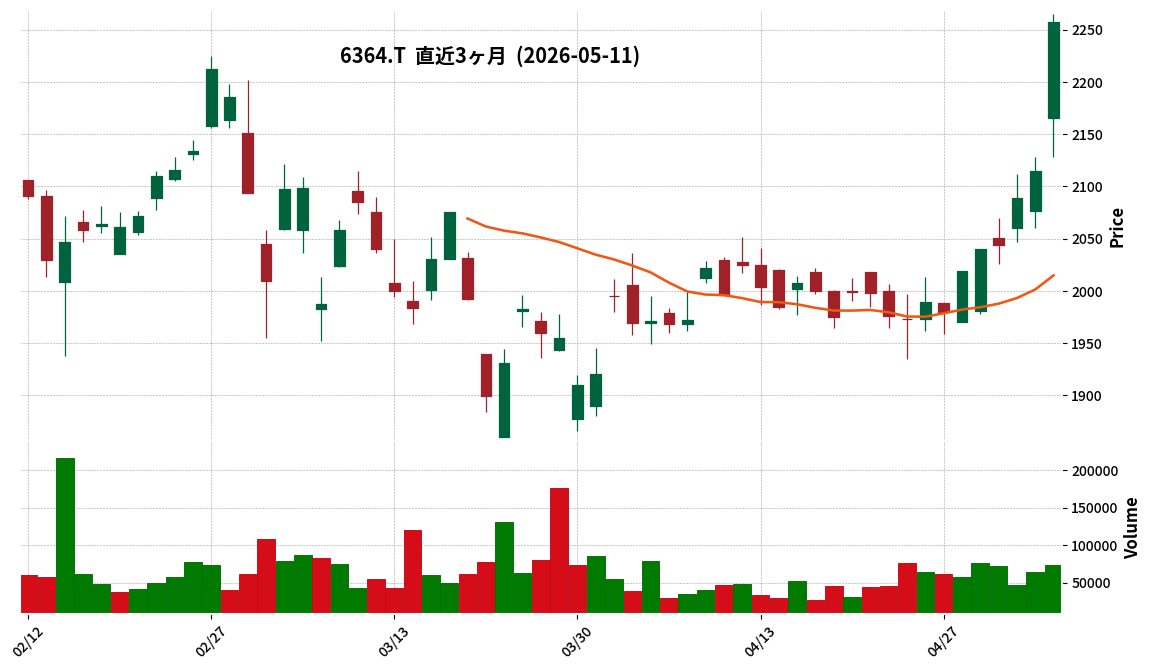
6364|AIRMAN
2257.0
▲ +6.71%
This article is an AI-generated summary and analysis of official IR disclosures.
📄 Announcement (AI-Reviewed)
- AIRMAN Co., Ltd. reported consolidated results for the fiscal year ended March 31, 2026, with net sales of ¥55,604 million (up 2.3% year-on-year), operating profit of ¥7,184 million (up 11.2%), ordinary profit of ¥8,014 million (up 17.4%), and profit attributable to owners of parent of ¥5,596 million (up 17.4%).
- The annual dividend for the fiscal year ended March 31, 2026, was ¥72.00, including a year-end dividend of ¥52.00, an increase from ¥57.00 in the previous fiscal year.
- For the fiscal year ending March 31, 2027, the company forecasts consolidated net sales of ¥58,500 million (up 5.2% year-on-year), but expects operating profit of ¥5,630 million (down 21.6%), ordinary profit of ¥5,760 million (down 28.1%), and profit attributable to owners of parent of ¥3,960 million (down 29.2%).
- The annual dividend forecast for the fiscal year ending March 31, 2027, is ¥72.00 (including a year-end dividend of ¥52.00), which is the same amount as the previous fiscal year.
- The consolidated equity ratio as of March 31, 2026, stood at 68.5%.
🤖 AI Perspective
While AIRMAN achieved increased revenue and profit in the fiscal year ended March 2026 and raised its annual dividend, the company’s forecast for the fiscal year ending March 2027 projects a decrease in profit, which may draw investor attention. The shift to negative operating cash flow in the current period could also be a factor to consider when evaluating future financial health. The robust equity ratio suggests a stable financial foundation.
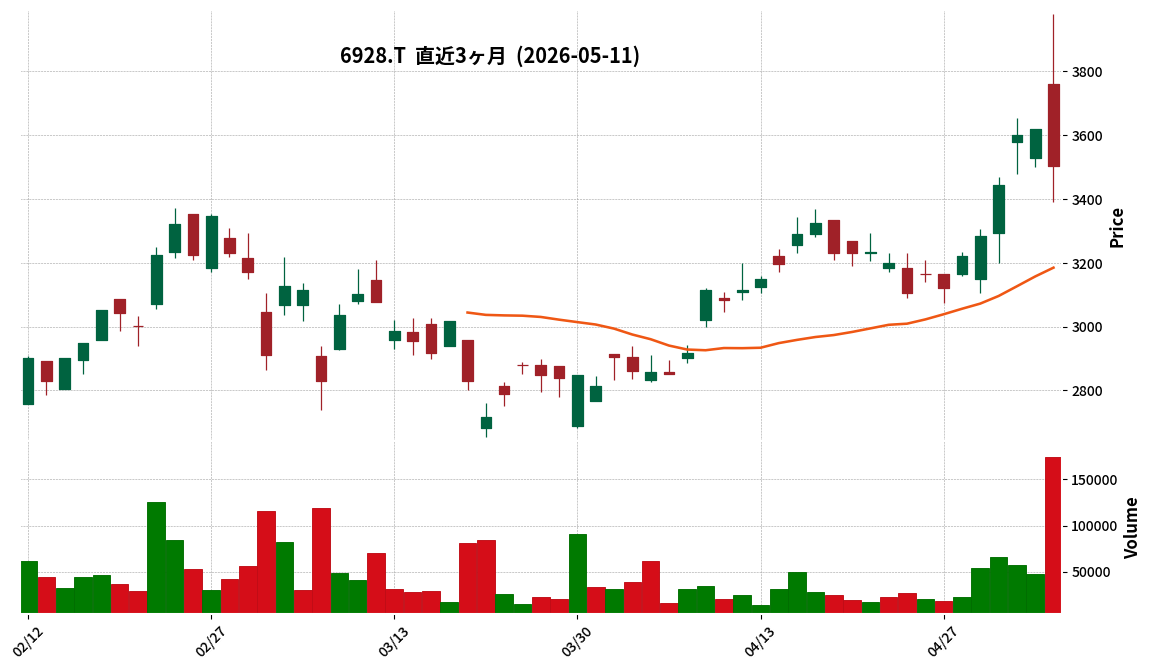
6928|エノモト
3505.0
▼ -3.18%
This article is an AI-generated summary and analysis of official IR disclosures.
📄 Announcement (AI-Reviewed)
- Enomoto Co., Ltd. reported consolidated results for the fiscal year ended March 31, 2026, with net sales of ¥30,415 million (up 13.2% year-on-year), operating profit of ¥1,650 million (up 166.8% year-on-year), ordinary profit of ¥1,766 million (up 164.0% year-on-year), and net profit attributable to owners of parent of ¥1,231 million (up 174.9% year-on-year).
- Diluted earnings per share (EPS) for the period were ¥191.21, compared to ¥68.51 in the previous fiscal year.
- The annual dividend for the fiscal year ended March 31, 2026, was ¥75.00 per share (interim ¥35.00, year-end ¥40.00), an increase from ¥71.00 in the prior fiscal year.
- For the fiscal year ending March 31, 2027, the company forecasts consolidated net sales of ¥32,000 million (up 5.2% year-on-year), operating profit of ¥2,000 million (up 21.2% year-on-year), and net profit attributable to owners of parent of ¥1,400 million (up 13.7% year-on-year).
- The forecast for the annual dividend for the fiscal year ending March 31, 2027, is ¥77.00 per share (interim ¥37.00, year-end ¥40.00).
🤖 AI Perspective
The significant year-on-year increases in revenue and all profit metrics for FY2026, particularly the over 160% growth in operating, ordinary, and net profits, suggest a strong turnaround in business performance. This strong performance may be attributed to strategic initiatives such as the expansion of LED lead frame production and the pursuit of high-value micro-connector components, as outlined in the company’s overview. Furthermore, the positive outlook for FY2027, including projected growth in revenue, profits, and an increased dividend, could indicate management’s confidence in sustained future performance.
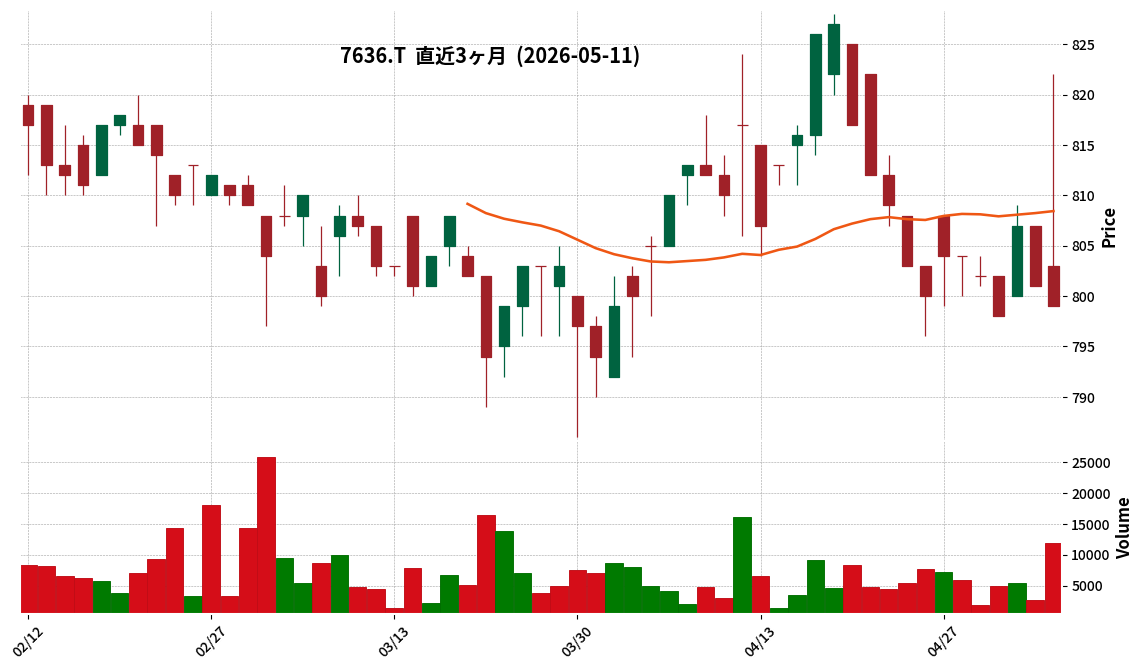
7636|ハンズマン
799.0
▼ -0.25%
This article is an AI-generated summary and analysis of official IR disclosures.
📄 Announcement (AI-Reviewed)
- Handsman Co., Ltd. announced its financial results for the third quarter of the fiscal year ending June 2026 (July 1, 2025, to March 31, 2026).
- During this period, net sales were 25,516 million yen (down 0.0% year-on-year), while operating profit was 727 million yen (down 10.2% year-on-year), ordinary profit was 943 million yen (down 4.8% year-on-year), and net income attributable to owners of the parent was 637 million yen (down 4.6% year-on-year).
- The gross profit margin decreased by 0.5 percentage points year-on-year to 31.1%, with the company stating that rising purchase prices due to higher raw material costs and yen depreciation were key factors.
- Total store customer traffic was reported as 100.2% of the prior year, and the average customer spend was 99.8% of the prior year.
- The full-year forecast for the fiscal year ending June 2026 remains unchanged from the most recently announced figures, projecting net sales of 35,050 million yen, operating profit of 1,080 million yen, ordinary profit of 1,350 million yen, and net income of 910 million yen.
🤖 AI Perspective
Handsman’s Q3 results indicate largely flat sales year-on-year, but a decline in profits, primarily attributed to a lower gross profit margin influenced by rising raw material costs and yen depreciation. Efforts to manage selling, general, and administrative expenses, which saw a decrease, may have partially offset these pressures. Investors might observe how the company continues to address cost challenges and adapt its product mix, given the contrasting performance among its DIY, household, and car/leisure product categories.
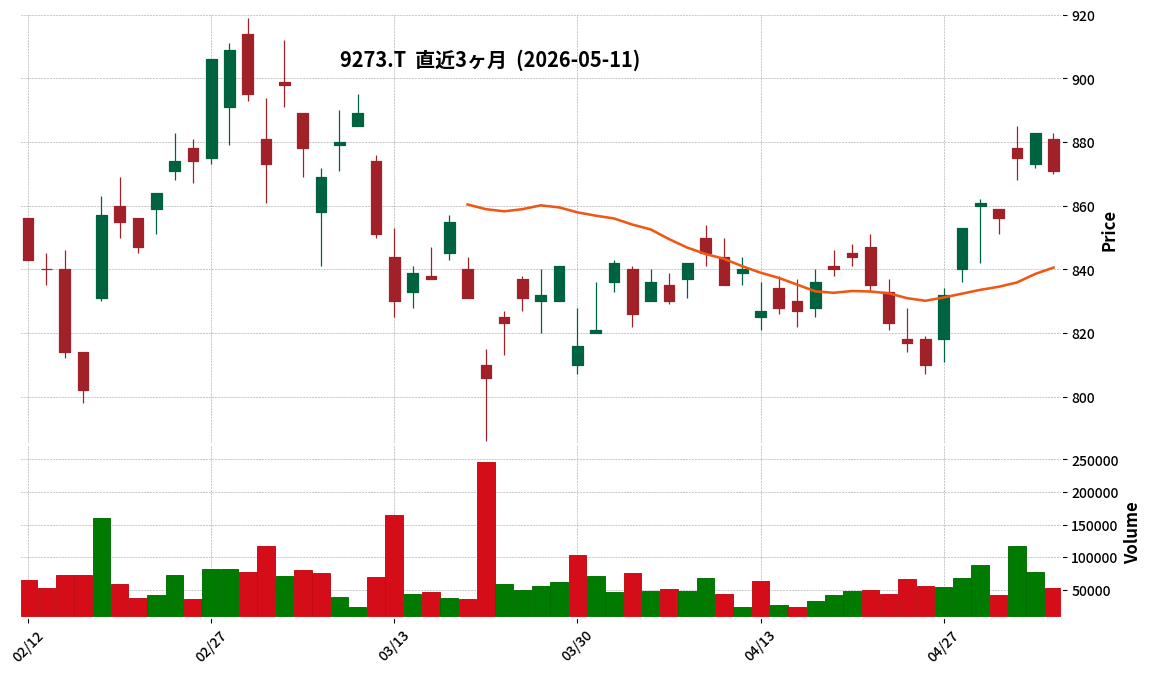
9273|コーア商事HD
871.0
▼ -1.36%
📎 Source:コーア商事HD Official IR →
This article is an AI-generated summary and analysis of official IR disclosures.
📄 Announcement (AI-Reviewed)
- For the third quarter of the fiscal year ending June 2026 (July 1, 2025 – March 31, 2026), consolidated net sales reached JPY 18,334 million (up 4.0% year-on-year), operating income was JPY 4,580 million (up 4.5%), ordinary income was JPY 4,551 million (up 3.0%), and net income attributable to owners of the parent was JPY 3,052 million (up 3.1%).
- Diluted earnings per share for the quarter were JPY 72.47.
- The consolidated financial position showed total assets of JPY 38,039 million, net assets of JPY 30,494 million, and an equity ratio of 80.2%.
- The forecast for the annual dividend for the fiscal year ending June 2026 remains JPY 18.00 per share (JPY 18.00 at year-end), with no revisions from the latest forecast.
- The consolidated full-year earnings forecast for the fiscal year ending June 2026 includes net sales of JPY 25,700 million (up 10.4% year-on-year) and net income attributable to owners of the parent of JPY 3,640 million (up 0.1%), with no revisions from the latest forecast.
🤖 AI Perspective
KOA Shoji HD demonstrated a steady performance, achieving increased revenue and profit for the cumulative third quarter. This growth appears to be supported by robust sales in its raw material sales business, particularly for “allergy medications” and “central nervous system medications.” The high equity ratio could indicate the company’s strong financial stability, which may be a key point for investors to monitor.
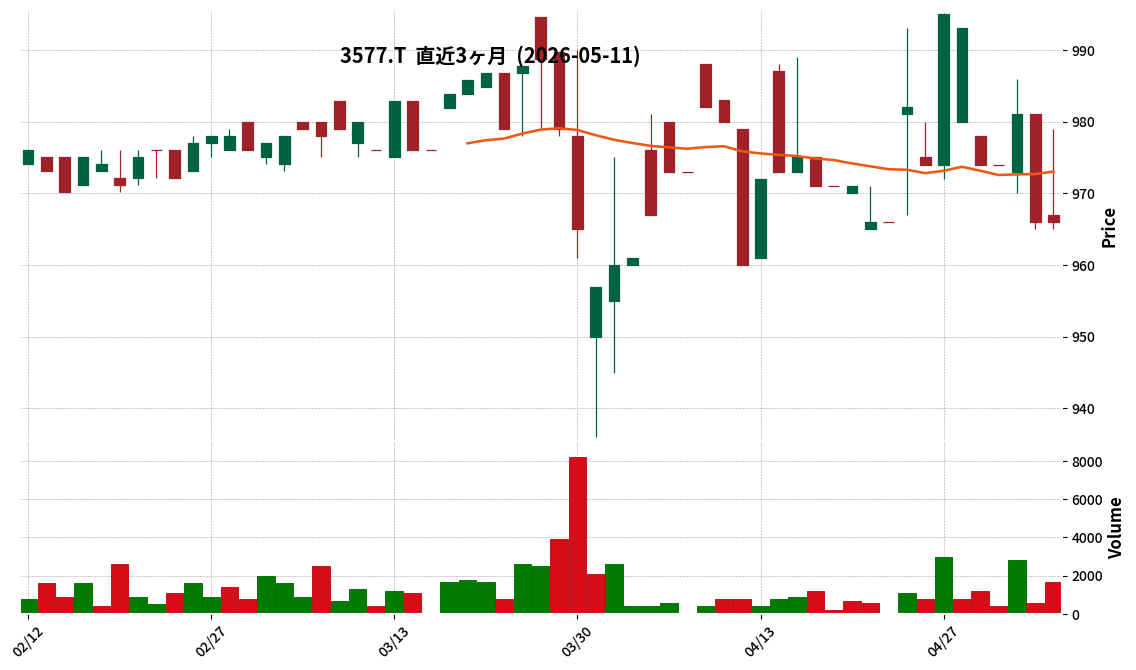
3577|東海染工
966.0
▲ +0.00%
This article is an AI-generated summary and analysis of official IR disclosures.
📄 Announcement (AI-Reviewed)
- Tokai Senko Co., Ltd. has released its consolidated financial results for the fiscal year ending March 2026.
🤖 AI Perspective
This announcement is expected to disclose key financial figures reflecting the company’s profitability and financial health. Investors will likely analyze metrics such as net sales, various levels of profit, dividend forecasts, and future outlook to assess the company’s operational strength and growth prospects.
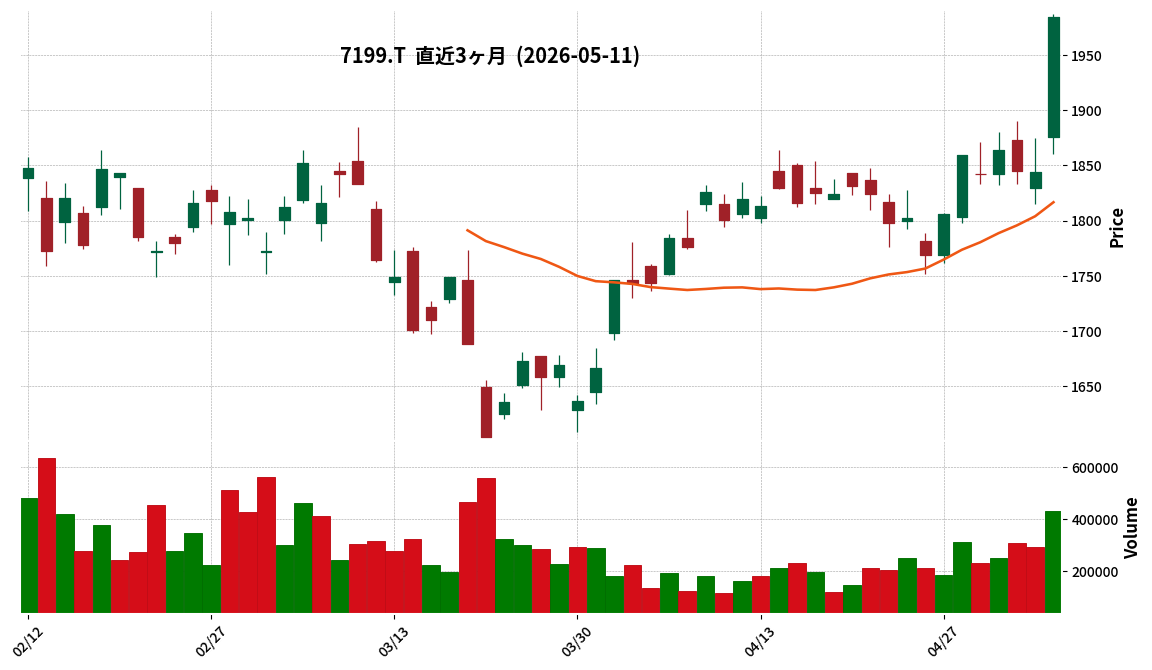
7199|プレミアグループ
1984.0
▲ +7.59%
📎 Source:プレミアグループ Official IR →
This article is an AI-generated summary and analysis of official IR disclosures.
📄 Announcement (AI-Reviewed)
- Premier Group’s consolidated operating revenue for the fiscal year ended March 31, 2026, increased by 21.0% year-on-year to ¥44,042 million.
- Profit attributable to owners of the parent grew by 30.5% year-on-year, reaching ¥6,069 million.
- Basic earnings per share stood at ¥157.22.
- The annual dividend per share was set at ¥54.00, an increase from ¥40.00 in the previous fiscal year.
- For the fiscal year ending March 31, 2027, the company forecasts consolidated operating revenue of ¥51,000 million (up 15.8% year-on-year) and profit attributable to owners of the parent of ¥6,900 million (up 13.7% year-on-year).
🤖 AI Perspective
The strong performance in the current fiscal year appears to be supported by increased transaction volumes in the finance business and growth in high-profit products within the warranty business. The positive outlook for the next fiscal year, projecting continued revenue and profit growth, could indicate ongoing expansion of the business foundation and improvements in the revenue structure. Investors may wish to monitor how the company’s future business strategies and evolving market conditions impact its financial results.
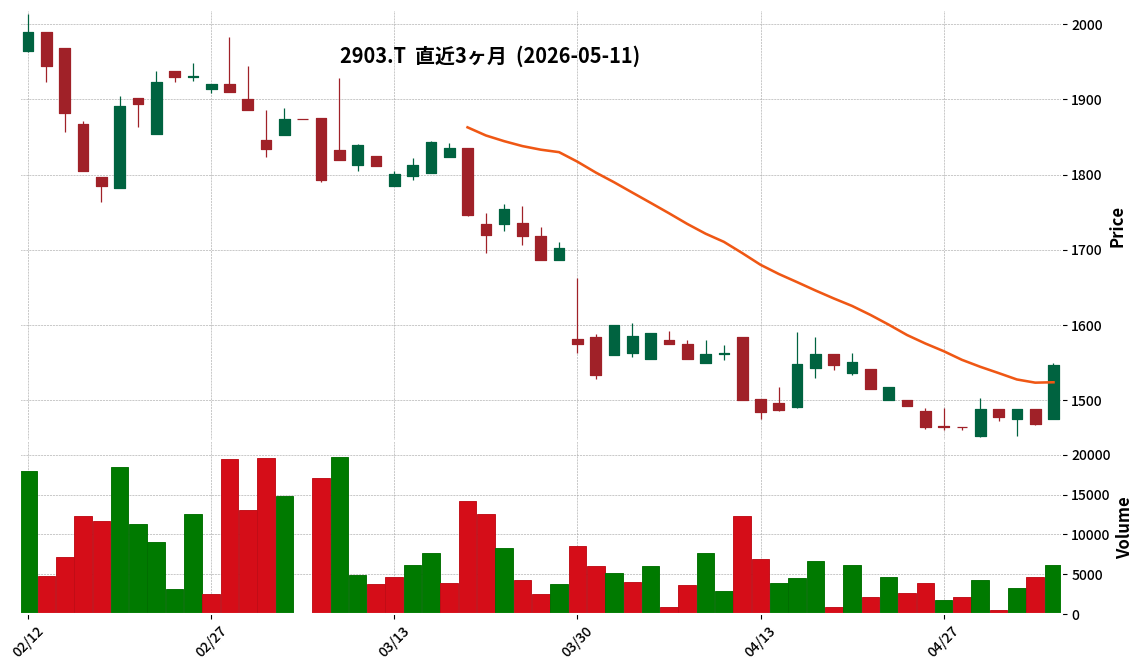
2903|シノブフーズ
1547.0
▲ +5.31%
This article is an AI-generated summary and analysis of official IR disclosures.
📄 Announcement (AI-Reviewed)
- Shinobu Foods reported consolidated net sales of ¥61,974 million for the fiscal year ended March 31, 2026, marking a 7.5% increase year-on-year.
- Net income attributable to owners of parent significantly rose by 70.4% year-on-year, reaching ¥1,698 million.
- The annual dividend for FY2026 was increased to ¥32.00 per share, up from ¥27.00 in the previous fiscal year.
- For FY2027, the company forecasts consolidated net sales of ¥63,800 million (+2.9% YoY) and net income attributable to owners of parent of ¥1,700 million (+0.1% YoY).
- The equity ratio improved to 52.9% at the end of FY2026, compared to 50.5% at the end of FY2025.
🤖 AI Perspective
Shinobu Foods’ significant 70.4% increase in net income attributable to owners of parent for FY2026, alongside a 7.5% rise in net sales, suggests robust operational performance. The increase in annual dividend and the projected stable growth for FY2027 could indicate a positive outlook for shareholder returns and business stability. The improvement in the equity ratio to 52.9% may also reflect a strengthened financial position.
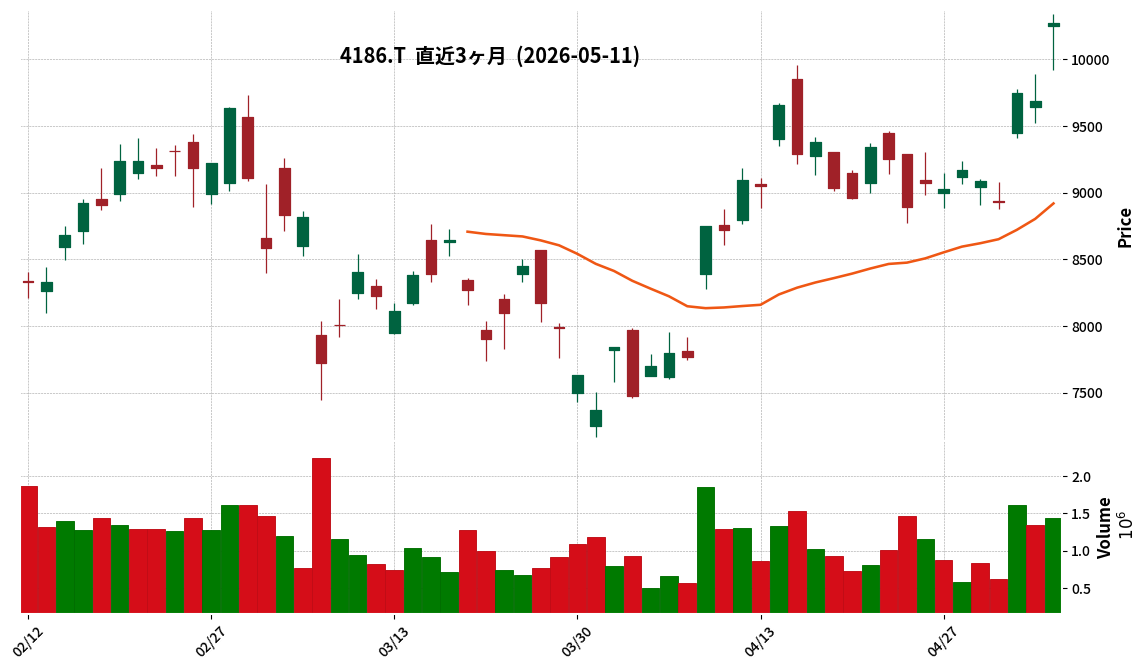
4186|東応化
10270.0
▲ +6.01%
This article is an AI-generated summary and analysis of official IR disclosures.
📄 Announcement (AI-Reviewed)
- Tokyo Ohka Kogyo Co., Ltd. (TOK) announced its consolidated financial results for the first quarter of the fiscal year ending December 2026 (January 1, 2026 – March 31, 2026).
- Consolidated net sales reached ¥67,077 million (up 23.6% year-on-year), operating profit was ¥15,074 million (up 53.8%), ordinary profit ¥15,374 million (up 56.2%), and profit attributable to owners of parent was ¥11,725 million (up 55.8%).
- Segment sales showed Electronics Functional Materials at ¥35,795 million (up 29.0% year-on-year) and High Purity Chemicals at ¥29,986 million (up 17.2% year-on-year).
- The equity ratio as of the end of the first consolidated accounting period was 68.9%, an increase of 1.0 percentage point from the end of the previous fiscal year.
- The consolidated earnings forecast for the fiscal year ending December 2026, including the annual dividend forecast of ¥80.00, remains unchanged from the figures announced on February 9, 2026.
🤖 AI Perspective
The strong performance in the first quarter appears to be primarily driven by robust demand for generative AI-related products and a favorable yen depreciation trend. The significant increase in sales for the Electronics Functional Materials segment, in particular, may suggest a recovery in the semiconductor market. Despite the substantial profit growth, keeping the full-year earnings forecast unchanged could indicate a cautious stance in monitoring future market conditions and business developments.
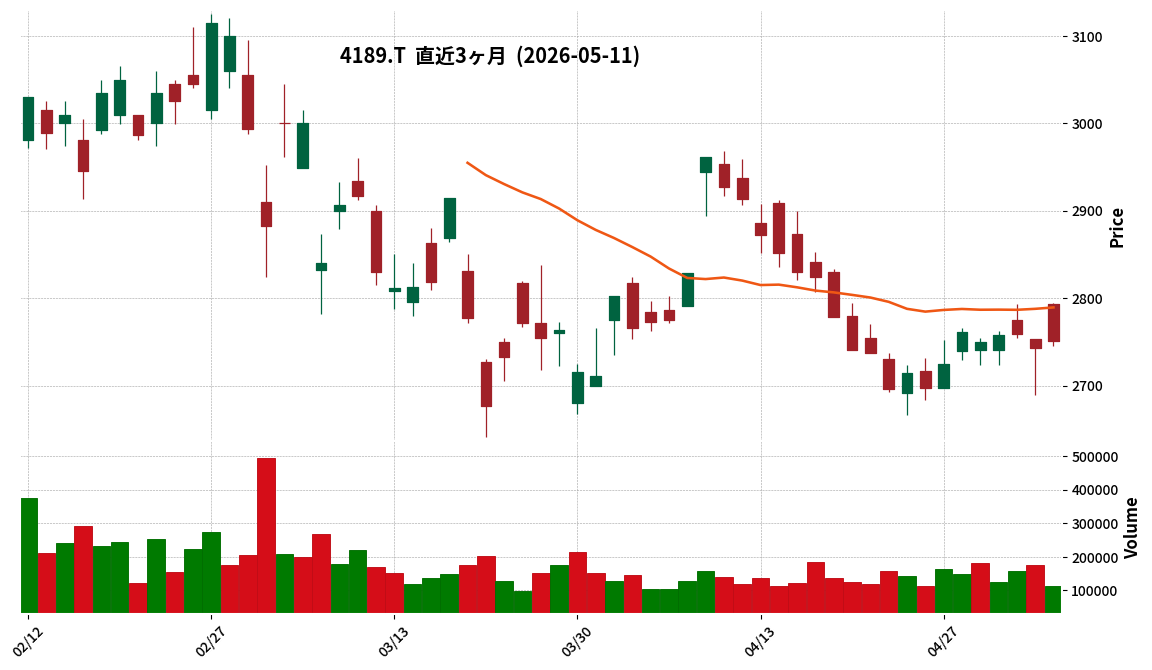
4189|KHネオケム
2751.0
▲ +0.29%
This article is an AI-generated summary and analysis of official IR disclosures.
📄 Announcement (AI-Reviewed)
- KH Neochem Co., Ltd. announced its consolidated financial results for the first quarter of the fiscal year ending December 2026 (January 1, 2026 – March 31, 2026).
- For the cumulative first quarter, net sales were ¥25,581 million (down 11.2% year-on-year), operating income was ¥2,094 million (down 22.6% year-on-year), and profit attributable to owners of parent was ¥1,348 million (down 23.8% year-on-year), indicating a decrease in both revenue and profit.
- By business segment, Electronic Materials recorded sales of ¥3,365 million (up 22.5% year-on-year) and operating income of ¥754 million (up 33.0% year-on-year), showing growth in both revenue and profit.
- Conversely, Functional Materials saw sales of ¥12,109 million (down 17.6% year-on-year) and operating income of ¥2,156 million (down 16.1% year-on-year), while Basic Chemicals recorded sales of ¥9,942 million (down 11.0% year-on-year) and operating income of ¥191 million (down 58.2% year-on-year).
- The consolidated full-year earnings forecast for the fiscal year ending December 2026 and the annual dividend forecast (¥110.00 per share) remained unchanged from the most recently announced figures.
🤖 AI Perspective
The first quarter results show a mixed performance across business segments, with an overall decline in revenue and profit. The Electronic Materials segment’s strong growth, driven by AI-related investments, stands out as a key highlight and its continued performance will be worth monitoring. Conversely, the challenges faced by Functional Materials and Basic Chemicals, including inventory adjustments and increased manufacturing costs, may warrant closer attention from investors for their potential impact on future earnings. The unchanged full-year forecast could suggest management anticipates a recovery in the latter half of the fiscal year.
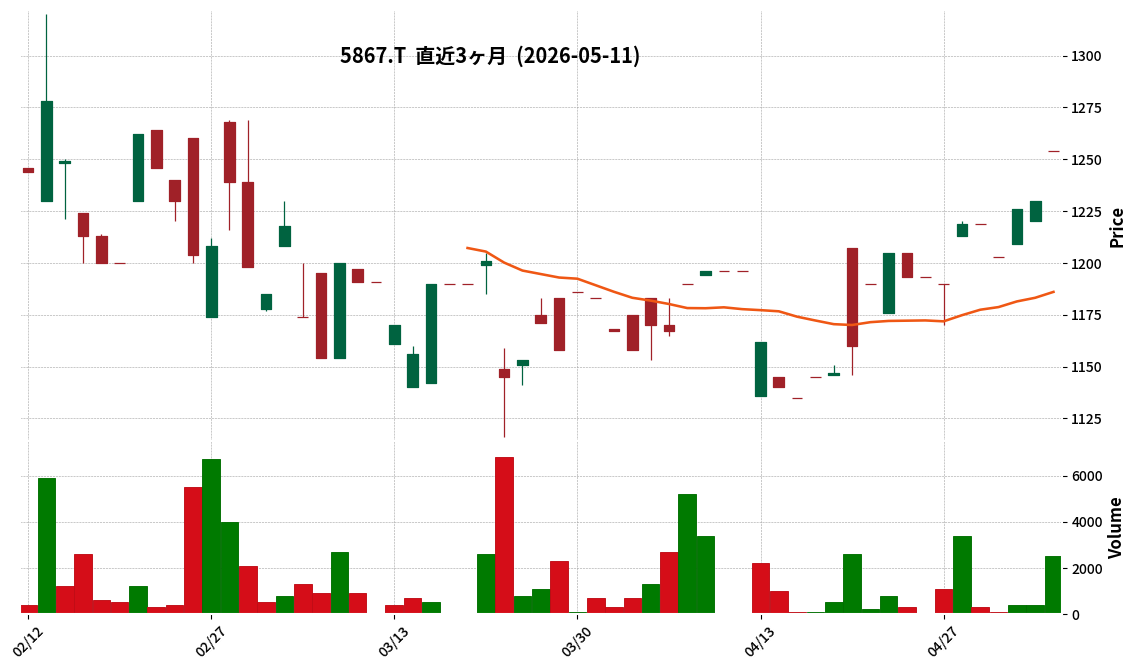
5867|G-エスネット
1254.0
▲ +1.95%
📎 Source:G-エスネット Official IR →
This article is an AI-generated summary and analysis of official IR disclosures.
📄 Announcement (AI-Reviewed)
- For the first quarter of the fiscal year ending December 2026 (January 1, 2026 to March 31, 2026), G-Esnet reported consolidated net sales of ¥978 million (up 19.5% year-on-year), operating income of ¥160 million (up 22.9%), ordinary income of ¥159 million (up 20.8%), and net income attributable to owners of parent of ¥100 million (up 25.7%).
- Diluted earnings per share for the quarter were ¥32.09.
- As of the end of the first quarter, consolidated total assets stood at ¥2,547 million, net assets at ¥1,779 million, and the equity ratio was 66.6%.
- The consolidated full-year forecast for the fiscal year ending December 2026 remains unchanged, projecting net sales of ¥3,936 million, operating income of ¥400 million, ordinary income of ¥376 million, and net income attributable to owners of parent of ¥245 million.
- The full-year forecast for basic earnings per share, ¥77.90, incorporates the impact of the disposal of treasury shares and issuance of new shares as restricted stock, resolved by the Board of Directors on May 11, 2026.
🤖 AI Perspective
G-Esnet’s first-quarter performance for the fiscal year ending December 2026, showing double-digit growth across net sales and all profit categories, may suggest a strong start to the fiscal year. The maintained full-year forecast could indicate the company’s confidence in its current performance trajectory towards achieving its annual goals. Furthermore, an equity ratio of 66.6% points to a solid financial foundation, which investors might consider a positive aspect of the company’s balance sheet.
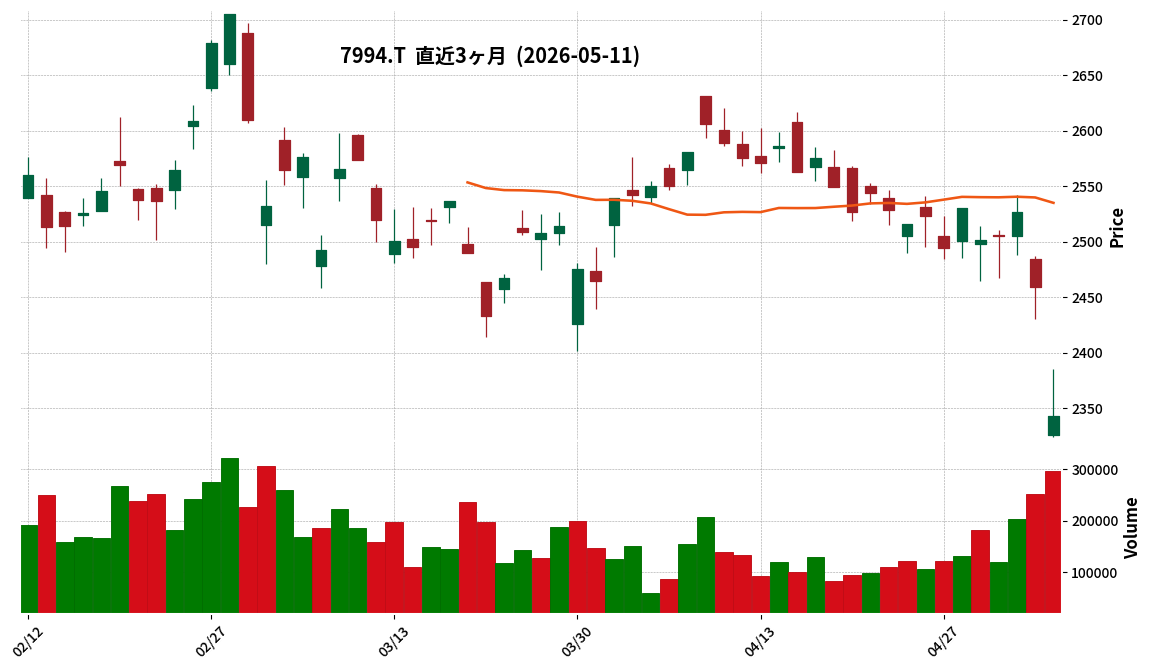
7994|オカムラ
2343.0
▼ -4.72%
This article is an AI-generated summary and analysis of official IR disclosures.
📄 Announcement (AI-Reviewed)
- Okamura Corporation announced a partial correction to its “Consolidated Financial Results for the Fiscal Year Ended March 31, 2026 (Japanese GAAP)” on May 11, 2026, which was originally published on May 8, 2026.
- The correction addresses an error in the numerical reference for the second quarter (cumulative) within “Summary Information 3. Consolidated Earnings Forecast for the Fiscal Year Ending March 31, 2027.”
- The revised consolidated earnings forecast for the second quarter (cumulative) of FY2027 now projects profit attributable to owners of parent at ¥7,000 million (previously ¥9,800 million) and basic earnings per share at ¥73.94 (previously ¥103.51).
- The year-on-year percentage changes for net sales, operating profit, and ordinary profit for the second quarter (cumulative) were also corrected.
- The consolidated full-year earnings forecast for the fiscal year ending March 31, 2027, remains unchanged by this correction.
🤖 AI Perspective
This revision primarily concerns the downward adjustment of the net income forecast for the cumulative second quarter of FY2027, while the consolidated full-year earnings forecast remains unchanged. This could suggest an effort to improve the accuracy of interim reporting without altering the company’s overall annual outlook. Investors may monitor the company’s performance against the unchanged full-year targets.
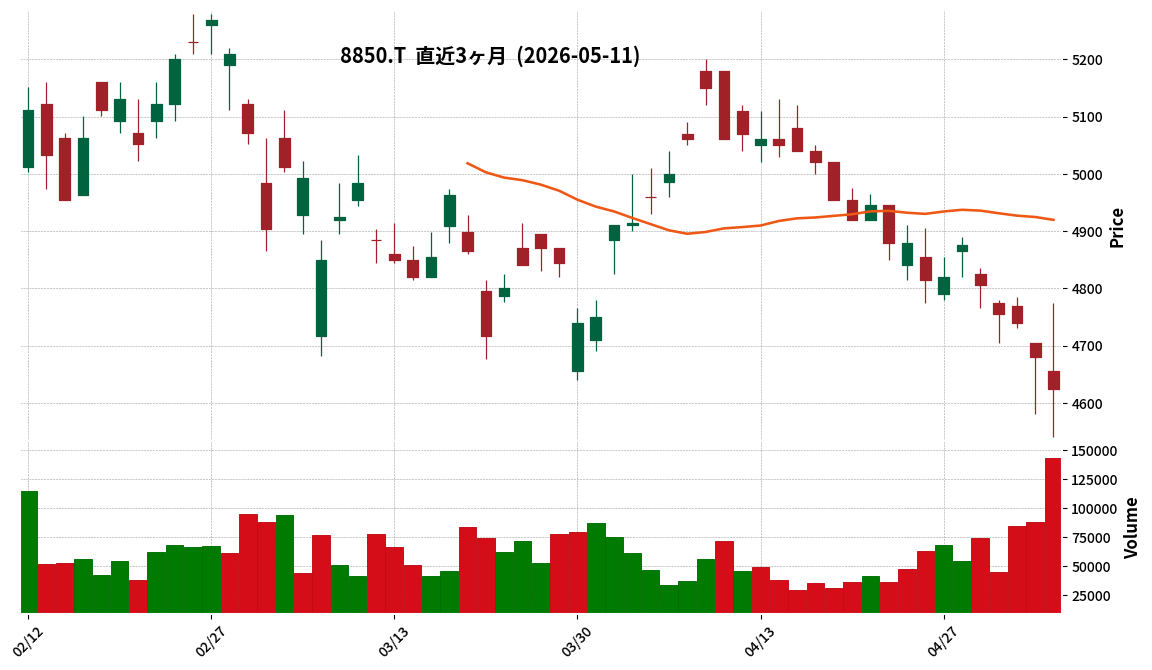
8850|スターツ
4625.0
▼ -1.18%
This article is an AI-generated summary and analysis of official IR disclosures.
📄 Announcement (AI-Reviewed)
- For the fiscal year ended March 31, 2026, Starts Corporation reported consolidated net sales of ¥251.911 billion (up 8.1% year-on-year), operating profit of ¥36.272 billion (up 11.2%), ordinary profit of ¥38.244 billion (up 14.5%), and net profit attributable to parent company shareholders of ¥25.311 billion (up 4.3%).
- The annual dividend for FY2026 was ¥140 per share, an increase of ¥20 from the previous year’s ¥120.
- The company’s stable revenue base strengthened with increased property management numbers, including 158,562 apartment/condominium units, 103,894 monthly parking spaces, and 60,112 “Navi Park” hourly parking spaces.
- The “Pitat House” real estate brokerage network expanded to 632 stores nationwide (116 group stores, 516 network stores), and 131 facilities for elderly support and childcare are in operation.
- For the fiscal year ending March 31, 2027, the company forecasts consolidated net sales of ¥290.0 billion (up 15.1% year-on-year), operating profit of ¥40.0 billion (up 10.3%), ordinary profit of ¥39.0 billion (up 2.0%), and net profit attributable to parent company shareholders of ¥26.0 billion (up 2.7%), with an anticipated annual dividend of ¥150 per share.
🤖 AI Perspective
Starts Corporation achieved strong financial performance in FY2026, reporting increases across net sales and all profit metrics, signaling robust business momentum. The growth in managed property units and the expansion of the “Pitat House” network appear to be key factors contributing to the strengthening of its stable revenue foundation. The announced increase in the annual dividend may suggest a commitment to shareholder returns. Furthermore, the positive consolidated earnings forecast for FY2027, projecting continued growth, could indicate management’s confidence in sustained business expansion.
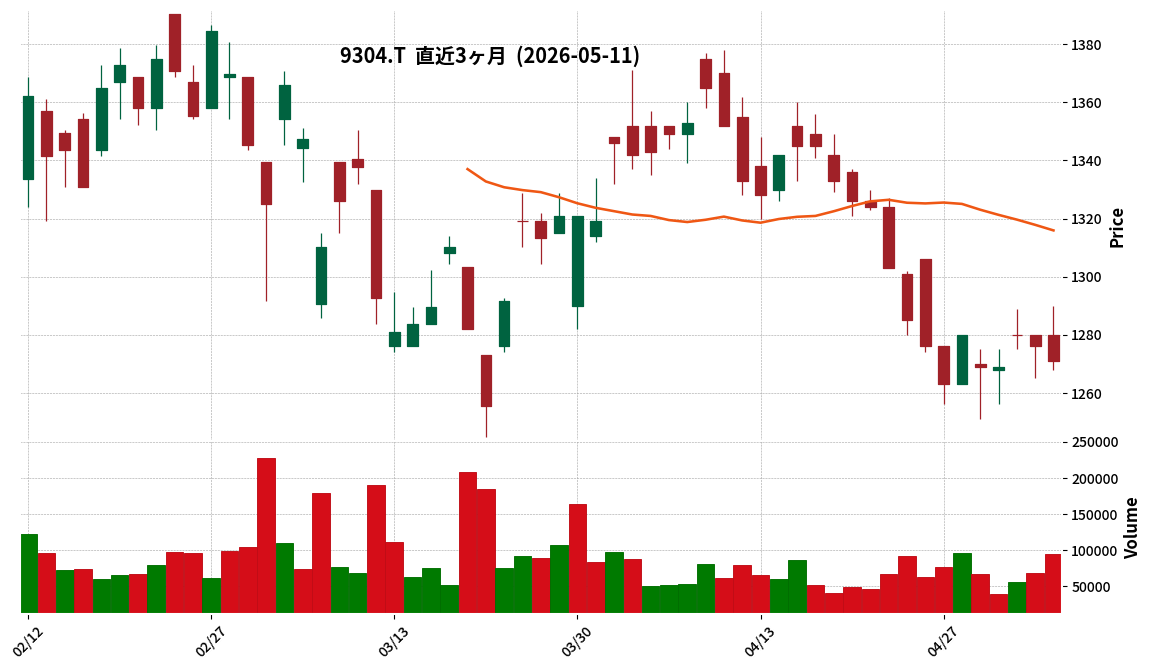
9304|渋沢倉
1271.0
▼ -0.39%
This article is an AI-generated summary and analysis of official IR disclosures.
📄 Announcement (AI-Reviewed)
- Shibusawa Warehouse Co., Ltd. resolved at its Board of Directors meeting on May 11, 2026, to distribute a surplus dividend for the fiscal year ended March 31, 2026.
- This dividend was set at JPY 32 per share, an increase of JPY 2 from the most recent forecast. The effective date is June 5, 2026.
- The company forecasts a dividend of JPY 70 per share for the next fiscal year (ending March 31, 2027).
- Shibusawa Warehouse adheres to a shareholder return policy of a dividend payout ratio of 50% or more, coupled with progressive dividends.
- It is noted that the company implemented a 4-for-1 stock split for its common shares, effective October 1, 2025.
🤖 AI Perspective
The decision to increase the dividend for the fiscal year 2026, coupled with a higher forecast for FY2027, may suggest a continued commitment to shareholder returns. The progressive dividend policy, targeting a payout ratio of 50% or more, could be viewed by investors as a factor supporting long-term dividend stability. The consistent dividend increases, even after a stock split, indicate the company’s focus on returning profits to shareholders.
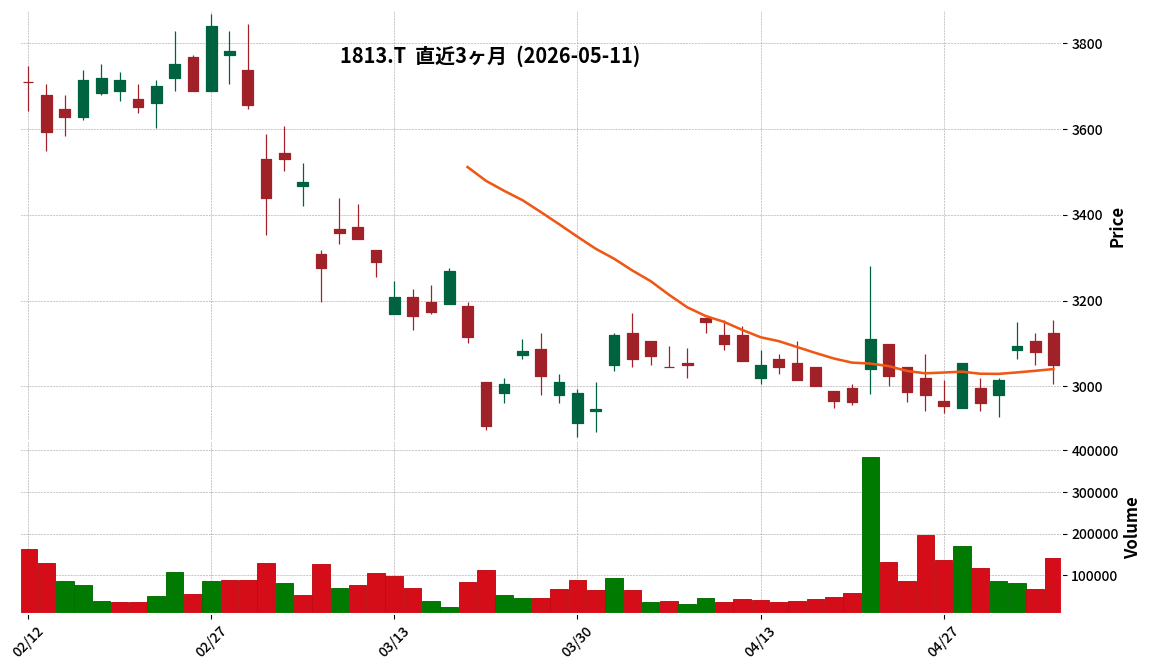
1813|不動テトラ
3050.0
▼ -0.97%
This article is an AI-generated summary and analysis of official IR disclosures.
📄 Announcement (AI-Reviewed)
- Fudo Tetra Co., Ltd. reported consolidated net sales of ¥81,700 million (up 17.5% year-on-year), operating profit of ¥5,919 million (up 86.3%), and ordinary profit of ¥6,124 million (up 81.9%) for the fiscal year ended March 31, 2026.
- Net income attributable to owners of parent increased by 102.6% to ¥4,461 million, resulting in earnings per share of ¥294.62.
- The year-end dividend for the fiscal year ended March 31, 2026, was ¥115.00 per share (an increase of ¥55.00 from the previous year), bringing the annual dividend to ¥115.00 per share.
- In the Civil Engineering segment, net sales rose by 18.9% to ¥33,739 million, while segment profit declined by 49.9% to ¥280 million.
- For the fiscal year ending March 31, 2027, the company forecasts consolidated net sales of ¥81,000 million (down 0.9%), operating profit of ¥4,800 million (down 18.9%), and net income attributable to owners of parent of ¥3,200 million (down 28.3%).
🤖 AI Perspective
The fiscal year ended March 31, 2026, saw substantial profit growth across all income categories, alongside increased net sales. However, the Civil Engineering segment experienced a decrease in profit despite higher sales, which may indicate varying profitability trends across business segments. The forecast for the fiscal year ending March 2027 projects a decline in revenue and profit, yet the company plans to maintain an annual dividend of ¥115, including a commemorative dividend, which could be interpreted as a commitment to shareholder returns.
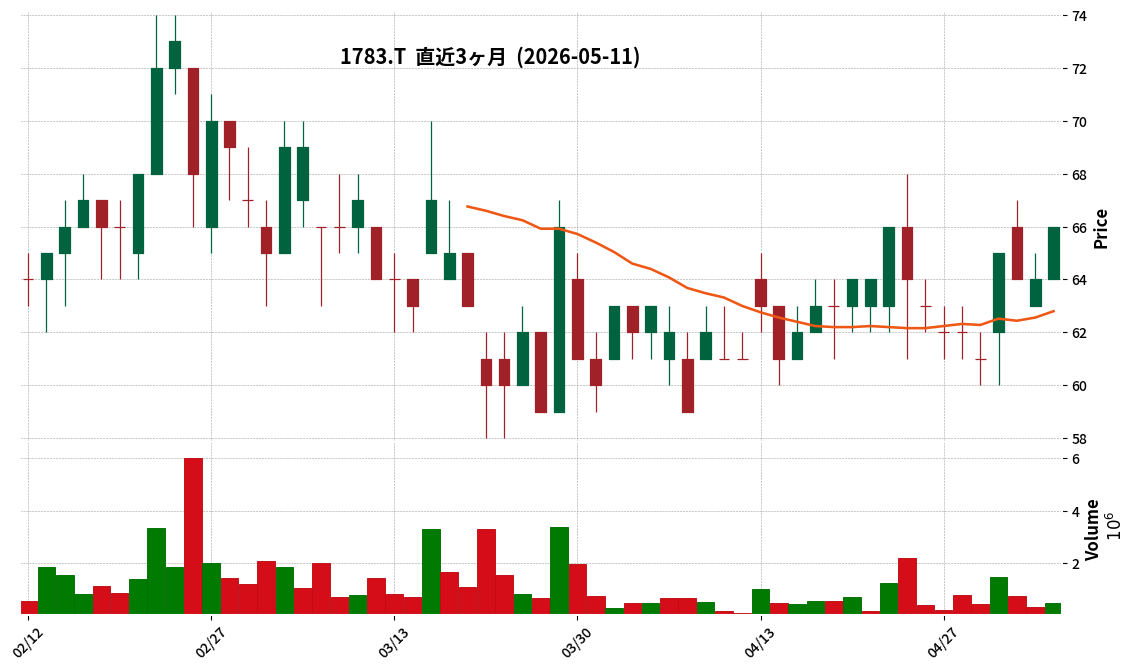
1783|fantasista
66.0
▲ +3.12%
📎 Source:fantasista Official IR →
This article is an AI-generated summary and analysis of official IR disclosures.
📄 Announcement (AI-Reviewed)
- Fantasista Inc. announced that the payment and share transfer procedures for the acquisition of Amoty Co., Ltd. shares were completed on May 11, 2026.
- A total of 8,000 shares were acquired, consisting of 3,332 shares through transfer and 4,668 shares through a third-party allotment.
- The total acquisition price was 120 million yen, with a price of 15,000 yen per share.
- Following the acquisition, Fantasista Inc. holds 8,000 shares, representing a 54.98% voting interest, making Amoty Co., Ltd. a consolidated subsidiary.
- Amoty Co., Ltd. is scheduled to be included in Fantasista Inc.’s consolidated results starting from the September 2026 fiscal year.
🤖 AI Perspective
- Fantasista Inc.’s full acquisition of Amoty Co., Ltd. may suggest an acceleration of business expansion and leveraging of group management resources for the entire group.
- This completion marks the finalization of a process initiated by the basic agreement for a capital and business alliance signed on February 25, 2026, indicating a strategic move for mid-to-long-term growth.
- Fantasista Inc. is currently evaluating the impact on its consolidated performance for the current fiscal year, and further disclosures regarding this impact may be worth monitoring.
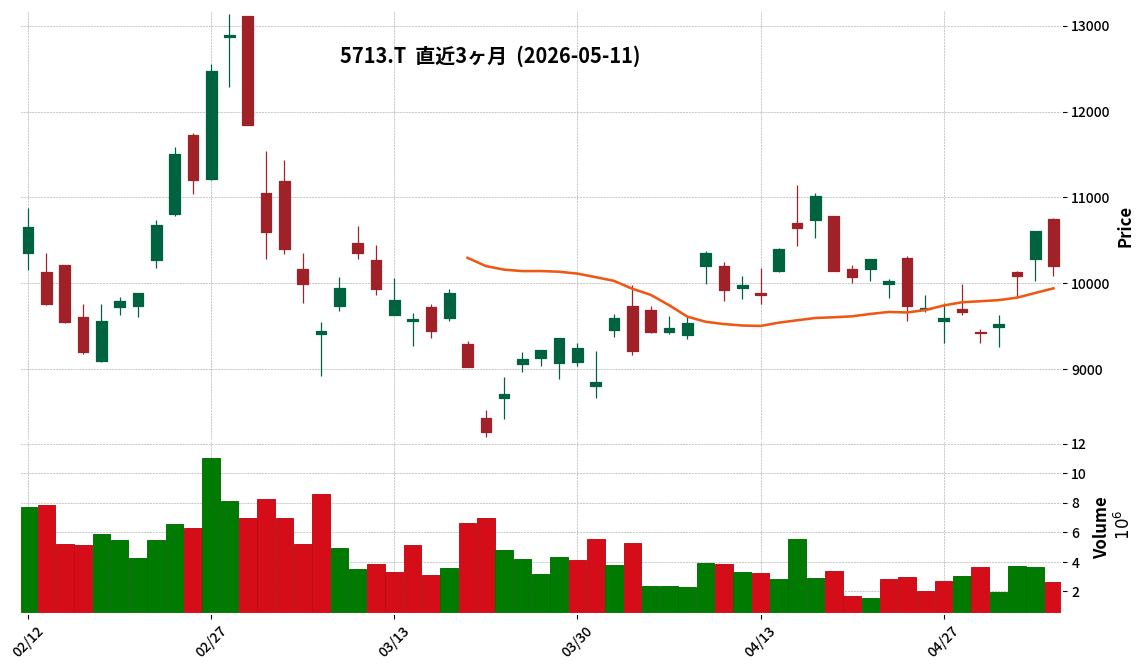
5713|住友鉱
10205.0
▼ -3.86%
This article is an AI-generated summary and analysis of official IR disclosures.
📄 Announcement (AI-Reviewed)
- Sumitomo Metal Mining Co., Ltd. announced on May 11, 2026, a revision to its dividend forecast for the fiscal year ending March 2026 (101st fiscal period).
- The annual dividend per share has been revised upward from the previously announced forecast (February 9, 2026) of JPY 183.00 to JPY 228.00.
- The year-end dividend forecast is now JPY 163.00 per share, an increase of JPY 45.00 from the previous forecast of JPY 118.00 per share.
- This revision is based on the changes to the basic policy for financial strategy and shareholder return policy, which were announced on February 9, 2026.
- The revised shareholder return policy stipulates a consolidated payout ratio of 35% or more in principle, with a lower limit of DOE 3.5% when the consolidated equity ratio exceeds the appropriate level of 55%.
🤖 AI Perspective
This dividend increase appears to be a direct result of Sumitomo Metal Mining’s updated shareholder return policy, revised on February 9, 2026. The policy, which includes a minimum consolidated payout ratio of 35% or a DOE of 3.5% under certain conditions, may suggest a commitment to enhanced and stable shareholder distributions. This adjustment could indicate that the company’s financial performance and capital structure meet the criteria outlined in its new distribution guidelines.
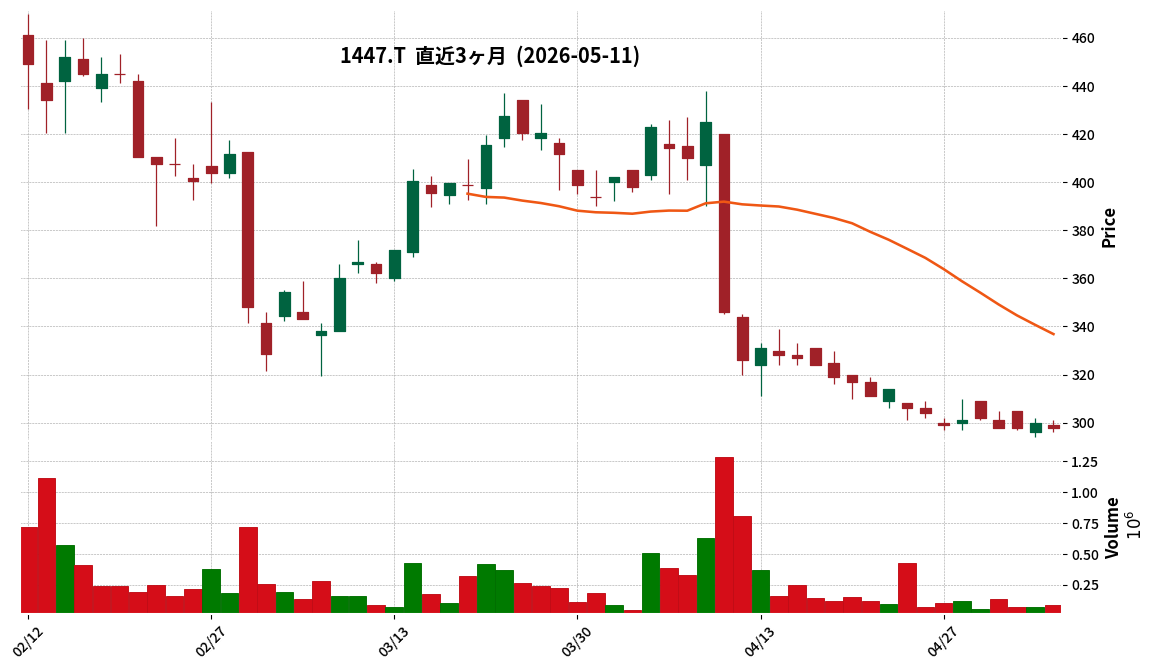
1447|G-SAAFHD
298.0
▼ -0.67%
📎 Source:G-SAAFHD Official IR →
This article is an AI-generated summary and analysis of official IR disclosures.
📄 Announcement (AI-Reviewed)
- For the fiscal year ended March 2026, G-SAAF HD reported consolidated net sales of ¥29,580 million (up 102.5% year-on-year), operating profit of ¥1,093 million (up 327.5% year-on-year), and net profit attributable to parent company shareholders of ¥460 million, achieving a turnaround from a loss in the previous fiscal year.
- Operating profit, ordinary profit, and net profit attributable to parent company shareholders reached record highs since the company’s establishment in 2018.
- All core segments, including the Consulting business, achieved revenue growth, with the Consulting business recording sales of ¥2,276 million (up 114.1% year-on-year).
- The company implemented profit structure reforms, including the downsizing and liquidation of unprofitable businesses and a reduction in head office expenses, which contributed ¥566 million to the improvement of operating profit.
- In the fourth quarter of FY2026/3, the company executed growth investments, including the acquisition of shares (approximately ¥1.57 billion) associated with a capital and business alliance with Schoo Co., Ltd.
🤖 AI Perspective
The significant turnaround from a loss in the previous fiscal year to record-high profits in key indicators for FY2026/3 appears to be a notable point for investors. Revenue growth across all segments, particularly the strong performance of the Consulting business, alongside the effects of profit structure reforms, likely contributed to this improvement. The strategic investment in a capital and business alliance with Schoo Co., Ltd. could also signal future business expansion directions.
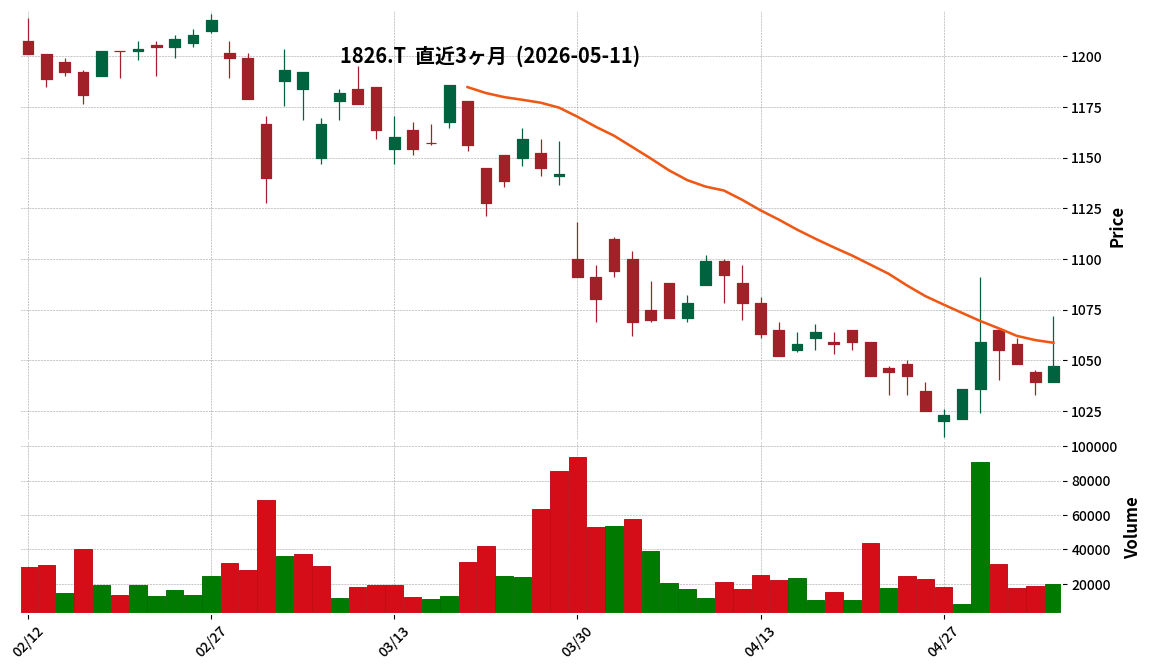
1826|佐田建
1047.0
▲ +0.77%
This article is an AI-generated summary and analysis of official IR disclosures.
📄 Announcement (AI-Reviewed)
- Sata Kensetsu Co., Ltd. announced its consolidated financial results for the fiscal year ended March 31, 2026, on May 11, 2026.
- For the period, net sales were ¥36,769 million (up 14.0% year-on-year), operating profit was ¥1,772 million (up 84.4% year-on-year), and net profit attributable to owners of parent was ¥964 million (up 57.7% year-on-year).
- Basic earnings per share for FY2026 were ¥71.57.
- The company announced an annual dividend of ¥60.00 per share for FY2026, consistent with the previous fiscal year, and forecasts the same for FY2027.
- For the fiscal year ending March 31, 2027, the company forecasts consolidated net sales of ¥37,600 million (up 2.3% year-on-year), but expects operating profit of ¥1,500 million (down 15.3% year-on-year) and net profit attributable to owners of parent of ¥910 million (down 5.6% year-on-year).
204A|P-タイヨーパッケー
1250.0
▲ +0.00%
📎 Source:P-タイヨーパッケー Official IR →
This article is an AI-generated summary and analysis of official IR disclosures.
📄 Announcement (AI-Reviewed)
- Taiyo Package Co., Ltd. (Code: 204A) announced its non-consolidated interim financial results for the fiscal year ending September 2026 (October 1, 2025 – March 31, 2026).
- For the interim period, net sales were ¥2,149 million (down 0.1% year-on-year), operating profit ¥158 million (down 15.7%), ordinary profit ¥169 million (down 14.9%), and interim net profit ¥123 million (down 9.6%).
- As of the end of the interim period, total assets stood at ¥4,547 million, net assets at ¥1,463 million, and the equity ratio at 32.2%.
- The full-year performance forecast for FY2026 remains unchanged, projecting net sales of ¥4,440 million (up 2.5% year-on-year), operating profit of ¥225 million (down 29.9%), and net profit of ¥167 million (down 35.0%).
- The projected annual dividend for FY2026 is ¥200.00 per share (interim ¥100.00, year-end ¥100.00), with no revisions from the latest forecast.
🤖 AI Perspective
The interim period shows net sales largely flat year-on-year, yet all profit categories experienced double-digit declines, which may indicate ongoing challenges in profitability. With the full-year forecast remaining unchanged, examining the interim performance in relation to the full-year targets could offer insights into future business operations and management strategies. The impact of changes in cost structure and the competitive landscape on performance will be worth monitoring.
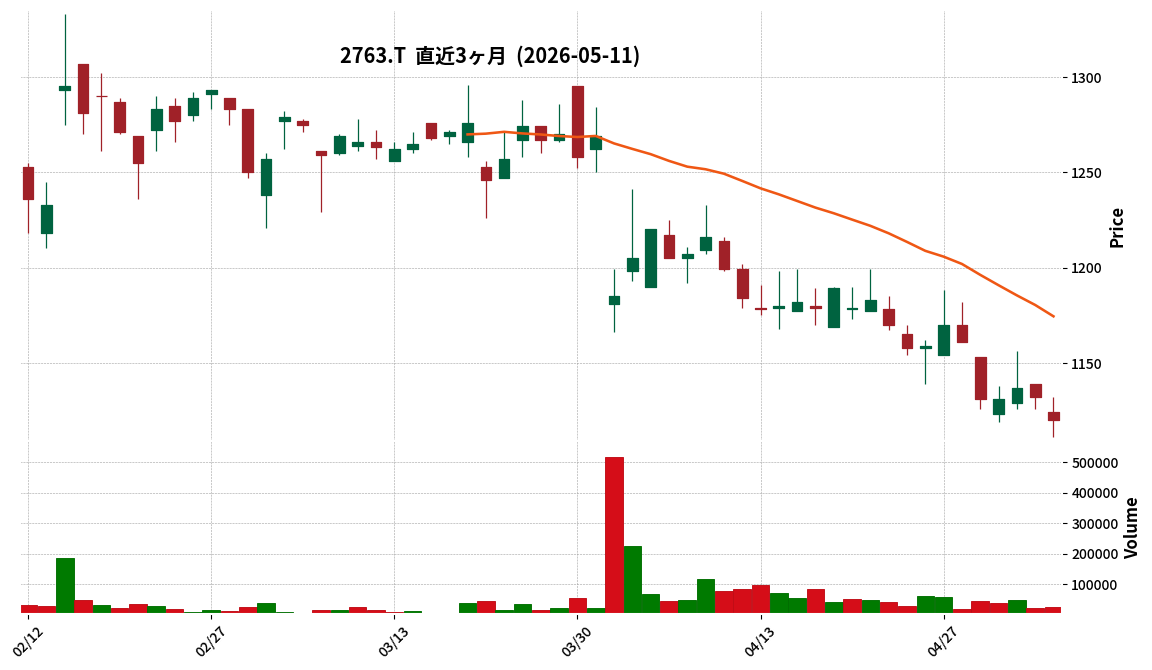
2763|エフティグループ
1120.0
▼ -1.06%
📎 Source:エフティグループ Official IR →
This article is an AI-generated summary and analysis of official IR disclosures.
📄 Announcement (AI-Reviewed)
- For the fiscal year ended March 2026, consolidated revenue was JPY 31,579 million (down 8.8% year-on-year), and net profit attributable to owners of parent was JPY 6,461 million (down 2.3% year-on-year).
- The annual dividend for FY2026 was JPY 55.00 (interim JPY 20.00, year-end JPY 35.00), with a consolidated payout ratio of 25.3%.
- The consolidated earnings forecast for FY2027 projects revenue of JPY 29,400 million (down 6.9% year-on-year) and net profit attributable to owners of parent of JPY 3,800 million (down 41.2% year-on-year).
- FT Group shares are scheduled to be delisted on July 30, 2026, due to a share exchange with Hikari Tsushin Inc., and consequently, the dividend forecast for FY2027 has not been disclosed.
- As of March 2026, the consolidated financial position showed an increase in equity attributable to owners of parent to JPY 35,287 million (up 18.2% year-on-year), with the ratio of equity attributable to owners of parent rising to 77.8% (up 4.3 percentage points).
🤖 AI Perspective
While FT Group’s revenue and profits decreased in FY2026, the company maintained high-profit margins, which may be a point of interest for investors. However, the substantial projected decline in profits for FY2027 could indicate shifts in the business environment. The upcoming share exchange with Hikari Tsushin Inc. and subsequent delisting represent a significant strategic turning point, and investors might monitor the implications for the company’s business continuity and governance structure.
2816|ダイショー
1407.0
▲ +0.43%
This article is an AI-generated summary and analysis of official IR disclosures.
📄 Announcement (AI-Reviewed)
- Daisho Co., Ltd. announced its non-consolidated financial results for the fiscal year ended March 31, 2026 (April 1, 2025 – March 31, 2026).
- For the current fiscal year, net sales increased by 4.8% to 27,489 million yen, and operating profit rose by 3.7% to 680 million yen, marking increases in both revenue and profit.
- However, ordinary profit decreased by 1.0% to 666 million yen, and net profit declined by 0.7% to 455 million yen.
- The annual dividend for the fiscal year ended March 31, 2026, was set at 21.00 yen per share (including a year-end dividend of 12.00 yen and a commemorative dividend of 3.00 yen), an increase from 18.00 yen in the previous fiscal year.
- For the fiscal year ending March 31, 2027 (April 1, 2026 – March 31, 2027), the company forecasts net sales of 28,500 million yen (up 3.7% YoY) and operating profit of 700 million yen (up 2.9% YoY), while anticipating a decrease in net profit to 420 million yen (down 7.7% YoY).
🤖 AI Perspective
The financial results for FY2026 indicate that while net sales and operating profit saw growth, an increase in non-operating expenses likely impacted the decline in ordinary and net profits. The increased annual dividend, including a commemorative dividend, may suggest a focus on shareholder returns. For the FY2027 forecast, the projected increase in sales and operating profit alongside a decrease in net profit could draw attention to the company’s future cost structure and business strategies.
4091|日本酸素HD
5876.0
▲ +4.26%
This article is an AI-generated summary and analysis of official IR disclosures.
📄 Announcement (AI-Reviewed)
- Nippon Sanso Holdings reported consolidated revenue of ¥1,359,611 million for the fiscal year ended March 31, 2026, marking a 3.9% increase year-on-year, with profit attributable to owners of parent rising 25.4% to ¥123,891 million.
- Core operating profit reached ¥203,084 million (up 7.4% year-on-year), and operating profit was ¥197,882 million (up 19.3% year-on-year).
- The annual dividend for the fiscal year ended March 31, 2026, was ¥62.00 per share, an increase of ¥11.00 from the previous fiscal year.
- For the fiscal year ending March 31, 2027, the company forecasts consolidated revenue of ¥1,380,000 million (up 1.5% year-on-year) and profit attributable to owners of parent of ¥131,000 million (up 5.7% year-on-year).
- At the end of the fiscal year, total assets were ¥2,767,679 million, and the ratio of equity attributable to owners of parent improved to 44.0%, a 3.5 percentage point increase from the previous fiscal year-end.
🤖 AI Perspective
The significant increase in profits for FY2026, despite a decrease in shipment volumes in key markets, appears to be primarily driven by effective price management and continuous productivity improvement initiatives. The improved ratio of equity attributable to owners of parent may also suggest a strengthening of the company’s financial foundation. The forecast for continued revenue and profit growth in FY2027 indicates management’s confidence in navigating dynamic business environments and maintaining a stable growth trajectory. The increase in the annual dividend for FY2026 and the projected further increase for FY2027 could be seen as a commitment to enhancing shareholder returns.
4202|ダイセル
1229.5
▲ +0.65%
This article is an AI-generated summary and analysis of official IR disclosures.
📄 Announcement (AI-Reviewed)
- Daicel Corporation received a dividend of ¥10,950 million on February 10, 2026, from its consolidated subsidiary, Daicel (China) Investment Co., Ltd.
- On April 27, 2026, the company resolved to record a provision for contingent liabilities from debt guarantees amounting to ¥24,322 million for its consolidated subsidiary, TOPAS Advanced Polymers GmbH, to prepare for potential losses related to debt guarantees.
- The received dividend will be recorded as non-operating income, and the provision for contingent liabilities as an extraordinary loss, in the individual financial statements for the fiscal year ended March 2026.
- These entries solely affect the individual financial statements and have no impact on the consolidated financial performance.
🤖 AI Perspective
This announcement highlights two significant items impacting Daicel’s individual financial statements: a dividend receipt from one consolidated subsidiary and the recording of a provision for contingent liabilities related to another. While the dividend receipt positively affects individual earnings and the provision negatively impacts individual earnings, the key takeaway for investors may be that these items will not affect the company’s consolidated results. The provision for TOPAS Advanced Polymers GmbH could suggest a need to monitor the financial health of this specific subsidiary.
4491|Cマネージメント
3005.0
▲ +0.30%
📎 Source:Cマネージメント Official IR →
This article is an AI-generated summary and analysis of official IR disclosures.
📄 Announcement (AI-Reviewed)
- For the fiscal year ended March 31, 2024 (FY2024), C Management’s consolidated net sales increased by 4.2% year-on-year to ¥8,235 million, operating profit grew by 22.3% to ¥628 million, and profit attributable to owners of parent increased by 28.6% to ¥511 million.
- Diluted earnings per share for FY2024 was ¥251.21.
- The consolidated financial position for FY2024 showed total assets of ¥5,727 million, net assets of ¥4,150 million, and an equity ratio of 72.5%.
- The annual dividend for FY2024 was announced at ¥60.00 per share, including a year-end dividend of ¥60.00.
- For the fiscal year ending March 31, 2025 (FY2025), the company forecasts consolidated net sales of ¥9,020 million (up 9.5% year-on-year), operating profit of ¥675 million (up 7.3% year-on-year), and profit attributable to owners of parent of ¥512 million (up 0.0% year-on-year).
🤖 AI Perspective
C Management delivered a strong performance in FY2024, with year-on-year increases in net sales, operating profit, ordinary profit, and net profit attributable to owners of parent, driven by robust IT investment demand in the information services industry. The significant growth in profit metrics, all exceeding 20%, suggests effective business strategies. Furthermore, an equity ratio of 72.5% indicates a stable financial foundation, which could be a positive factor for investors.
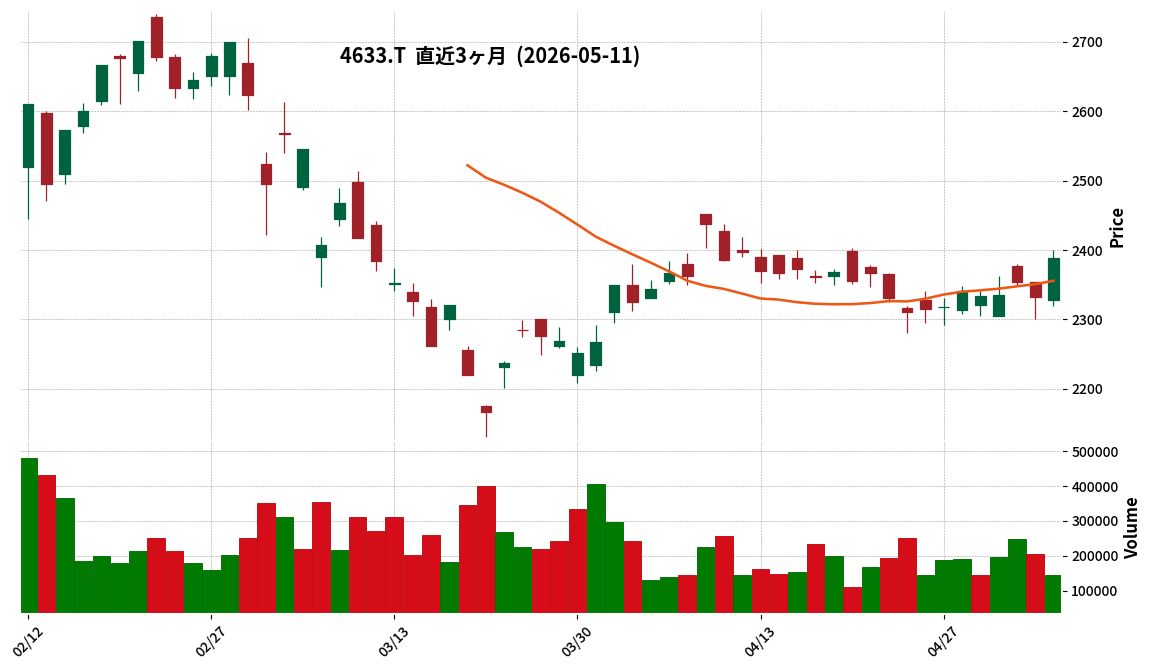
4633|サカタインクス
2388.0
▲ +2.40%
📎 Source:サカタインクス Official IR →
This article is an AI-generated summary and analysis of official IR disclosures.
📄 Announcement (AI-Reviewed)
- Sakata INX announced its consolidated financial results for the first quarter of the fiscal year ending December 2026 (January 1 to March 31, 2026).
- During this period, net sales reached JPY 68,121 million, marking a 6.3% increase year-on-year. Operating income grew by 8.2% to JPY 4,173 million, ordinary income by 13.3% to JPY 4,796 million, and net income attributable to owners of parent by 7.7% to JPY 3,314 million.
- Key factors contributing to the sales growth included strong sales performance, particularly in the Americas, robust sales of functional materials, and the positive impact of yen depreciation on currency translation.
- The company’s consolidated full-year earnings forecast for the fiscal year ending December 2026 (Net Sales: JPY 276,000 million, Operating Income: JPY 17,000 million, Ordinary Income: JPY 17,800 million, Net Income Attributable to Owners of Parent: JPY 11,800 million) remains unchanged from the most recently announced figures.
- The annual dividend forecast for the fiscal year ending December 2026 is JPY 100.00 (JPY 50.00 interim, JPY 50.00 year-end), with no revisions from the latest public announcement.
🤖 AI Perspective
Sakata INX’s first-quarter consolidated results for the fiscal year ending December 2026 indicate a solid start, with increases across all key revenue and profit metrics compared to the previous year. Strong sales in the Americas and functional materials, coupled with favorable foreign exchange effects, appear to have been significant contributors. The decision to maintain the full-year forecast may suggest a prudent outlook, and investors might monitor how the company’s strategic initiatives evolve to meet these targets amidst ongoing global economic conditions.
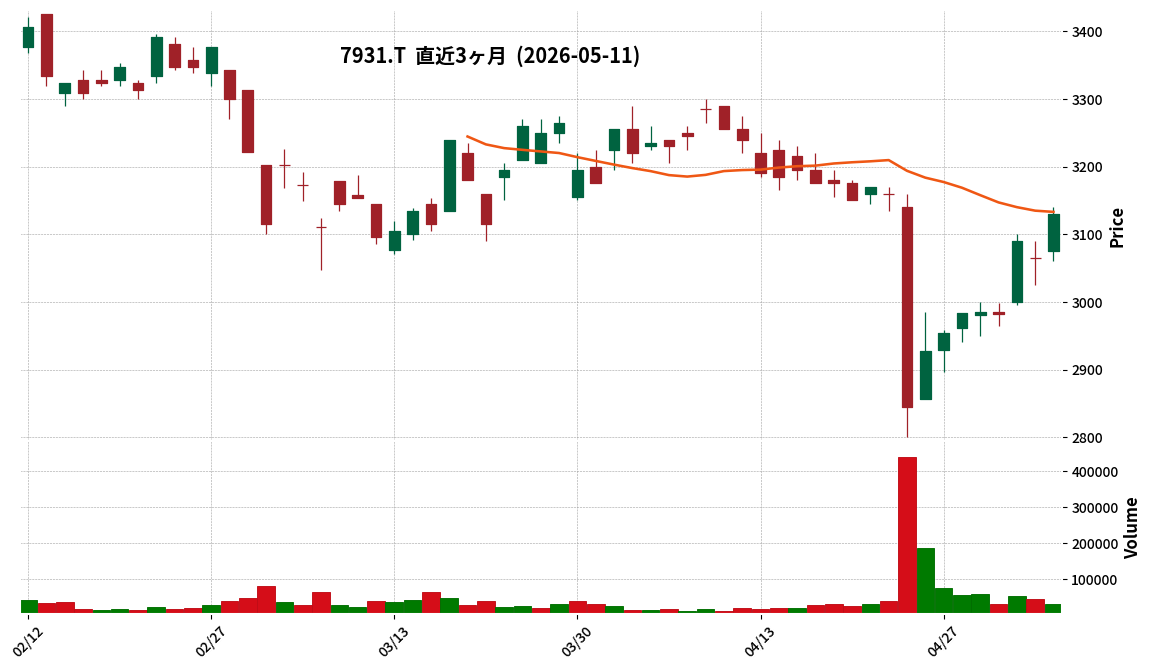
7931|未来工業
3130.0
▲ +2.12%
This article is an AI-generated summary and analysis of official IR disclosures.
📄 Announcement (AI-Reviewed)
- Mirai Industry Co., Ltd. announced on May 11, 2026, a partial correction to its “Consolidated Financial Results for the Fiscal Year Ended March 2026 (Japanese GAAP),” originally disclosed on April 23, 2026.
- The reason for the correction was the discovery of an error in the cost of sales ratio used for intercompany transaction eliminations.
- The corrections primarily affected figures within the “Consolidated Statements of Income,” where the cost of sales for FY2026 March was revised from ¥28,020 million to ¥28,012 million, and gross profit from ¥17,653 million to ¥17,661 million.
- For selling, general and administrative expenses, “Freight” for FY2026 March was revised from ¥2,356 million to ¥2,136 million, and “Other” from ¥4,214 million to ¥4,442 million, changing the total from ¥10,929 million to ¥10,937 million.
- Despite these revisions, the operating profit, ordinary profit, profit before income taxes, net profit, and net profit attributable to owners of the parent for the fiscal year ended March 2026 remained unchanged.
🤖 AI Perspective
This correction is attributed to an accounting error in intercompany transactions. The fact that the revisions to the cost of sales and selling, general and administrative expenses offset each other, resulting in no change to key profitability metrics such as operating income and net income, suggests that the overall impact on the company’s reported performance may be limited. However, the accuracy of financial reporting is a critical factor for investors evaluating a company, and any future disclosures regarding internal control improvements could be worth monitoring.
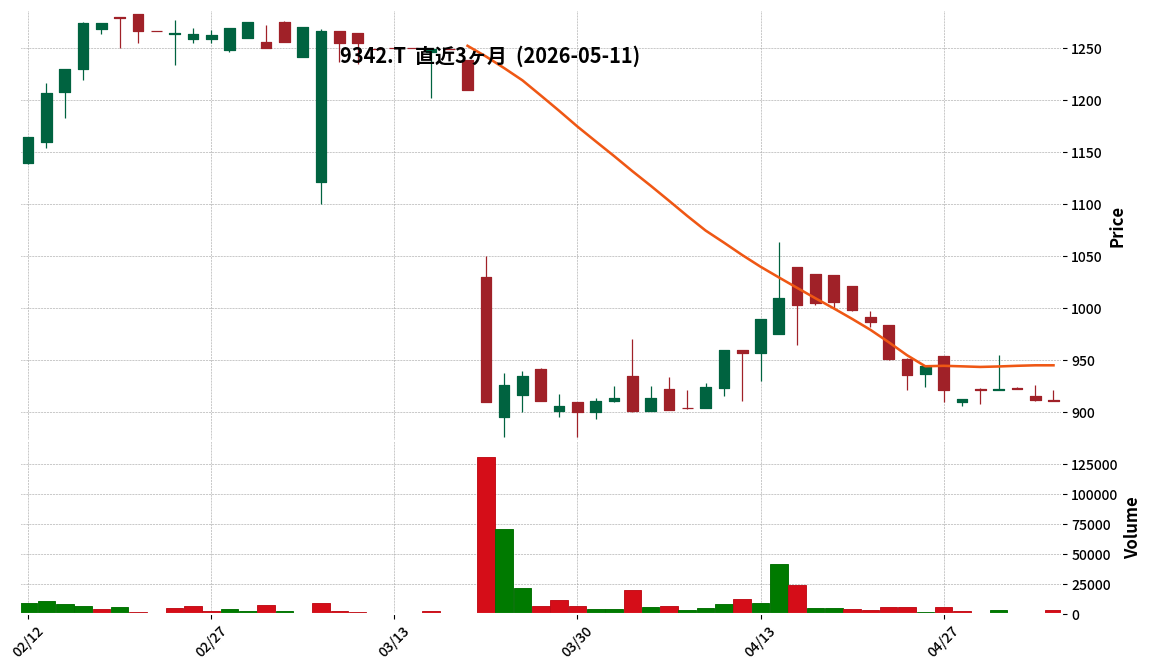
9342|G-スマサポ
911.0
▼ -0.11%
This article is an AI-generated summary and analysis of official IR disclosures.
📄 Announcement (AI-Reviewed)
- G-Sumasapo announced its Q2 FY2026 (interim) financial results for the period from October 1, 2025, to March 31, 2026.
- For the interim period, net sales were ¥1,368 million (down 3.9% year-on-year), operating profit was ¥60 million (down 47.1% year-on-year), ordinary profit was ¥60 million (down 46.9% year-on-year), and interim net profit was ¥37 million (down 60.5% year-on-year).
- User numbers for the key tenant app “totono” increased by 18.0% quarter-on-quarter, and ARPU (average revenue per user) reached ¥122, showing steady progress.
- The overall sales decreased year-on-year due to a transitional period from “totono 1.0” to “totono 2.0.”
- The full-year FY2026 earnings forecast remains unchanged from the most recently announced figures, projecting net sales of ¥3,150 million (up 11.8% year-on-year) and net profit of ¥155 million (up 19.0% year-on-year).
🤖 AI Perspective
While G-Sumasapo reported a decrease in revenue and profits for the interim period, the company highlighted steady progress in its key “totono” app, with increased user numbers and ARPU. The decline in performance is attributed to a transitional period as services migrate from “totono 1.0” to “totono 2.0,” with full-year forecasts remaining unchanged. This suggests the company views the current dip as a short-term effect of strategic upgrades, and investors may monitor the progress of this transition and the impact of ongoing investments in human capital and AI R&D for long-term growth.
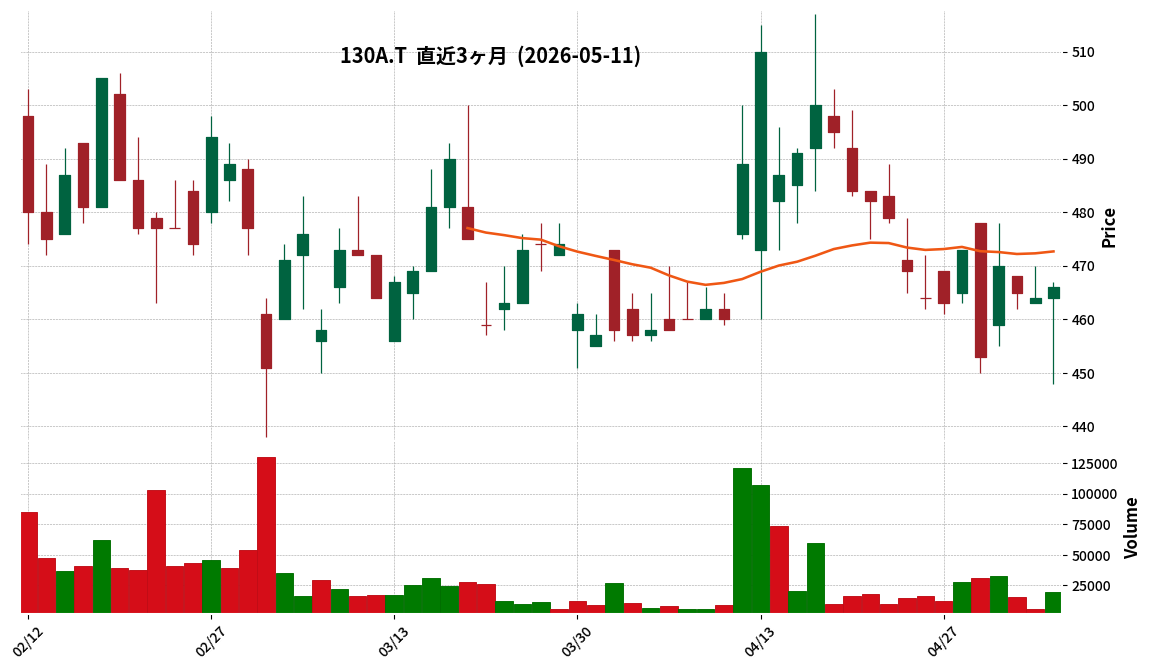
130A|G-VIS
466.0
▲ +0.43%
This article is an AI-generated summary and analysis of official IR disclosures.
📄 Announcement (AI-Reviewed)
- For the first quarter of fiscal year 2026 (January 1 to March 31, 2026), business revenue amounted to ¥17 million, representing a 26.2% decrease compared to the same period of the previous year.
- The net loss for the quarter expanded to ¥256 million, compared to a net loss of ¥79 million in the prior fiscal year’s first quarter.
- An impairment loss of ¥135,520 thousand was recorded as an extraordinary loss, stemming from the impairment of tangible fixed assets acquired during the first quarter.
- As of March 31, 2026, total assets stood at ¥1,785 million and net assets at ¥1,527 million, with the equity ratio decreasing from 94.6% at the end of the previous fiscal year to 85.6%.
- G-VIS reported advancements in its proprietary AI drug discovery platform, aibVIS, through version upgrades, and progressed joint drug discovery research with pharmaceutical companies including Toray Corporation, Shionogi & Co., Ltd., RaQualia Pharma Inc., and Takeda Pharmaceutical Company Limited. The ASO project for acute kidney injury also moved forward with preparations for animal experiments.
🤖 AI Perspective
- The decline in business revenue, coupled with R&D expenses and the recognition of an impairment loss on tangible fixed assets, appears to be key factors in the expanded net loss for the quarter.
- The company’s updates on its AI drug discovery platform and collaborative research efforts may be significant indicators for future revenue generation.
- With the full-year performance forecast remaining unchanged, ongoing progress in business development and monetization efforts will likely be crucial for investors to monitor.
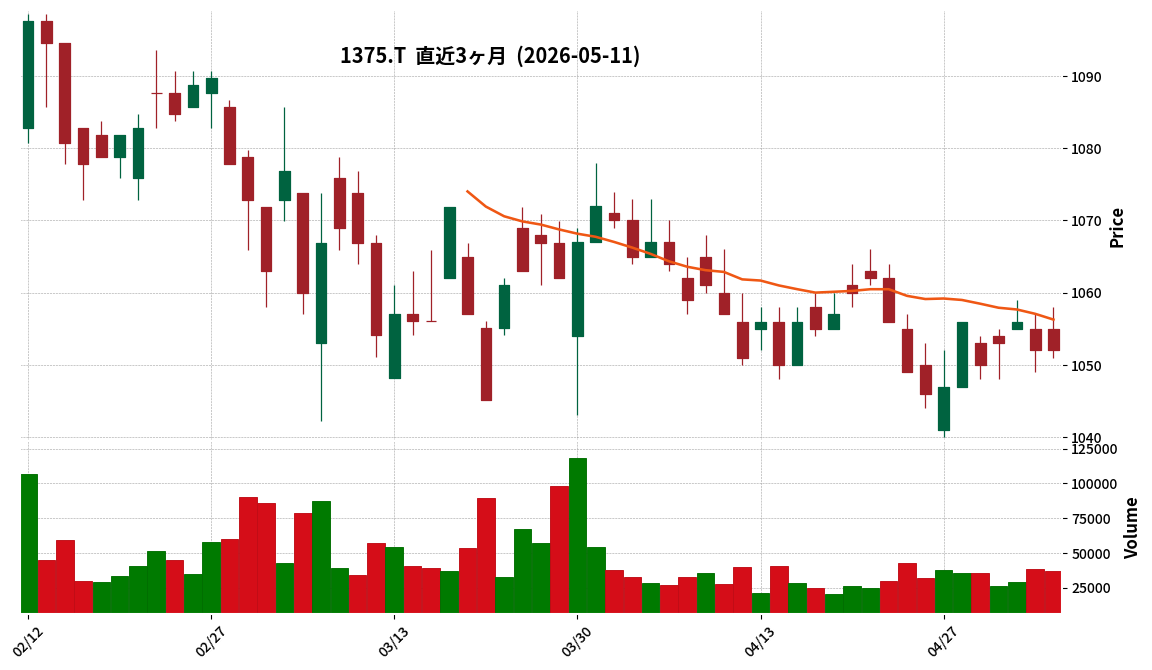
1375|ユキグニファクトリー
1052.0
▲ +0.00%
📎 Source:ユキグニファクトリー Official IR →
This article is an AI-generated summary and analysis of official IR disclosures.
📄 Announcement (AI-Reviewed)
- Yukiguni Factory announced that its consolidated operating results for the fiscal year ended March 31, 2026, exceeded the full-year forecast published on May 9, 2025. Profit attributable to owners of parent increased by 47.2% from ¥2,010 million to ¥2,958 million, and operating profit increased by 32.1% from ¥3,270 million to ¥4,319 million.
- While consolidated revenue fell short of the forecast at ¥37,845 million, higher selling prices for key mushroom products, efficient business operations, and strict control over selling, general and administrative expenses led to the upward revision in profits.
- For individual performance, net profit for the fiscal year ended March 31, 2026, significantly improved to ¥1,568 million from a loss of ¥3 million in the previous fiscal year (ended March 31, 2025). This was primarily due to the resolution of the one-time impact of impairment losses recognized in the mushroom business in the prior period.
- The company decided to increase the year-end dividend for the fiscal year ended March 31, 2026, by ¥7 from the most recent forecast (announced February 9, 2026) of ¥12 per share, to ¥19 per share.
🤖 AI Perspective
- The significant outperformance in profits despite slightly lower revenue suggests the company’s effective cost management and strategic product mix have been successful.
- The substantial improvement in individual net profit, driven by the resolution of prior period’s one-time factors and stabilization of production, may indicate strengthening business fundamentals.
- The increased dividend, consistent with the company’s policy of maintaining a payout ratio of around 30%, reflects a commitment to shareholder returns and confidence in future business growth.
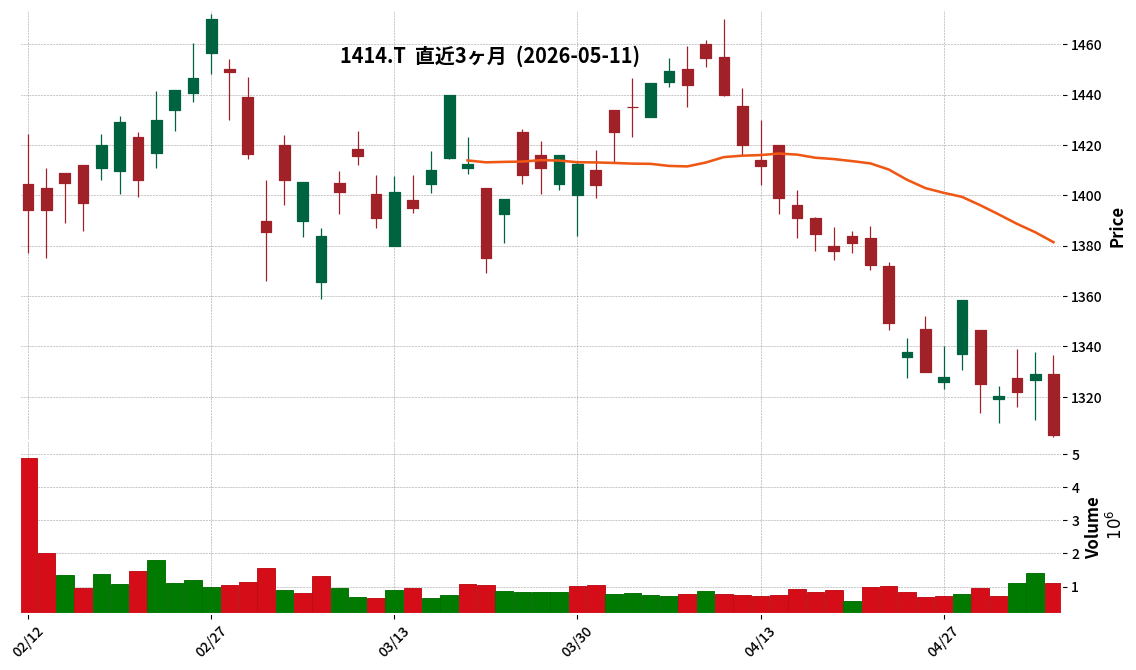
1414|ショーボンド
1305.0
▼ -1.81%
This article is an AI-generated summary and analysis of official IR disclosures.
📄 Announcement (AI-Reviewed)
- Showa Bond Holdings Co., Ltd. announced its consolidated financial results for the third quarter of the fiscal year ending June 2026 (July 1, 2025, to March 31, 2026).
- Consolidated results showed net sales of ¥66,753 million, a 1.7% decrease year-on-year. However, operating profit increased by 1.8% to ¥16,591 million, ordinary profit by 2.8% to ¥16,968 million, and profit attributable to owners of parent by 1.5% to ¥11,860 million.
- Orders received decreased by 4.1% year-on-year to ¥66,234 million, primarily due to sluggish orders for large-scale projects from expressways and local governments in the domestic construction segment.
- The full-year consolidated earnings forecast remains unchanged from the previous announcement, projecting net sales of ¥91,000 million, operating profit of ¥21,000 million, ordinary profit of ¥21,500 million, and profit attributable to owners of parent of ¥15,300 million.
- The company implemented a 4-for-1 stock split of its common shares on January 1, 2026. Per-share information and the year-end dividend forecast (¥25.00 post-split, or ¥100.00 pre-split) are stated on a post-split basis.
🤖 AI Perspective
Despite a decline in net sales, the company achieved increases in operating, ordinary, and net profits, which may be attributed to maintaining a high gross profit margin on completed construction work and an increase in construction material sales. The decrease in orders received could indicate a potential area to monitor for future revenue trends. The reiteration of the full-year forecast suggests management’s confidence in achieving its targets for the remainder of the fiscal year.
189A|G-D&Mカンパニー
928.0
▲ +0.00%
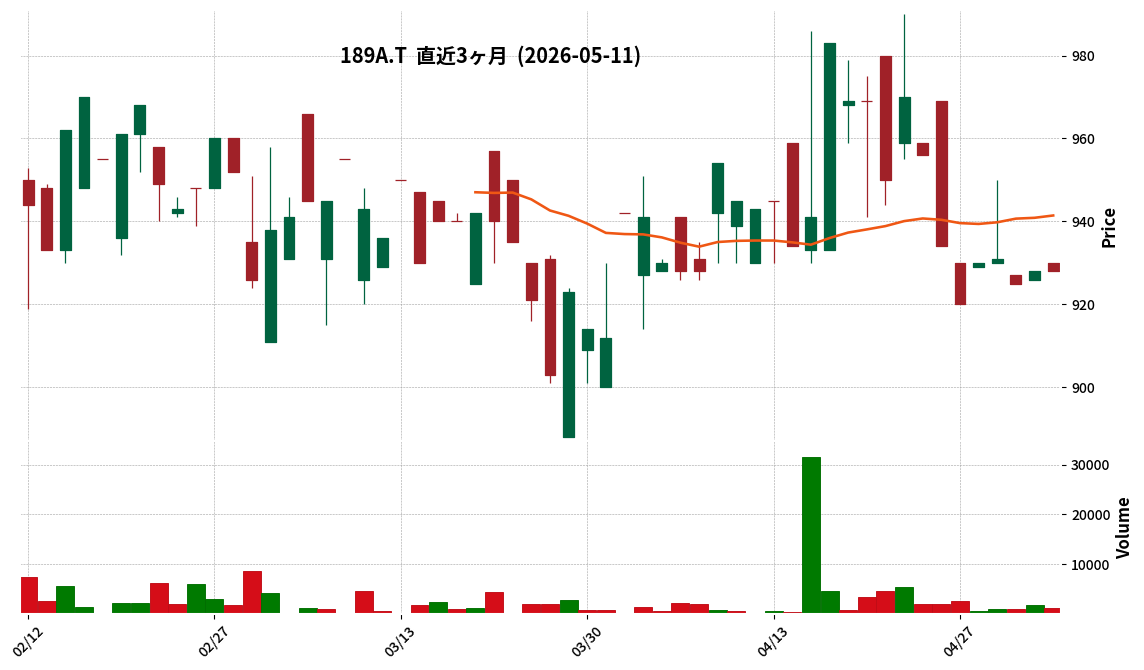
📎 Source:G-D&Mカンパニー Official IR →
This article is an AI-generated summary and analysis of official IR disclosures.
📄 Announcement (AI-Reviewed)
- G-D&M Company (189A) resolved to introduce a shareholder benefit program at its board meeting on May 11, 2026.
- The record date for the program is annually November 30, targeting shareholders holding 300 or more shares of its common stock.
- The benefits will consist of e-gifts (such as Amazon gift cards and various digital points) calculated based on a total fund of 10,000 thousand yen.
- The system offers an enhanced equivalent benefit (2 units) for long-term continuous shareholders, with the first record date set for November 30, 2026.
- The stated objectives of the program are to expand the shareholder base, enhance stock liquidity, promote medium-to-long-term shareholding, and increase company recognition.
🤖 AI Perspective
The shareholder benefit program introduced by G-D&M Company is characterized by a fixed total benefit fund and prioritizes continuous shareholding. This design may suggest the company’s intent to build long-term relationships with its shareholders. The adoption of e-gifts could enhance convenience for recipients and potentially appeal to a broader range of investors, aiming for increased shareholder base and stock liquidity.
1992|神田通機
2746.0
▲ +0.04%
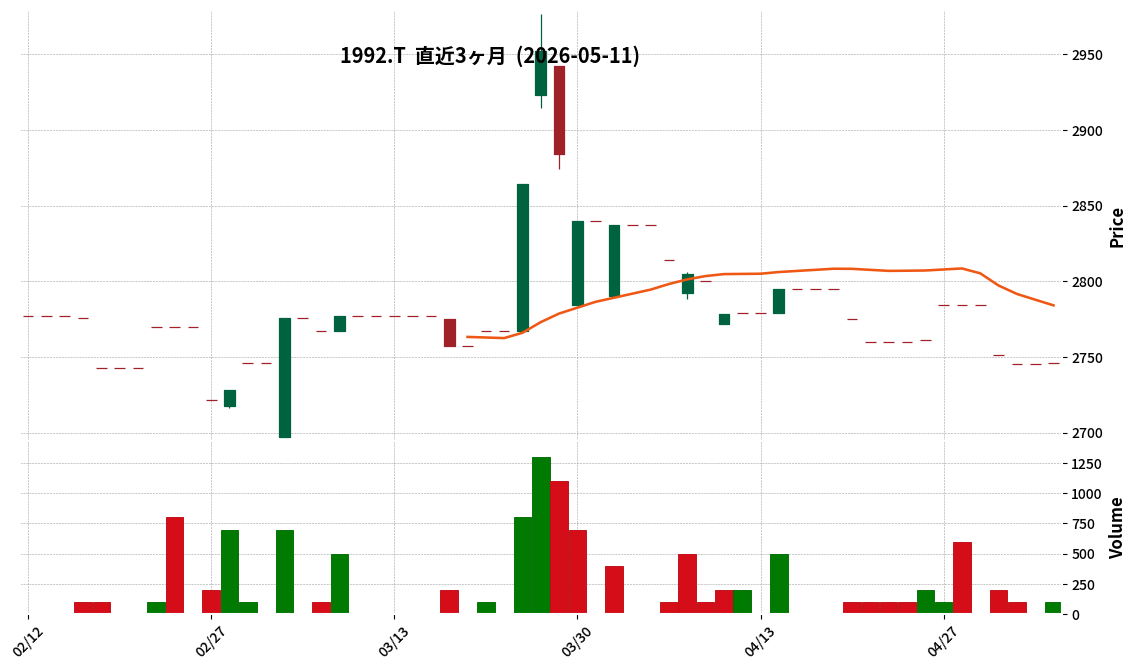
This article is an AI-generated summary and analysis of official IR disclosures.
📄 Announcement (AI-Reviewed)
- Kanda Tsushinki announced on May 11, 2026, a revision to its dividend forecast (increase) for the fiscal year ending March 2026.
- The revised year-end dividend forecast for March 2026 is ¥82 per share, an increase of ¥6 from the previous forecast of ¥76.
- The total annual dividend is also revised from the previous forecast of ¥76 to the current revised forecast of ¥82.
- Reasons for the dividend forecast revision include consolidated performance exceeding the previous forecast, consideration of financial conditions, and bringing forward the achievement of the DOE 3.5% target by one year.
- This matter is scheduled to be submitted to the 89th Annual General Meeting of Shareholders, expected to be held on June 29, 2026.
🤖 AI Perspective
This dividend forecast revision suggests Kanda Tsushinki’s intention to achieve its medium-term management plan goal of “raising DOE to 3.5% or more” a year earlier than initially planned. It could be seen as a tangible reflection of the company’s strengthened commitment to shareholder returns, supported by better-than-expected consolidated performance.
265A|G-エイチエムコム
710.0
▲ +2.90%
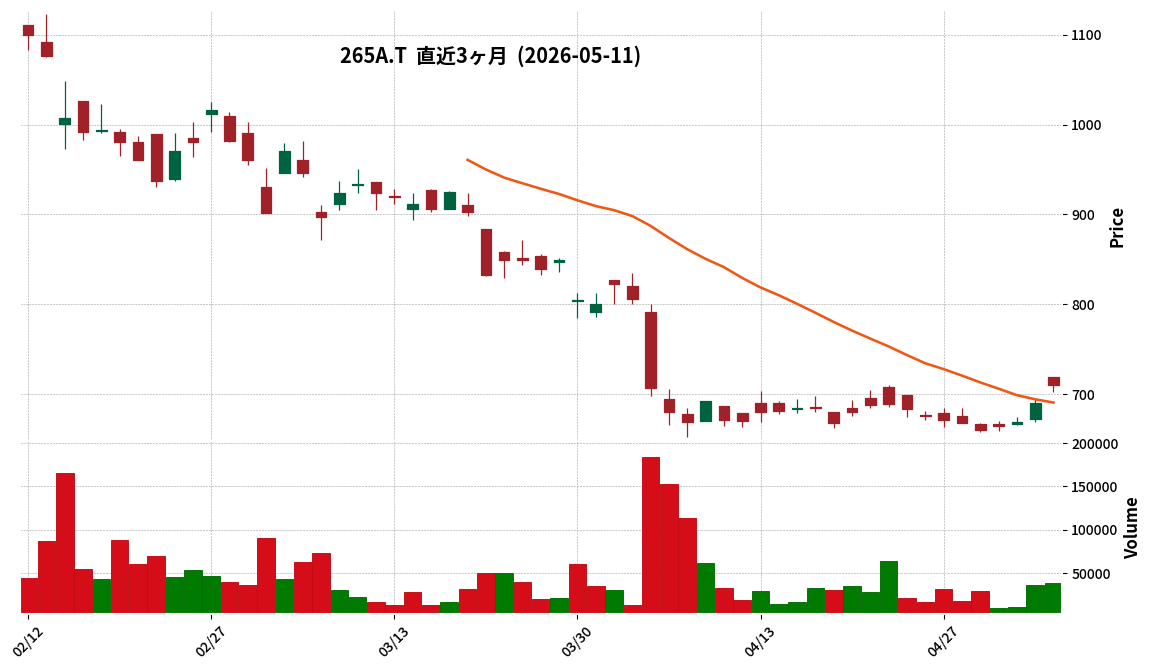
📎 Source:G-エイチエムコム Official IR →
This article is an AI-generated summary and analysis of official IR disclosures.
📄 Announcement (AI-Reviewed)
- Hmcomm Inc. announced on May 11, 2026, the completion of its acquisition of Collabo Techno, making it a wholly-owned subsidiary.
- The acquisition aims to achieve full vertical integration of AI product development, encompassing “Concept, DX Design, and On-site Implementation” within the company group.
- Collabo Techno is noted for its strong project completion capabilities led by PM/PL, highly responsive engineering resources, and ability to transition to AI-driven development.
- This marks Hmcomm’s third strategic M&A, following IP Partners in February 2025 and Fantaractive in August 2025.
- Post-acquisition plans include establishing an early development productivity foundation (0-3 months), building an FDE (Forward Deployed Engineer) system and creating implementation synergies (3-6 months), and full-scale FDE model deployment and recurring revenue expansion (6-12 months).
🤖 AI Perspective
This acquisition appears to establish an integrated in-house system for Hmcomm, covering the entire AI product development lifecycle from planning to implementation and operation. The introduction of the FDE (Forward Deployed Engineer) model could enable the provision of high-value services closely aligned with client needs, potentially accelerating a shift towards a recurring revenue model beyond traditional product sales. These strategies may contribute to strengthening the company’s competitive advantage and enhancing long-term corporate value.
3070|G-ジェリービーンズ
92.0
▼ -1.08%
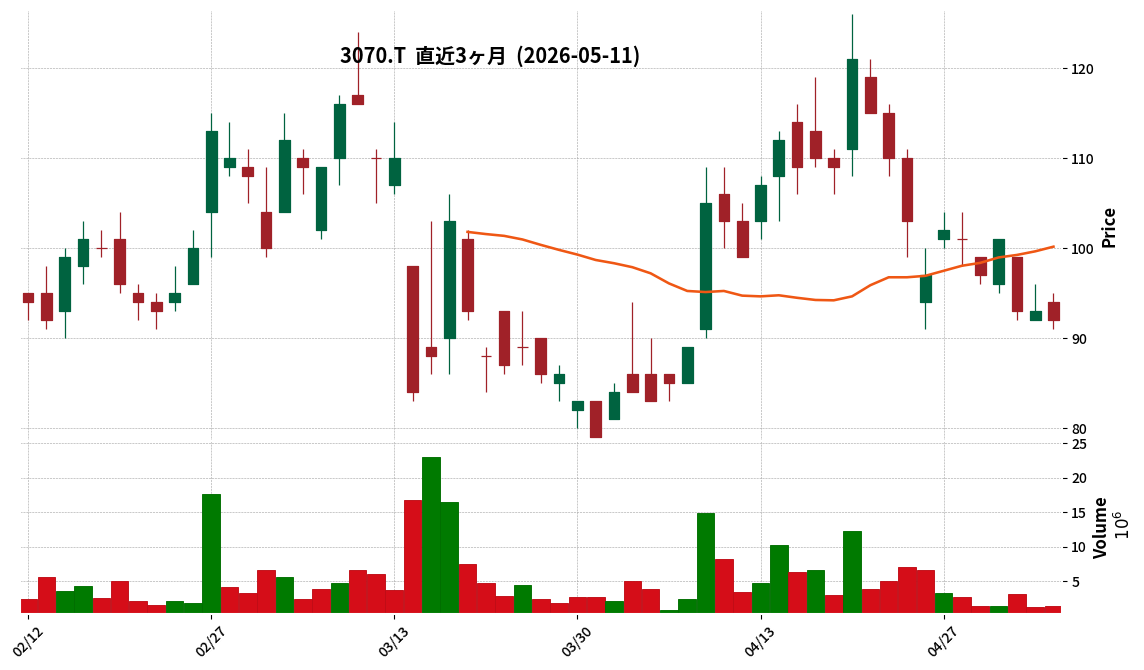
📎 Source:G-ジェリービーンズ Official IR →
This article is an AI-generated summary and analysis of official IR disclosures.
📄 Announcement (AI-Reviewed)
- G-Jelly Beans provided an update regarding its capital and business alliance with Global Cloud Estate and the establishment of a new subsidiary, as initially disclosed on April 28, 2026.
- The registration process for the new subsidiary was completed on May 11, 2026.
- The official name of the subsidiary has been determined as “Jelly Beans Marketing Lab Co., Ltd.,” with its establishment date confirmed as May 11, 2026.
- The commencement date of operations for the subsidiary has been revised to “to be determined after internal discussions, considering the business environment.”
- Key details such as the subsidiary’s capital of 9 million yen, 100% ownership by G-Jelly Beans, and primary business activities (including advertising, marketing, and PR support for group companies) remain unchanged.
🤖 AI Perspective
The completion of the subsidiary’s registration marks a procedural advancement in G-Jelly Beans’ strategic initiatives. The revised operational start date, now subject to internal discussions, may suggest a flexible approach to market entry or business rollout in response to prevailing conditions. Investors may find it worthwhile to monitor further announcements for clarity on the operational timeline and its potential impact on the group’s overall performance.
3288|オープンハウスG
9372.0
▲ +3.24%
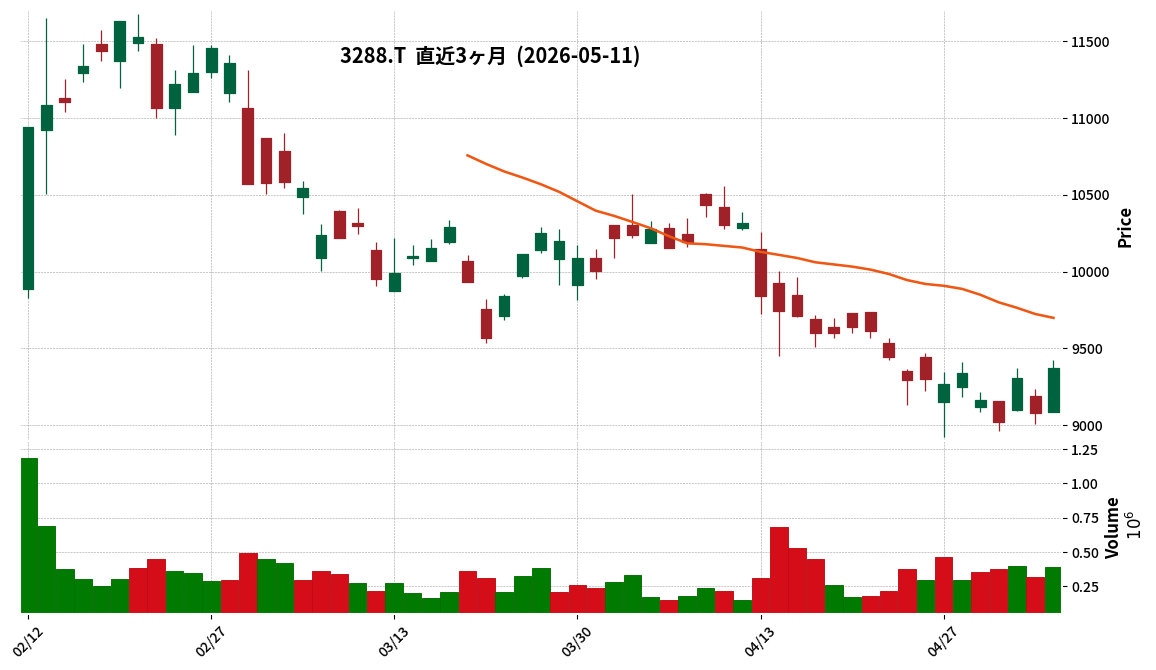
📎 Source:オープンハウスG Official IR →
This article is an AI-generated summary and analysis of official IR disclosures.
📄 Announcement (AI-Reviewed)
- Open House Group Co., Ltd. announced its consolidated financial results for the second quarter (interim period) of the fiscal year ending September 2026 on May 11, 2026.
- For the cumulative consolidated results, net sales reached ¥689,176 million (up 7.1% year-on-year), operating profit was ¥84,398 million (up 14.4%), and net income attributable to owners of parent was ¥57,017 million (up 22.4%).
- The full-year consolidated performance forecast has been revised upward, with net sales now projected at ¥1,485,000 to ¥1,500,000 million, operating profit at ¥176,500 to ¥180,000 million, and net income attributable to owners of parent at ¥116,500 to ¥118,500 million.
- The interim dividend forecast for the fiscal year ending September 2026 is ¥100.00 per share, with an annual dividend forecast of ¥200.00 per share, indicating a projected increase from the previous fiscal year’s interim dividend of ¥84.00.
- By segment, the Detached House Related Business, Condominium Business, and Investment Property Business each recorded year-on-year increases in both net sales and operating profit.
🤖 AI Perspective
The achievement of double-digit growth in key profit items in the second-quarter results and the upward revision of the full-year forecast may suggest favorable business conditions for the company. The condominium business’s turnaround from an operating loss to profitability and significant revenue and profit growth could be a noteworthy point for evaluating future performance. The announced dividend increase forecast also indicates a commitment to shareholder returns.
3294|イーグランド
4855.0
▲ +0.10%
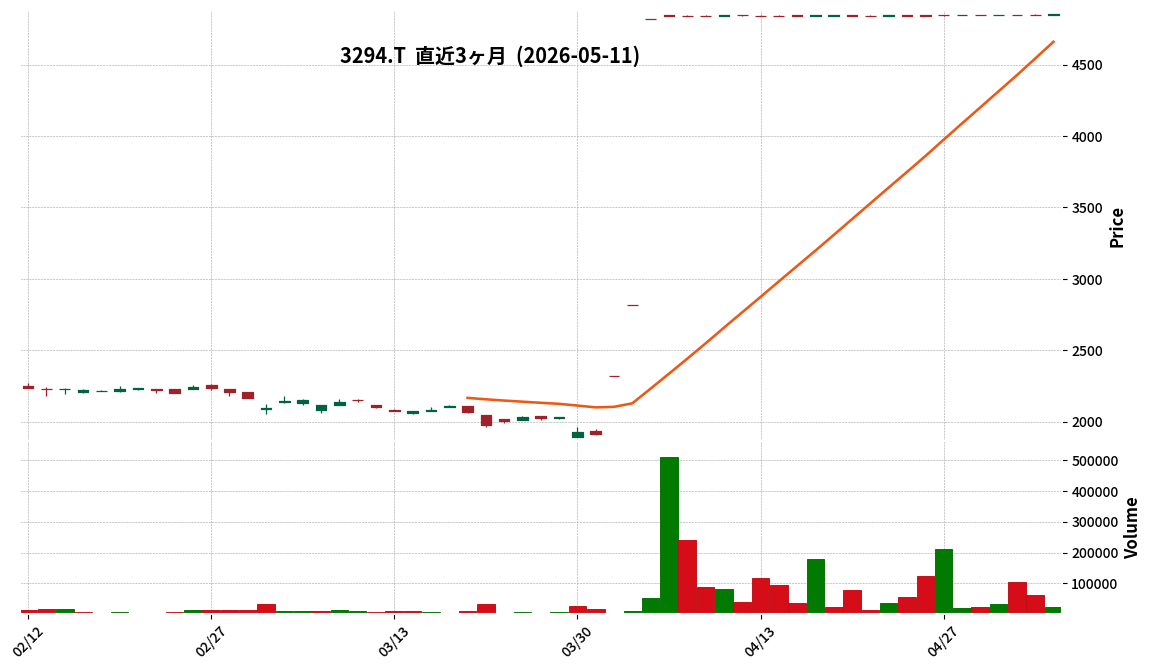
This article is an AI-generated summary and analysis of official IR disclosures.
📄 Announcement (AI-Reviewed)
- E-Grand Co., Ltd. has announced its non-consolidated financial results for the fiscal year ending March 2026.
- The company’s forecast for FY2026 includes sales revenue of ¥17,980 million, operating income of ¥1,480 million, ordinary income of ¥1,470 million, and net profit attributable to owners of parent of ¥1,020 million.
- These FY2026 performance forecasts show no change compared to the actual results of the fiscal year ended March 2025.
- The projected earnings per share (EPS) for FY2026 is ¥86.82, also remaining identical to the FY2025 actual figure.
- The annual dividend forecast for FY2026 has been stated as “undetermined.”
🤖 AI Perspective
The announcement of FY2026 performance forecasts that are unchanged from the previous fiscal year’s actual results may suggest a conservative outlook amidst prevailing market conditions, prompting investors to closely observe any future business strategies or additional disclosures from the company. The “undetermined” status of the annual dividend forecast for FY2026 also represents a point of continued monitoring regarding future financial policy.
3317|フライングG
1563.0
▼ -0.38%
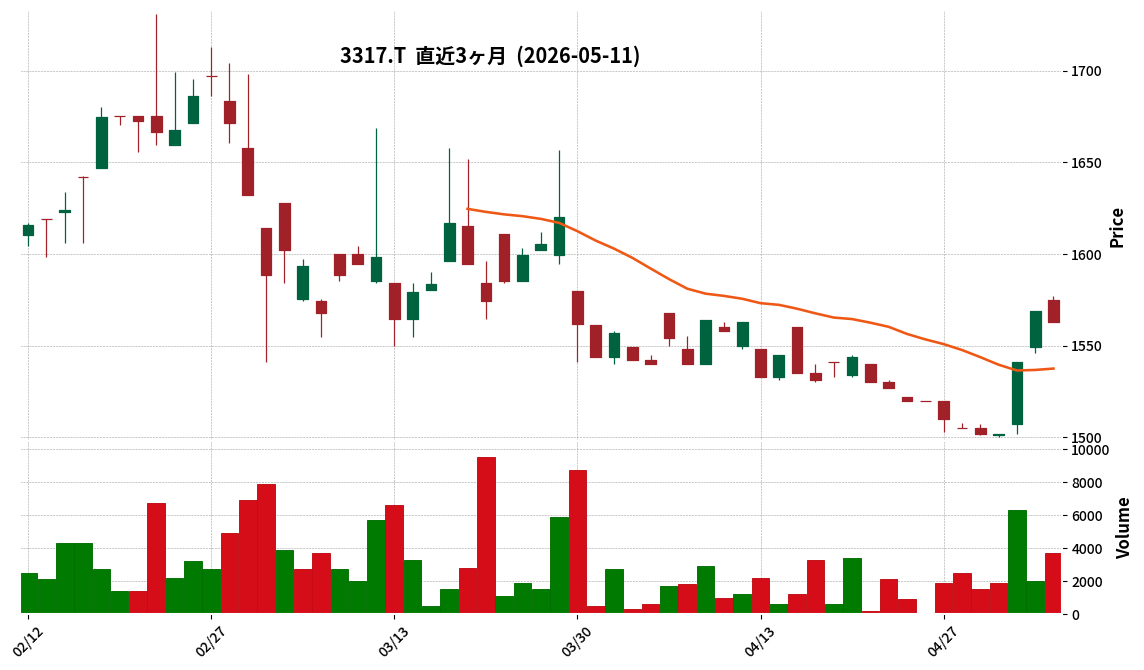
This article is an AI-generated summary and analysis of official IR disclosures.
📄 Announcement (AI-Reviewed)
- Flying Garden Co., Ltd. (Securities Code: 3317) announced on May 11, 2026, that its Board of Directors resolved on the year-end dividend for the fiscal year ended March 31, 2026.
- The decided dividend per share is ¥18.00, consisting of an ordinary dividend of ¥17.00 and a commemorative dividend of ¥1.00.
- This decided amount represents an increase of ¥2.00 from the most recent dividend forecast of ¥16.00 per share, which was announced on August 18, 2025.
- The total dividend amount is ¥52,024 thousand, with an effective date of June 26, 2026.
- The reasons for the dividend include the implementation of a ¥1.00 commemorative dividend per share to mark the company’s 50th anniversary (November 29, 2026).
🤖 AI Perspective
This announcement highlights not only an increase in the year-end dividend for the fiscal year ending March 2026 from the previous forecast but also the implementation of a special dividend to commemorate the company’s 50th anniversary. This move aligns with the company’s stated policy of prioritizing shareholder returns, and it could be perceived as a reflection of business performance and future development prospects.
3970|G-イノベーション
888.0
▼ -1.00%
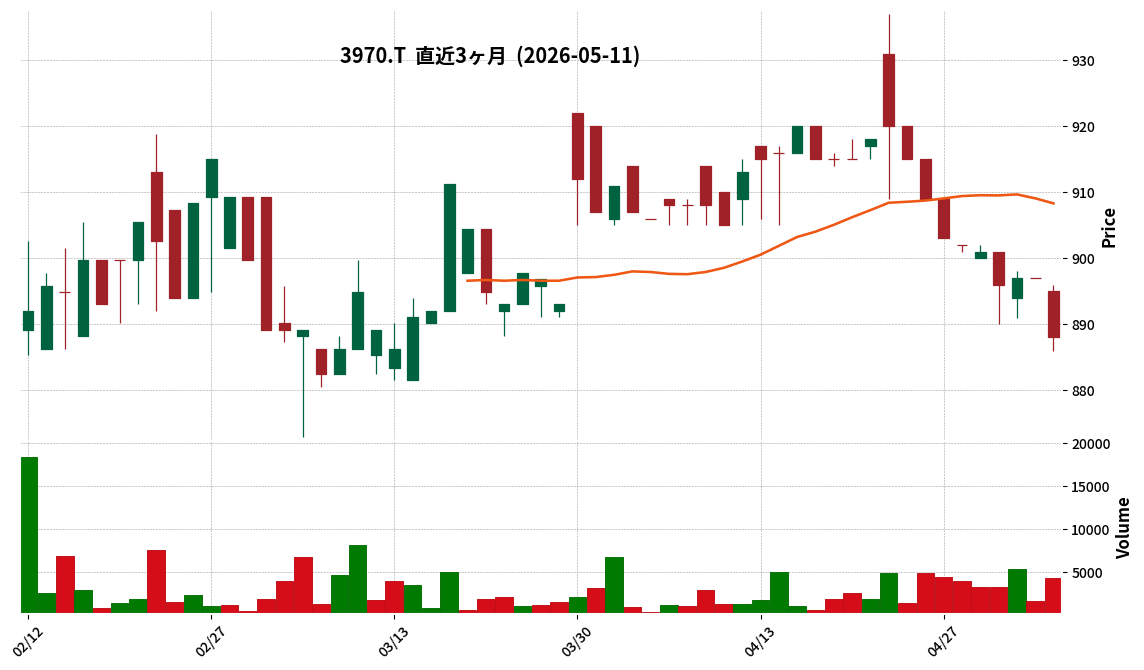
📎 Source:G-イノベーション Official IR →
This article is an AI-generated summary and analysis of official IR disclosures.
📄 Announcement (AI-Reviewed)
- G-Innovation’s consolidated net sales for the fiscal year ended March 2026 reached JPY 6,968 million, marking a 30.4% increase year-over-year.
- The company reported a consolidated operating loss of JPY 248 million and a net loss attributable to parent company shareholders of JPY 457 million.
- The IT Solutions business segment expanded significantly due to the consolidation of Shannon Co., Ltd., accounting for approximately 40% of the consolidated net sales.
- Despite the operating loss, EBITDA, excluding goodwill amortization and depreciation, remained profitable at JPY 205 million.
- As part of its data platform development, the company completed the implementation of Single Sign-On (SSO), enhancing its cross-selling infrastructure.
🤖 AI Perspective
The substantial increase in consolidated net sales is largely attributable to the consolidation of Shannon Co., Ltd. Conversely, the reported operating loss may be influenced by the amortization of goodwill associated with the Shannon acquisition and upfront investments in new business development. The maintenance of positive EBITDA could suggest the underlying operational profitability, exclusive of non-cash expenses. Furthermore, the completion of SSO implementation can be seen as a foundational step for pursuing greater group-wide business synergies moving forward.
4385|メルカリ
3888.0
▼ -3.81%
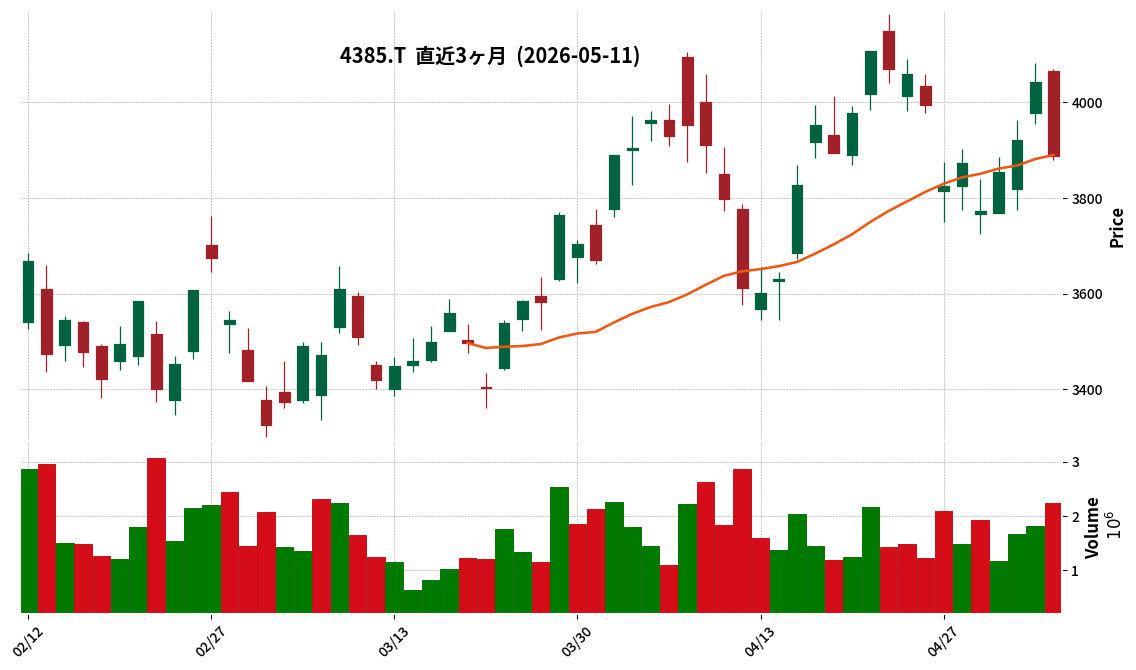
This article is an AI-generated summary and analysis of official IR disclosures.
📄 Announcement (AI-Reviewed)
- Mercari, Inc. reported consolidated results for the third quarter of fiscal year 2026 (July 1, 2025, to March 31, 2026), with revenue of JPY 167,291 million (+16.1% year-on-year), core operating profit of JPY 34,876 million (+74.5% year-on-year), and profit attributable to owners of the parent of JPY 19,431 million (+65.6% year-on-year).
- The full-year consolidated earnings forecast for fiscal year 2026 has been revised upward, with revenue projected to be JPY 220,000 million or more, and core operating profit JPY 40,000 million or more.
- The Japan Business segment achieved revenue of JPY 131,380 million (+17.5% year-on-year) and segment profit of JPY 39,985 million (+52.8% year-on-year). Marketplace GMV grew 11.0% to JPY 939.4 billion, and Fintech’s outstanding receivables increased 45.0% to JPY 328.1 billion.
- The US segment recorded revenue of JPY 30,380 million (+9.2% year-on-year) and segment profit of JPY 1,187 million, improving from a segment loss of JPY 50 million in the prior year.
- As of the end of the third quarter of fiscal year 2026, total assets amounted to JPY 673,763 million, total liabilities to JPY 553,272 million, and total equity to JPY 120,491 million.
🤖 AI Perspective
The significant growth in both revenue and profit, coupled with an upward revision of the full-year forecast, may be a key point of interest for investors. The strong performance in the Japan Business, driven by Marketplace GMV growth and Fintech’s receivables expansion, along with the US segment’s return to profitability, could indicate effective execution of the company’s business strategies. This suggests that Mercari’s diversified growth initiatives are contributing positively to overall profitability, which is worth monitoring.
438A|G-インフキュリオン
890.0
▲ +3.97%
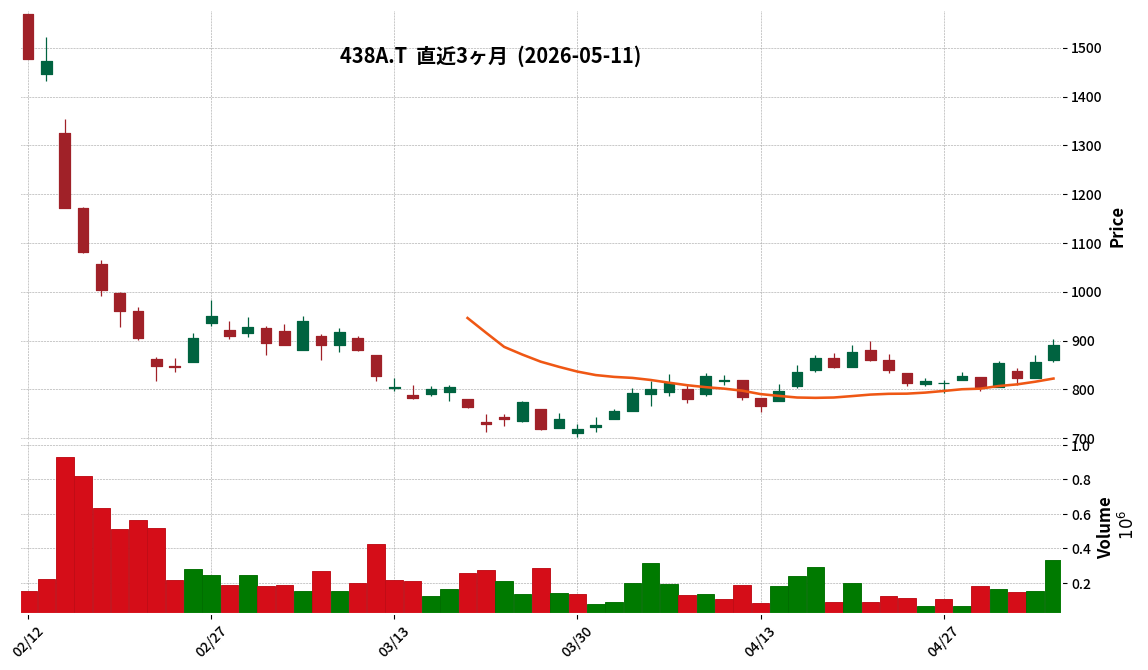
📎 Source:G-インフキュリオン Official IR →
This article is an AI-generated summary and analysis of official IR disclosures.
📄 Announcement (AI-Reviewed)
- Infcurion, Inc. reported full-year results for the fiscal year ended March 2026, with revenue reaching JPY 9,505 million (up 32.5% year-on-year) and gross profit at JPY 4,559 million (up 43.0% year-on-year).
- EBITDA expanded significantly to JPY 560 million, marking an approximate threefold increase (197.4% up year-on-year), surpassing the revised earnings forecast disclosed on February 13, 2026.
- Operating profit was recorded at JPY 440 million (up 207.4% year-on-year), and net profit for the period was JPY 444 million (up 495.0% year-on-year).
- The number of companies utilizing the Payment Platform business’s products exceeded 100,000, representing an increase of over 50% compared to the end of the previous fiscal year.
- BtoB GTV (Gross Transaction Value) doubled year-on-year to JPY 447.3 billion.
🤖 AI Perspective
The full-year results for FY2026/3 demonstrate significant growth across revenue and profit metrics, exceeding the revised forecasts. The substantial increase in BtoB GTV and the growing number of user companies may suggest an accelerating market penetration for the company’s payment platform business. The accumulation of recurring revenue and the contribution from payment terminal installations in the mobility sector appear to be driving performance, indicating a diversified growth foundation.
4553|東和薬品
3880.0
▼ -0.77%
This article is an AI-generated summary and analysis of official IR disclosures.
📄 Announcement (AI-Reviewed)
- Towa Pharmaceutical will record an impairment loss of JPY 14.7 billion on goodwill related to its consolidated subsidiary, Sansei Pharmaceutical Co., Ltd., in its consolidated financial results for the fiscal year ending March 2026.
- Concurrently, a valuation loss on equity of JPY 26.1 billion for Sansei Pharmaceutical shares will be recognized as an extraordinary loss in Towa Pharmaceutical’s non-consolidated financial results. This loss will not impact consolidated results.
- The full-year consolidated earnings forecast for the fiscal year ending March 2026 has been revised, with net sales now projected at JPY 273.7 billion (a 2.3% decrease from the previous forecast) and operating profit at JPY 23.1 billion (a 14.4% decrease).
- Net profit attributable to owners of the parent is expected to be JPY 5.2 billion, representing a significant 70.6% decrease from the previous forecast of JPY 17.7 billion, largely due to the aforementioned impairment loss.
- Ordinary profit is revised upwards to JPY 28.0 billion (a 10.7% increase from the previous forecast), despite the decrease in operating profit, primarily due to the recognition of derivative valuation gains.
🤖 AI Perspective
- This earnings forecast revision appears to be primarily driven by a decline in profitability and worsening overseas competitive environment at subsidiary Sansei Pharmaceutical, along with delayed synergy creation with Towa Pharmaceutical.
- Investors may focus on the distinct impacts of the impairment loss on consolidated results and the equity valuation loss on non-consolidated results, given their different scopes.
- While the substantial reduction in net profit attributable to owners of the parent is a key point, the upward revision of ordinary profit due to derivative valuation gains could indicate a shift in the company’s profit structure.
4568|第一三共
2649.0
▲ +2.04%
This article is an AI-generated summary and analysis of official IR disclosures.
📄 Announcement (AI-Reviewed)
- Consolidated revenue for the fiscal year ended March 31, 2026, increased by 12.6% year-on-year to JPY 2,123,045 million.
- Core operating profit rose by 15.1% to JPY 359,962 million. However, consolidated operating profit decreased by 31.0% to JPY 229,089 million, and profit attributable to owners of the parent decreased by 12.1% to JPY 259,874 million.
- Sales growth of global key products such as Enhertu (trastuzumab deruxtecan) and Dato-DXd (datopotamab deruxtecan) contributed to the increase in revenue.
- The annual dividend per share was JPY 78 (JPY 39 for interim, JPY 39 for year-end), an increase from JPY 60 in the previous fiscal year.
- For the fiscal year ending March 31, 2027, the company forecasts consolidated revenue of JPY 2,280,000 million (up 7.4% year-on-year) and profit attributable to owners of the parent of JPY 260,000 million (up 0.0% year-on-year), with an expected annual dividend of JPY 100 per share.
🤖 AI Perspective
The results for the fiscal year ended March 31, 2026, show a rise in revenue and core operating profit, but a decline in operating profit and profit attributable to owners of the parent. This could be attributed to significant one-time expenses incurred during the period. The strong performance of global key products, coupled with an optimistic outlook for the next fiscal year and a projected increase in annual dividend to JPY 100, may suggest a focus on sustained growth and enhanced shareholder returns.
4627|ナトコ
1625.0
▲ +1.06%
This article is an AI-generated summary and analysis of official IR disclosures.
📄 Announcement (AI-Reviewed)
- Natoco Co., Ltd. resolved to acquire all shares of Toupe Co., Ltd. from Zeon Corporation, making Toupe a wholly-owned subsidiary, as decided at its Board of Directors meeting on May 11, 2026.
- The acquisition involves 30,801,738 shares, representing 100% of voting rights, at a price of JPY 2.19 billion. This price includes a transfer price adjustment clause, which may lead to future fluctuations.
- The acquisition aims to expand Natoco Group’s paint business domain and rebuild its product supply system, specifically addressing challenges at the aging Miyoshi Head Office plant and utilizing Toupe’s extensive factory sites in Mie and Ibaraki prefectures.
- Toupe Co., Ltd., founded in 1915, is a comprehensive paint manufacturer dealing with a wide range of products including architectural, building material, leather, road, and anticorrosive paints. Its acrylic rubber business is excluded from the transfer and will be spun off.
- The scheduled execution date for the share transfer is November 2, 2026.
🤖 AI Perspective
This acquisition appears to be a strategic move for Natoco to address its existing production system challenges while simultaneously expanding its business scale. By leveraging Toupe’s factory sites and diverse product portfolio, Natoco may seek to improve production efficiency and explore new market opportunities. The realization of synergy effects post-acquisition and the integration process will be key aspects for investors to monitor going forward.
6632|JVCKW
1127.0
▲ +2.83%
This article is an AI-generated summary and analysis of official IR disclosures.
📄 Announcement (AI-Reviewed)
- JVCKENWOOD Corporation announced a partial correction to its “JVCKENWOOD Financial Results Briefing Materials for the Fiscal Year Ended March 31, 2026 (IFRS)” on May 11, 2026.
- The reason for the correction was the discovery of an error in a part of the stated content.
- The subject of this correction is the “FY2026 March ROA value” specified in the table on slide 34 of the aforementioned financial results briefing materials.
- The ROA value for the fiscal year ended March 31, 2026 (IFRS) was changed from 4.8% before correction to 5.1% after correction.
- According to the financial highlights within the correction document, the consolidated financial results for the fiscal year ended March 31, 2026, showed a decrease in both revenue and profit year-on-year.
🤖 AI Perspective
- For investors, the upward revision of the Return on Assets (ROA) figure, which indicates a company’s efficiency in utilizing its assets, may draw attention.
- This change from 4.8% to 5.1% could suggest a slightly improved return on assets for the fiscal year ended March 31, 2026, compared to what was initially reported.
- Such corrections are noteworthy factors to consider when analyzing a company’s financial health and profitability.
2811|カゴメ
2562.0
▲ +0.20%
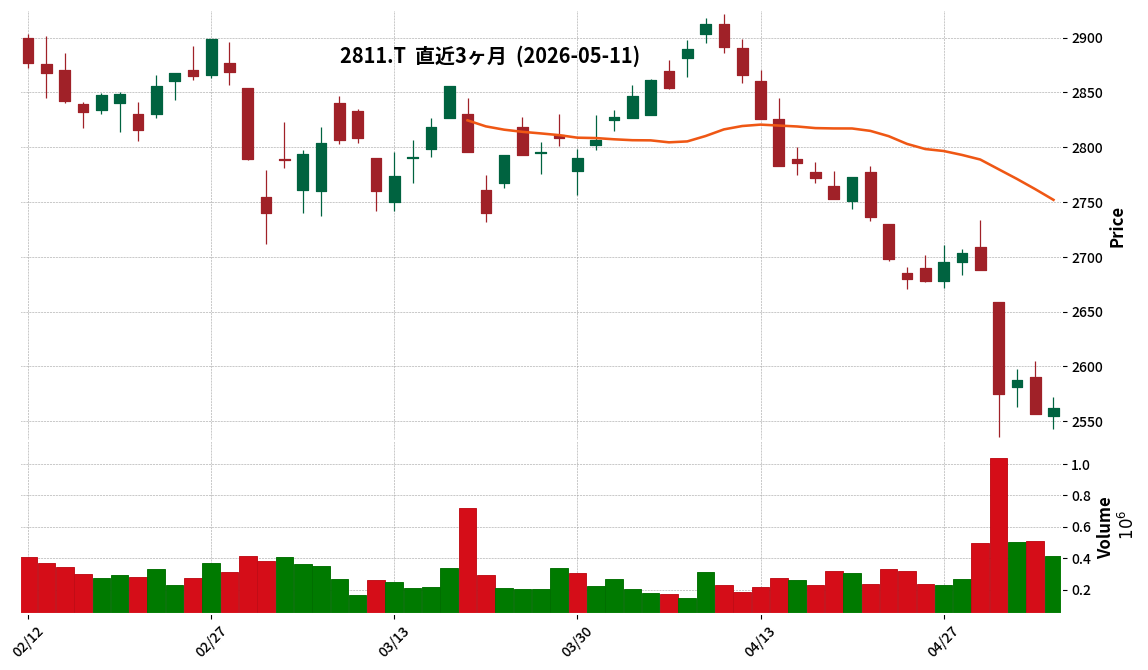
This article is an AI-generated summary and analysis of official IR disclosures.
📄 Announcement (AI-Reviewed)
- Kagome announced on May 11, 2026, that the interim review by the audit firm for its Q1 FY2026 consolidated financial results (IFRS) has been completed. The previously disclosed quarterly consolidated financial statements on April 30, 2026, remain unchanged.
- For the first quarter ended March 31, 2026, consolidated revenue increased by 0.6% year-on-year to JPY 67,564 million.
- During the same period, business profit decreased by 25.8% to JPY 3,438 million, and profit attributable to owners of the parent declined by 26.9% to JPY 2,055 million.
- The company has early adopted IFRS 18 “Presentation and Disclosure in Financial Statements” from the current consolidated fiscal year, with relevant figures for the prior period retrospectively adjusted.
- The full-year FY2026 consolidated earnings forecast projects revenue of JPY 310,000 million (up 5.3% year-on-year) and profit attributable to owners of the parent of JPY 13,400 million (down 9.5% year-on-year), with no revisions from the latest public announcement.
🤖 AI Perspective
While revenue showed a slight increase, the significant decline in profits may reflect challenges such as rising raw material costs and increased selling expenses in domestic operations, alongside international market fluctuations impacting the international business. The early adoption of IFRS 18 signifies a change in accounting policy, suggesting that investors should consider this when comparing current results with past financial data. With the full-year forecast maintained, the company’s strategies to mitigate these pressures and achieve its annual targets will be a key area for observation.
4062|イビデン
15655.0
▲ +0.90%
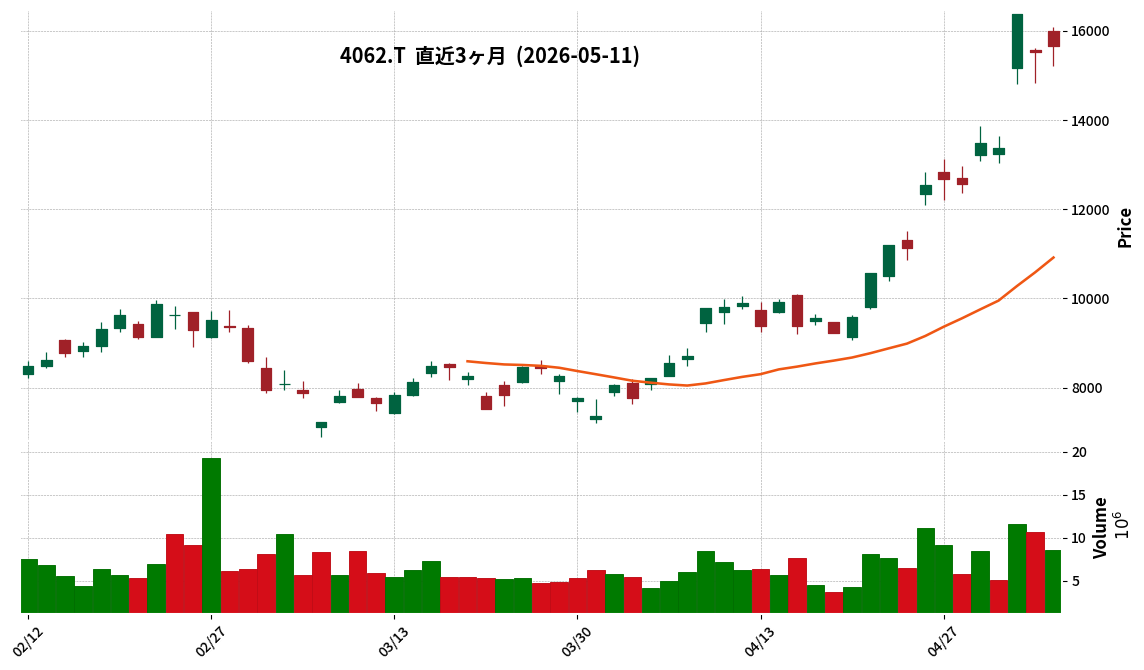
This article is an AI-generated summary and analysis of official IR disclosures.
📄 Announcement (AI-Reviewed)
- Ibiden Co., Ltd. announced on May 11, 2026, a revision (increase) to its year-end dividend forecast for the fiscal year ending March 2026.
- The year-end dividend forecast has been revised upwards by JPY 5.00, from the previously projected JPY 10.00 per share to JPY 15.00 per share.
- Consequently, the full-year dividend forecast has been revised from JPY 25.00 to JPY 30.00 per share.
- This revision is based on the company’s policy of progressive dividends, targeting a dividend payout ratio of 20% and a base annual dividend of JPY 20.00 per share from the fiscal year ending March 2026 to March 2031, following a comprehensive consideration of the current fiscal year’s performance.
- This matter is scheduled to be decided at a Board of Directors meeting planned for May 19, 2026.
- A 1-for-2 stock split was conducted on January 1, 2026, and the per-share dividend figures are presented after adjustment for this split.
🤖 AI Perspective
This dividend increase announcement may suggest the company’s confidence in its current performance and its commitment to the progressive dividend policy outlined through the fiscal year ending March 2031. For investors, the consistency of this dividend policy alongside the company’s future earnings trajectory could be a key point of interest.
4884|G-クリングル
466.0
▲ +1.08%
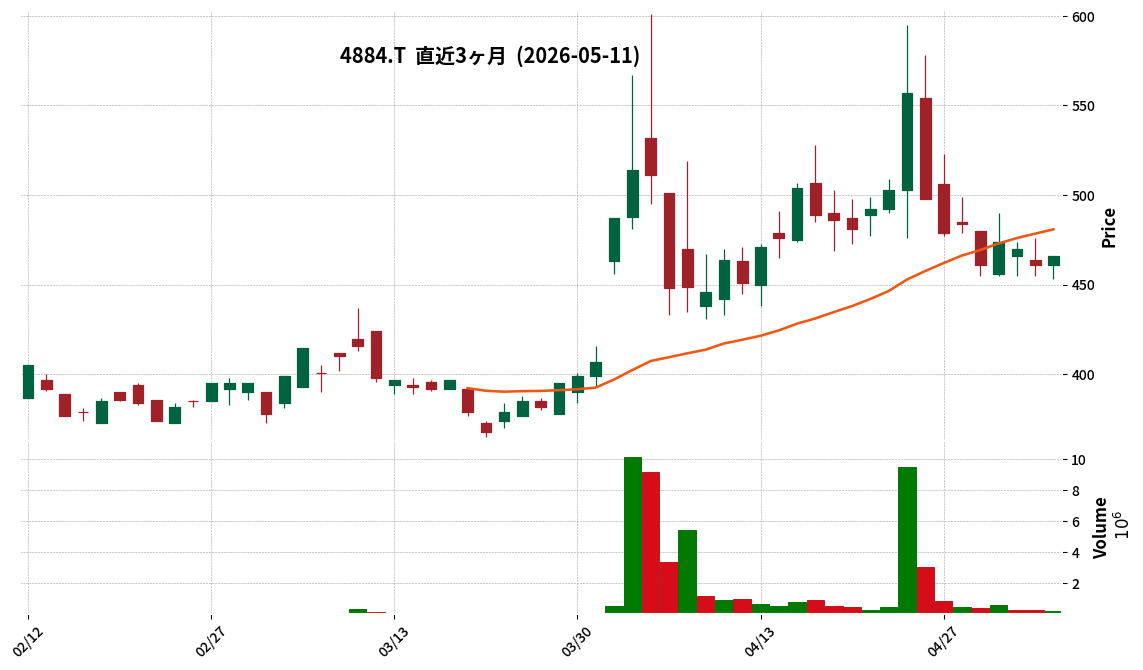
📎 Source:G-クリングル Official IR →
This article is an AI-generated summary and analysis of official IR disclosures.
📄 Announcement (AI-Reviewed)
- For the second quarter of the fiscal year ending September 2026, sales reached JPY 36 million (up 2.2% year-on-year), but the company reported an operating loss of JPY 515 million, an ordinary loss of JPY 513 million, and a net loss of JPY 516 million.
- As of the end of the interim period, total assets stood at JPY 1,988 million, net assets at JPY 947 million, and the equity ratio was 45.9%.
- Regarding “KP-100,” a drug candidate for acute spinal cord injury under development in Japan, the company decided in July 2025 to conduct additional clinical trials to verify its efficacy, following discussions with the PMDA.
- “KP-100” also received Orphan Drug Designation from the U.S. Food and Drug Administration (FDA) in June 2025, and Kringle Pharma USA, Inc. was established in November 2025.
- The company’s full-year dividend forecast for the fiscal year ending September 2026 remains JPY 0.00, with no interim dividend planned.
🤖 AI Perspective
While sales showed a slight increase, the company continues to report losses, which is characteristic of a research and development-driven business. The decision to conduct additional clinical trials in Japan, coupled with the Orphan Drug Designation from the FDA and the establishment of a U.S. subsidiary, may indicate strategic moves towards future commercialization of its pipeline. However, the decrease in total assets, net assets, and the equity ratio could suggest that the securing of future development funds is a point worth monitoring.
4960|ケミプロ化成
688.0
▼ -3.78%
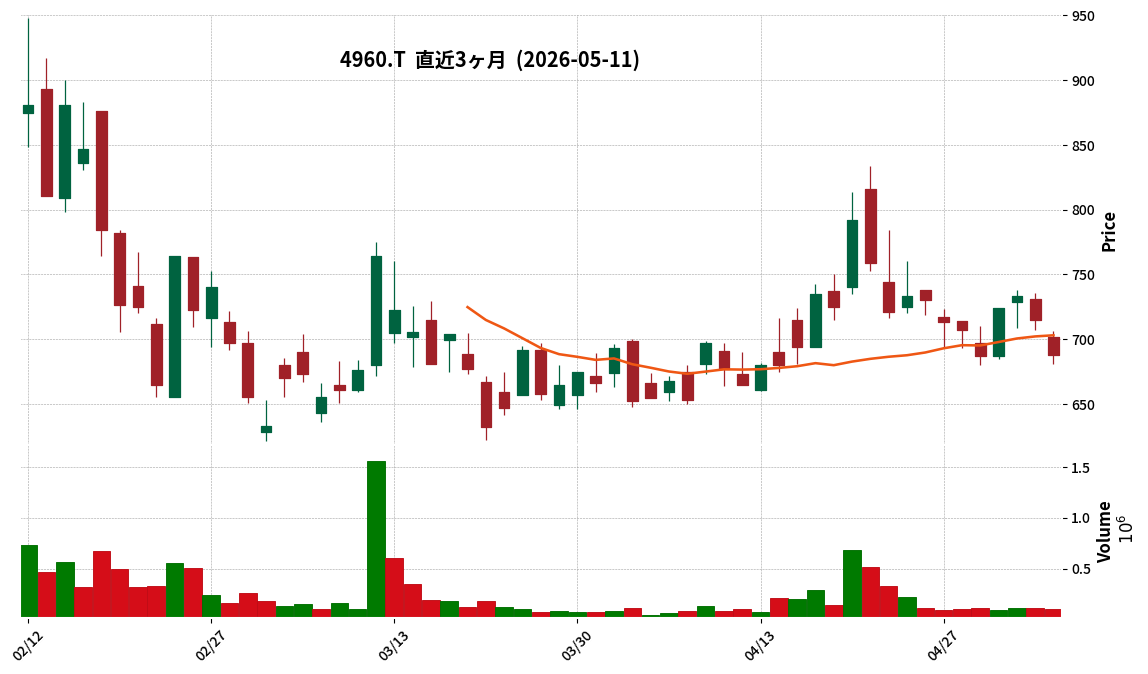
This article is an AI-generated summary and analysis of official IR disclosures.
📄 Announcement (AI-Reviewed)
- Chemipro Kasei announced its non-consolidated financial results for the fiscal year ended March 2026. Sales were ¥8,946 million (down 7.9% year-on-year), operating profit was ¥341 million (down 15.1%), and ordinary profit was ¥128 million (down 26.1%).
- Net profit for the period surged by 130.0% year-on-year to ¥294 million, primarily due to the recognition of extraordinary gains, including ¥265 million from the sale of investment securities and ¥41 million from insurance cancellation refunds.
- The annual dividend for the fiscal year ended March 2026 was ¥5.00 per share, an increase from ¥3.50 in the prior fiscal year. The dividend payout ratio was 27.3%.
- As of the end of the fiscal year, total assets stood at ¥12,817 million, net assets at ¥4,999 million, and the equity ratio improved to 39.0% from 35.9% at the end of the previous fiscal year.
- The company has not yet determined its earnings forecast for the fiscal year ending March 2027, stating that it will be disclosed promptly once available.
🤖 AI Perspective
While sales and operating/ordinary profits saw a year-on-year decline, the substantial increase in net profit for the period appears to be largely driven by the recognition of extraordinary gains. The improvement in the equity ratio and the dividend increase could be viewed as indicators of the company’s financial stability and commitment to shareholder returns. The disclosure of the next fiscal year’s earnings forecast will likely be a key focus for investors.
9664|御園座
—
▲ +0.00%
This article is an AI-generated summary and analysis of official IR disclosures.
📄 Announcement (AI-Reviewed)
- Misonoza Co., Ltd. reported net sales of JPY 3,217 million for the fiscal year ended March 31, 2025 (FY2025), marking a 27.1% increase compared to the previous fiscal year.
- During the same period, the company achieved an operating profit of JPY 238 million (compared to an operating loss of JPY 76 million in the prior year), an ordinary profit of JPY 231 million (compared to an ordinary loss of JPY 83 million), and a net profit of JPY 202 million (compared to a net loss of JPY 85 million), indicating a return to profitability across all key metrics.
- As of March 31, 2025, total assets amounted to JPY 5,952 million, net assets to JPY 4,707 million, and the equity ratio improved to 79.1% (an increase of 1.4 percentage points from the previous fiscal year-end).
- Cash flows from operating activities turned positive at JPY 729 million (compared to a negative JPY 79 million in the prior year), resulting in an increase of cash and cash equivalents to JPY 1,314 million at the fiscal year-end.
- For the fiscal year ending March 31, 2026 (FY2026), the company forecasts net sales of JPY 2,800 million (down 13.0% year-over-year), an operating profit of JPY 80 million (down 66.4%), an ordinary profit of JPY 70 million (down 69.7%), and a net profit of JPY 65 million (down 67.8%).
🤖 AI Perspective
Misonoza’s FY2025 results indicate a significant operational recovery, with strong revenue growth and a return to profitability across all major earnings categories, which may suggest the effectiveness of their theater operations and efforts to increase audience attendance. However, the forecast for FY2026 projects a decline in both revenue and profits, indicating that future performance could be influenced by upcoming programming schedules and the broader market environment. The improvement in the equity ratio suggests a strengthening financial position, contributing to a stable management foundation.
208A|構造計画HD
3025.0
▲ +4.67%
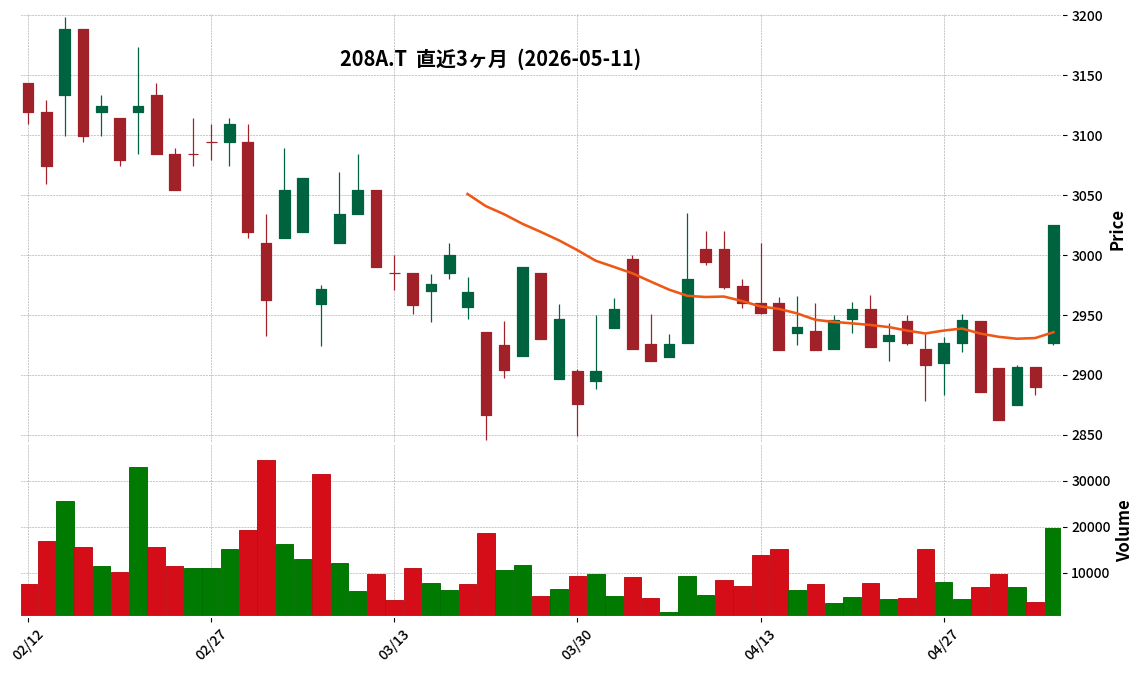
This article is an AI-generated summary and analysis of official IR disclosures.
📄 Announcement (AI-Reviewed)
- Kozo Keikaku Engineering Holdings Co., Ltd. (KKE-HD) announced its consolidated financial results for the third quarter of the fiscal year ending June 2026 (July 1, 2025 – March 31, 2026) on May 11, 2026.
- For the cumulative third quarter, net sales increased by 15.3% year-on-year to ¥16,453 million. Operating profit surged by 46.6% to ¥2,127 million, ordinary profit rose by 48.9% to ¥2,110 million, and net profit attributable to owners of parent grew by 56.6% to ¥1,364 million.
- Diluted earnings per share for the quarter were ¥129.19.
- The company maintained its full-year consolidated earnings forecast, projecting net sales of ¥22,500 million, operating profit of ¥3,400 million, ordinary profit of ¥3,350 million, and net profit attributable to owners of parent of ¥2,300 million.
- The sales progress rate against the full-year forecast stood at 73.1% at the end of the third quarter.
- The annual dividend forecast remains unchanged at ¥90.00 per share.
🤖 AI Perspective
- KKE-HD reported robust performance in Q3 FY2026, with significant year-on-year increases across sales and all profit metrics, suggesting strong operational execution.
- The Engineering Consulting and Products Service segments appear to be key drivers of this growth.
- A sales progress rate of 73.1% against the full-year forecast by the end of the third quarter indicates that the company is on a solid path towards achieving its annual targets.
2902|太陽化
—
▲ +0.00%
This article is an AI-generated summary and analysis of official IR disclosures.
📄 Announcement (AI-Reviewed)
- Taiyo Kagaku Co., Ltd. announced its consolidated financial results for the fiscal year ended March 31, 2026 (April 1, 2025 – March 31, 2026).
- For the period, consolidated net sales increased by 4.9% year-on-year to ¥52,484 million, operating income rose by 13.9% to ¥7,078 million, ordinary income grew by 19.0% to ¥7,823 million, and profit attributable to owners of parent increased by 12.8% to ¥5,215 million, marking both increased revenue and profit.
- The annual dividend per share for FY2026/3 was ¥109, an increase of ¥27 from ¥82 in the previous fiscal year.
- By segment, the Nutrition business significantly contributed with sales of ¥17,146 million (up 13.6% year-on-year) and operating income of ¥3,756 million (up 27.7% year-on-year).
- For the full-year consolidated outlook for FY2027/3, the company forecasts net sales of ¥55,000 million (up 4.8% year-on-year) but anticipates a decrease in profits, with operating income at ¥7,000 million (down 1.1%), ordinary income at ¥7,200 million (down 8.0%), and profit attributable to owners of parent at ¥4,800 million (down 8.0%).
🤖 AI Perspective
Taiyo Kagaku’s FY2026/3 results show a solid increase in both revenue and profits, primarily driven by the strong performance of its Nutrition business segment. However, the company’s forecast for FY2027/3, projecting increased revenue but decreased profits, may suggest potential challenges in maintaining profitability margins moving forward, which could be a key area for investors to monitor. The rise in dividend payout ratio from 30.0% to 35.2% indicates a continued commitment to shareholder returns.
3276|JPMC
1290.0
▲ +0.70%
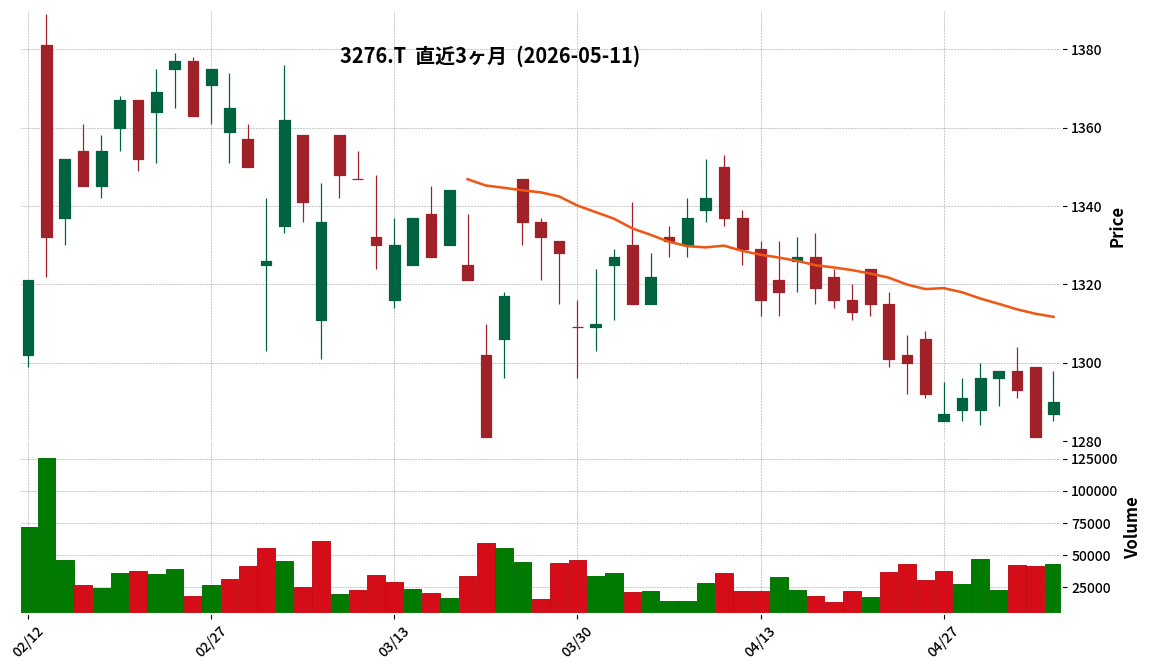
This article is an AI-generated summary and analysis of official IR disclosures.
📄 Announcement (AI-Reviewed)
- For the first quarter of the fiscal year ending December 2026 (January 1 to March 31, 2026), JPMC reported consolidated net sales of ¥14,947 million (up 3.3% year-on-year), operating profit of ¥832 million (up 16.3%), ordinary profit of ¥841 million (up 17.1%), and net profit attributable to owners of the parent of ¥575 million (up 11.7%).
- The number of managed properties increased by 415 units from the end of the previous fiscal year, reaching a total of 108,337 units.
- Revenue by segment included Property Management income of ¥13,732 million (up 2.7% year-on-year), PM Ancillary Business income of ¥713 million (up 2.5%), and Other income of ¥502 million (up 27.2%).
- As of March 31, 2026, consolidated total assets were ¥17,116 million (down ¥317 million from the end of the previous fiscal year), net assets were ¥9,312 million (up ¥56 million), and the equity ratio was 54.4%.
- There are no revisions to the consolidated earnings forecast for the fiscal year ending December 2026, nor to the annual dividend forecast of ¥64.00 per share, from the most recently announced figures.
🤖 AI Perspective
JPMC achieved year-on-year increases in net sales and all profit categories in the first quarter of fiscal year 2026. This growth appears to be supported by the net increase in managed properties, robust increases in property management and PM ancillary business income, and a significant rise in other income. With no revisions to the full-year consolidated earnings forecast, it suggests that the company views its Q1 performance as proceeding according to plan.
3762|テクマト
1811.0
▼ -0.22%
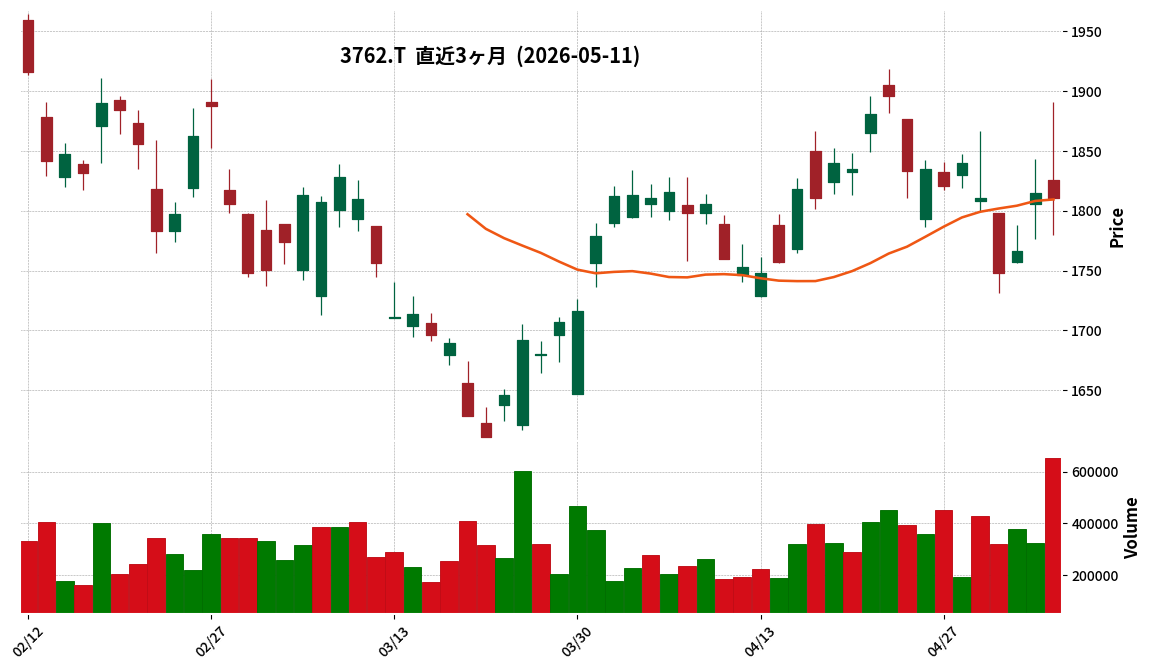
This article is an AI-generated summary and analysis of official IR disclosures.
📄 Announcement (AI-Reviewed)
- TechMatrix Corporation announced on May 11, 2026, corrections to its “FY42 Full-Year Financial Results Supplementary Material” that was originally published on May 8, 2026.
- The corrections primarily consist of three points. First, Slide P.1 was deleted as it was not intended for initial publication.
- Second, certain phrases were removed from pages P.4, P.7, P.8, and P.9 because they were deemed unnecessary. These removals include descriptions related to “revision of retirement benefit logic (adjustment for difference from previous period’s booking) Operating income: ▲50 million yen” and “lump-sum correction of omitted sales for FY40 and FY41.”
- Third, numerical errors found on page P.29, specifically concerning the PACS contracted facilities trend in the Medical Systems business, were corrected. The revised figures for FY2025 show on-premise facilities at 1,531 (previously 1,530), cloud facilities at 2,534 (previously 2,533), and total contracted facilities at 4,065 (previously 4,063).
- The corrected supplementary material is attached to the announcement.
🤖 AI Perspective
- This correction revises the content of the recently disclosed full-year financial results supplementary material, likely aiming to rectify discrepancies or inaccuracies from the original publication.
- Investors may note that the removals of operating profit-related descriptions and the specific numerical adjustments for contracted facilities in the Medical Systems business are details worth monitoring when evaluating the company’s performance.
- Such rectifications could be interpreted as part of the company’s ongoing efforts to ensure the accuracy and reliability of its disclosed information to the market.
4366|ダイトーケミックス
454.0
▲ +7.33%
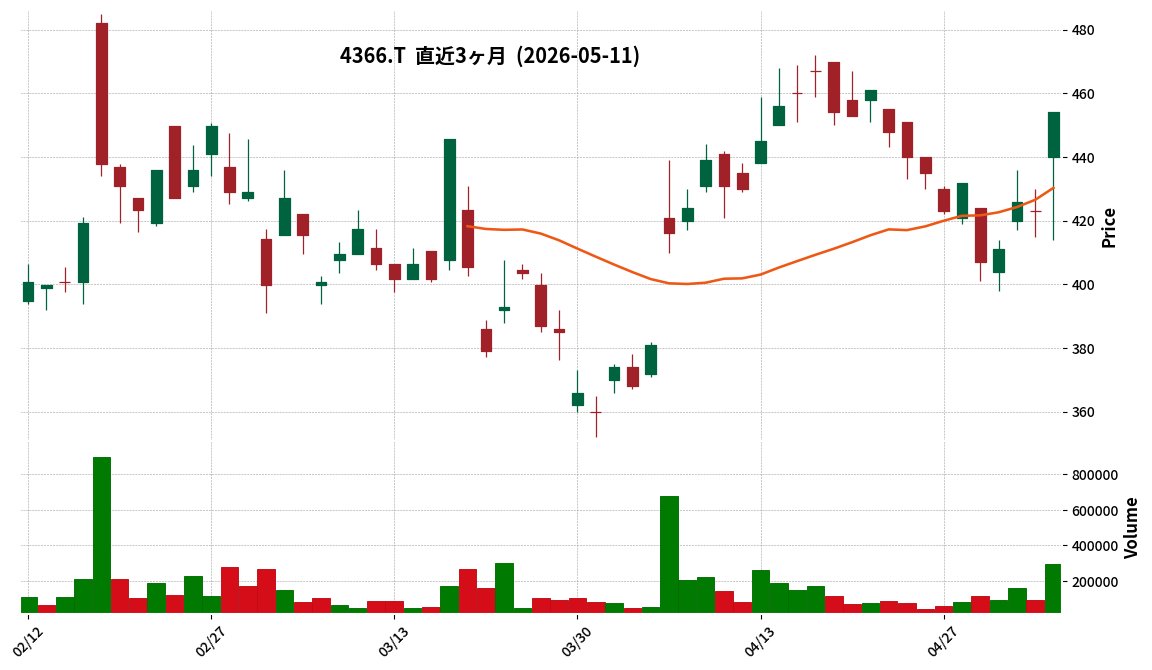
📎 Source:ダイトーケミックス Official IR →
This article is an AI-generated summary and analysis of official IR disclosures.
📄 Announcement (AI-Reviewed)
- Daito Chemix has announced its consolidated financial results for the fiscal year ended March 31, 2026.
- For the period (April 1, 2025 – March 31, 2026), consolidated net sales reached ¥19,476 million, a 4.5% increase year-on-year. Operating profit was ¥872 million, up 2.9%, and ordinary profit was ¥894 million, a 9.1% increase, indicating growth in both revenue and profit.
- Net income attributable to owners of parent for the period was ¥791 million, a decrease of 3.5% from the previous fiscal year.
- The annual dividend per share for the fiscal year ended March 31, 2026, is set at ¥8.00.
- For the fiscal year ending March 31, 2027, the company forecasts consolidated net sales of ¥20,400 million (a 4.7% increase), operating profit of ¥1,150 million (a 31.8% increase), and net income attributable to owners of parent of ¥850 million (a 7.4% increase).
- The projected annual dividend per share for the fiscal year ending March 31, 2027, is ¥9.00.
🤖 AI Perspective
Daito Chemix’s fiscal year 2026 results show growth in sales and operating profit, but a decline in net income attributable to owners of parent. This may suggest that while core business performance was robust, other non-operating factors could have impacted the final net profit figure. The company’s forecast for the upcoming fiscal year anticipates growth across all key metrics, with a notable projected increase in operating profit, which could be a significant point of interest for investors. The dividend, after a decrease this period, is expected to increase in the next fiscal year, an aspect worth monitoring in conjunction with future business strategies and market conditions.
6023|ダイハツインフィ
3360.0
▼ -1.03%
📎 Source:ダイハツインフィ Official IR →
This article is an AI-generated summary and analysis of official IR disclosures.
📄 Announcement (AI-Reviewed)
- Daihatsu Infinia Earth Corporation announced a correction to its “Consolidated Financial Results for the Fiscal Year Ended March 31, 2026 (Japanese GAAP) (Consolidated),” originally released on May 8, 2026.
- The correction involves the addition of information regarding the “Cancellation of Treasury Stock” in the “Significant Subsequent Events” section on page 15 of the attached materials.
- The company resolved to cancel 4,500,000 shares of its common stock, based on Article 178 of the Companies Act, at a Board of Directors meeting held on May 8, 2026.
- The scheduled cancellation date for these treasury shares is May 29, 2026.
- After the cancellation of treasury stock, the total number of outstanding shares will be 27,350,000 shares.
🤖 AI Perspective
This correction formally discloses Daihatsu Infinia Earth Corporation’s decision to cancel treasury stock as a significant subsequent event. The cancellation of treasury stock is generally viewed as a measure that could improve per-share metrics such as Earnings Per Share (EPS) and Book Value Per Share (BPS) by reducing the total number of outstanding shares. Investors may consider monitoring the potential implications of this decision on the company’s capital efficiency and future shareholder returns.
7537|丸文
1246.0
▲ +1.88%
This article is an AI-generated summary and analysis of official IR disclosures.
📄 Announcement (AI-Reviewed)
- Marubun’s consolidated net sales for the fiscal year ended March 31, 2026, totaled ¥213,425 million, marking a 1.2% increase year-on-year.
- However, operating profit decreased by 15.2% to ¥7,763 million, ordinary profit by 35.5% to ¥4,218 million, and net profit attributable to owners of the parent by 25.1% to ¥3,303 million.
- Diluted earnings per share were ¥126.11, and the annual dividend per share for FY2026 was ¥50.00 (interim ¥25.00, year-end ¥25.00).
- The consolidated financial position at March 31, 2026, showed total assets of ¥145,001 million, net assets of ¥62,790 million, and an equity ratio of 39.2%.
- For the fiscal year ending March 31, 2027, Marubun forecasts consolidated net sales of ¥225,000 million (+5.4% year-on-year), operating profit of ¥7,800 million (+0.5% year-on-year), and net profit attributable to owners of the parent of ¥4,000 million (+21.1% year-on-year). An annual dividend of ¥77.00 per share is planned.
🤖 AI Perspective
For FY2026, while net sales increased, all profit figures saw a decline, which could be attributed to challenging market conditions in certain electronics sectors or rising material costs. However, the company’s forecast for FY2027 projects a recovery in both sales and profits, with a notable double-digit increase anticipated for ordinary and net profits. The planned significant increase in the annual dividend for FY2027 may also indicate a positive outlook on future performance and commitment to shareholder returns.
7846|パイロット
4808.0
▲ +1.22%
This article is an AI-generated summary and analysis of official IR disclosures.
📄 Announcement (AI-Reviewed)
- PILOT Corporation announced its consolidated financial results for the first quarter of the fiscal year ending December 2026 (January 1, 2026, to March 31, 2026).
- Consolidated net sales were ¥31,526 million (up 8.3% year-on-year), operating profit was ¥4,154 million (down 10.4% year-on-year), ordinary profit was ¥4,582 million (up 12.0% year-on-year), and net profit attributable to owners of parent was ¥2,677 million (up 44.2% year-on-year).
- Sales in the domestic market amounted to ¥7,581 million (up 4.5% year-on-year), while overseas market sales reached ¥23,944 million (up 9.5% year-on-year).
- The full-year consolidated earnings forecast remains unchanged from the most recently announced forecast, with projected net sales of ¥133,000 million, operating profit of ¥18,000 million, ordinary profit of ¥18,500 million, and net profit attributable to owners of parent of ¥14,000 million.
- A 1-for-3 stock split of common shares is scheduled to take effect on July 1, 2026. Consequently, the forecast for the fiscal year ending December 2026 includes a year-end dividend of ¥21.00 (total annual dividend of ¥21.00) and earnings per share of ¥131.80 (before the stock split, these figures would be a year-end dividend of ¥63.00, total annual dividend of ¥126.00, and EPS of ¥395.41).
🤖 AI Perspective
The first quarter saw an increase in net sales and a significant rise in net profit attributable to owners of parent. Despite a decrease in operating profit, the growth in ordinary profit and net profit suggests that factors such as foreign exchange rates may have had a positive impact on overall profitability. The unchanged full-year earnings forecast indicates the company’s current confidence in its annual outlook. The upcoming 1-for-3 stock split and the corresponding adjusted per-share figures for dividends and earnings are notable, as they could influence market liquidity and the accessibility of shares for investors.
8518|アジア投資
148.0
▼ -1.99%
This article is an AI-generated summary and analysis of official IR disclosures.
📄 Announcement (AI-Reviewed)
- Nippon Asia Investment completed the subsidiarization of KIC Holdings Co., Ltd. by acquiring 60% of its outstanding shares as of March 31, 2026.
- Initially, the company expected to record approximately 130 million yen in consolidated financial results for the fiscal year ended March 2026 as a gain from step acquisition related to KIC Holdings’ subsidiarization.
- Following the completion of accounting review for a fund operated by a KIC Holdings subsidiary, an additional gain from step acquisition of approximately 240 million yen is now expected to be recognized in consolidated financial results, in addition to the initial 130 million yen.
- Consequently, the total gain from step acquisition expected to be recorded in the consolidated financial results for the fiscal year ended March 2026 is approximately 370 million yen.
- The additional 240 million yen, being fund-related, will not be recorded in financial statements under the “Traditional Consolidated Basis,” where the gain from step acquisition remains approximately 130 million yen.
🤖 AI Perspective
The announced increase in special gains resulting from the KIC Holdings subsidiarization may positively impact Nippon Asia Investment’s consolidated net income for the period. Investors may note the difference in reported gains between the current consolidated standards and the “Traditional Consolidated Basis,” which stems from the nature of the additional gain being fund-related. This development could be seen as an advancement in the company’s investment activities within growth sectors like logistics and data center facilities.
5016|JX金属
5720.0
▲ +5.61%
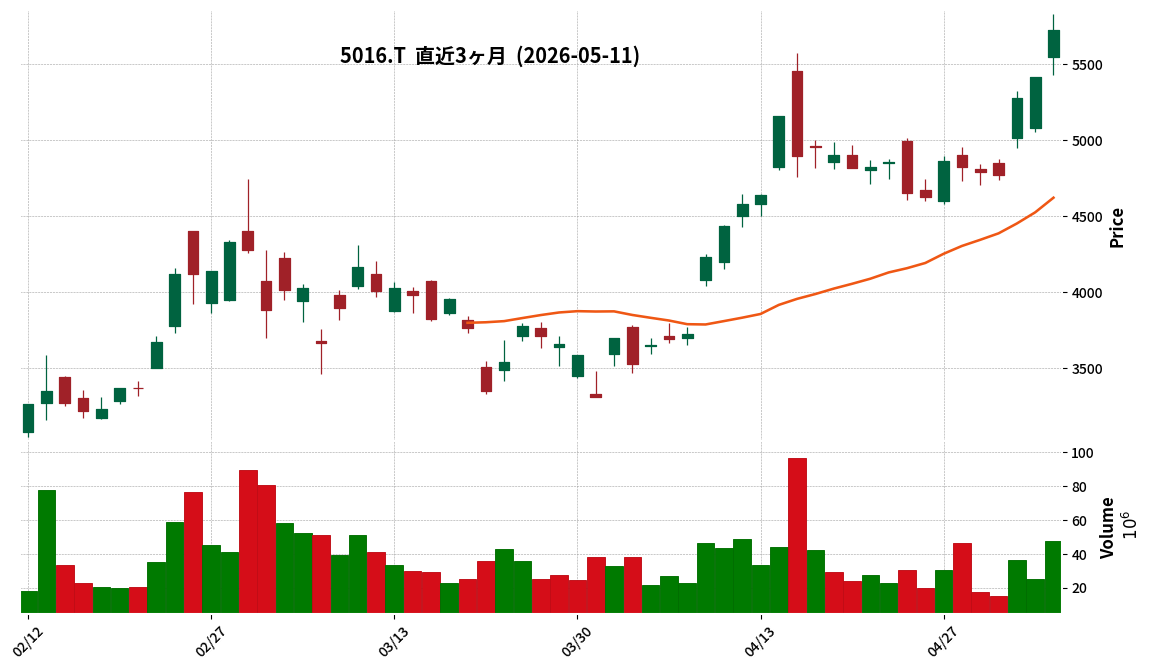
This article is an AI-generated summary and analysis of official IR disclosures.
📄 Announcement (AI-Reviewed)
- JX Metals reported consolidated revenue of ¥884,638 million for the fiscal year ended March 31, 2026, marking a 23.7% increase year-over-year. Operating profit rose by 55.5% to ¥174,967 million.
- Profit attributable to owners of the parent reached ¥104,645 million (up 53.3% year-over-year), with basic earnings per share at ¥112.94.
- As of March 31, 2026, consolidated total assets were ¥1,505,337 million, and equity attributable to owners of the parent stood at ¥726,488 million.
- The annual dividend for FY2026/3 was ¥31.00 per share (¥25.00 at year-end), with a total payment of ¥28,782 million. A change in dividend policy was resolved on May 11, 2026, to be applied from FY2027/3.
- For the fiscal year ending March 31, 2027, JX Metals forecasts consolidated revenue of ¥930,000 million (up 5.1% year-over-year) and operating profit of ¥190,000 million (up 8.6% year-over-year).
🤖 AI Perspective
The substantial year-over-year increases in revenue and operating profit for FY2026/3 may suggest a favorable market environment and effective operational strategies. The IR document indicates that rising copper prices and strong demand from AI-related investments in the semiconductor market were contributing factors. The positive outlook for FY2027/3, projecting continued growth in both revenue and profit, could signal management’s confidence in sustained business momentum. The revised dividend policy and projected future dividends are also key aspects for investors to consider regarding shareholder returns.
1787|ナカボーテック
5480.0
▲ +1.48%
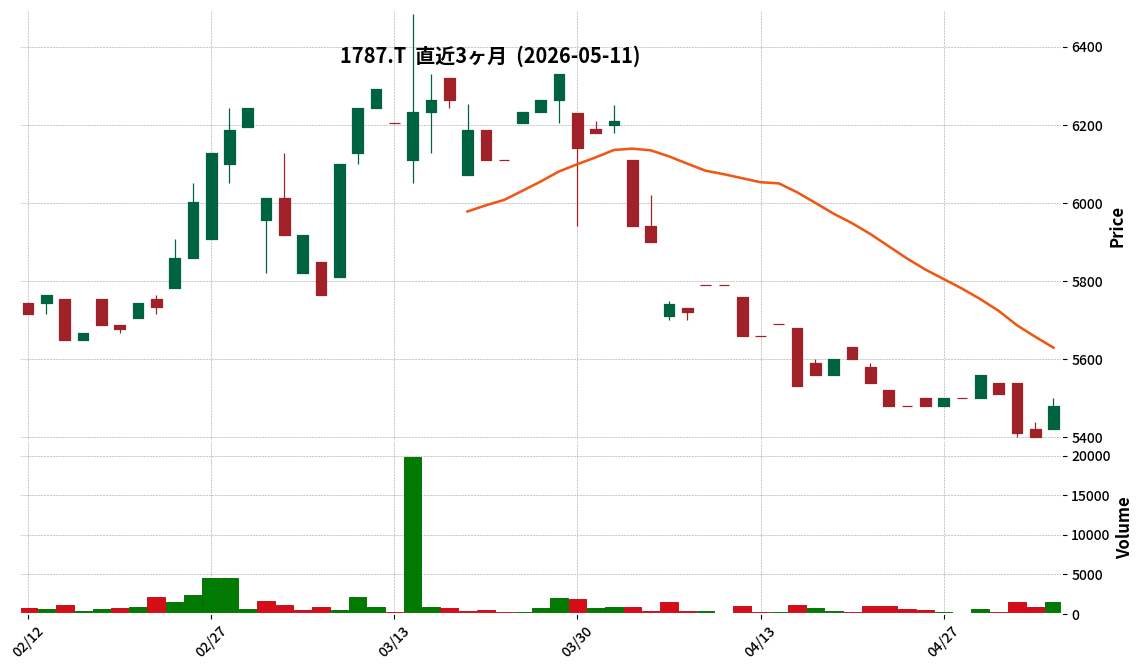
📎 Source:ナカボーテック Official IR →
This article is an AI-generated summary and analysis of official IR disclosures.
📄 Announcement (AI-Reviewed)
- Nakabohtec Co., Ltd. announced its non-consolidated financial results for the fiscal year ended March 31, 2026 (April 1, 2025 – March 31, 2026).
- For FY2026, net sales increased by 1.2% to JPY 14,903 million, operating profit decreased by 10.0% to JPY 1,311 million, ordinary profit decreased by 7.8% to JPY 1,384 million, and profit attributable to owners of parent increased by 13.3% to JPY 1,186 million.
- The annual dividend was set at JPY 335 per share, including a year-end dividend of JPY 335 (compared to JPY 300 in the previous fiscal year). The payout ratio was 69.4%.
- As of March 31, 2026, total assets increased by JPY 22 million to JPY 12,168 million, and net assets increased by JPY 635 million to JPY 9,365 million, resulting in an improved equity ratio of 77.0%.
- For the fiscal year ending March 31, 2027 (April 1, 2026 – March 31, 2027), the company forecasts net sales of JPY 15,200 million (up 2.0% year-on-year), operating profit of JPY 1,307 million (down 0.4%), ordinary profit of JPY 1,347 million (down 2.7%), and profit attributable to owners of parent of JPY 923 million (down 22.2%). The year-end dividend forecast is JPY 260.
🤖 AI Perspective
While net sales grew in FY2026, operating and ordinary profits declined, with an increase in net profit driven by the sale of investment securities. The improvement in the equity ratio may suggest strengthening financial stability. However, the FY2027 forecast indicates a significant decrease in net profit despite expected revenue growth, which could warrant closer examination of the underlying factors and future profitability outlook.
2162|nms HD
399.0
▲ +0.00%
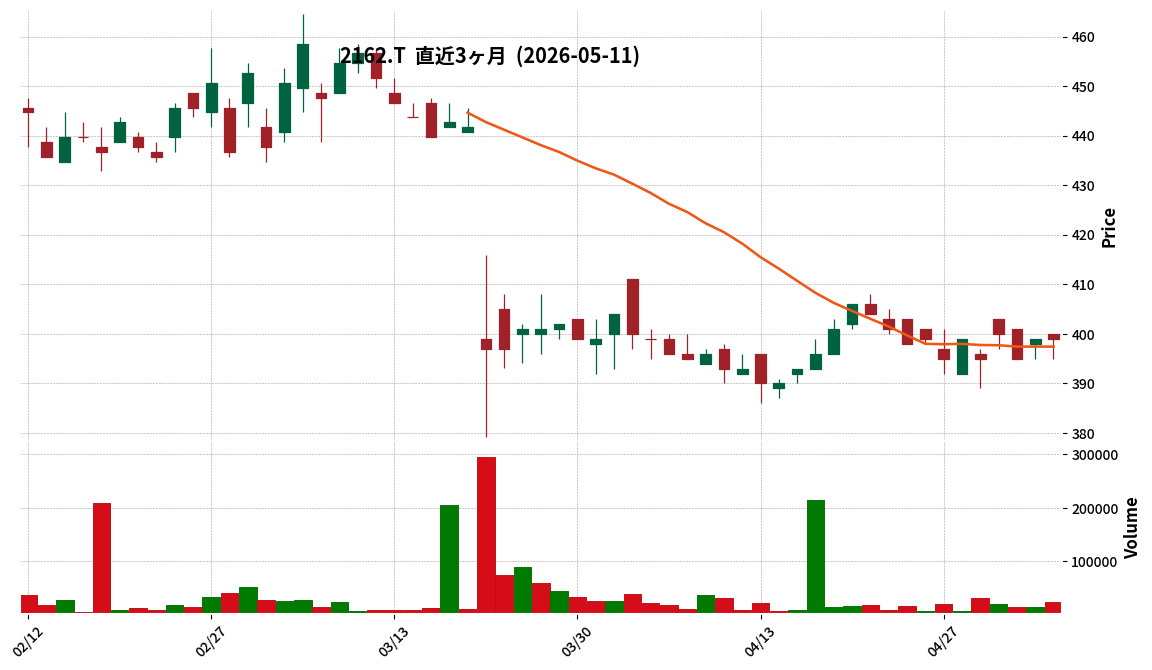
This article is an AI-generated summary and analysis of official IR disclosures.
📄 Announcement (AI-Reviewed)
- nms Holdings, Inc. announced today that it has submitted a corrected semi-annual report for the fiscal year ending March 2026.
- Concurrently, the company corrected its first and second quarter financial statements for the fiscal year ending March 2026.
- The corrections stem from the failure to make necessary accounting entries in prior periods for costs related to defects in products manufactured and sold by a consolidated subsidiary.
- As a result of these corrections, consolidated net assets for the second quarter of the fiscal year ending March 2026 decreased by JPY 704,623 thousand (15.2%), from JPY 4,628,071 thousand to JPY 3,923,447 thousand.
- This correction follows the completion of review procedures by Forvis Mazars Japan LLC for the corrected semi-annual report for the fiscal year ending March 2026.
🤖 AI Perspective
- The series of corrective disclosures, originating from past accounting errors, may draw investor attention regarding the reliability of the company’s financial reporting.
- The fact that delayed recognition of product defect costs at a consolidated subsidiary impacts multiple periods could prompt scrutiny into the effectiveness of internal controls.
- The phased disclosure process might be interpreted as reflecting a complex situation involving different auditing firms for various periods.
6466|TVE
4965.0
▲ +2.90%
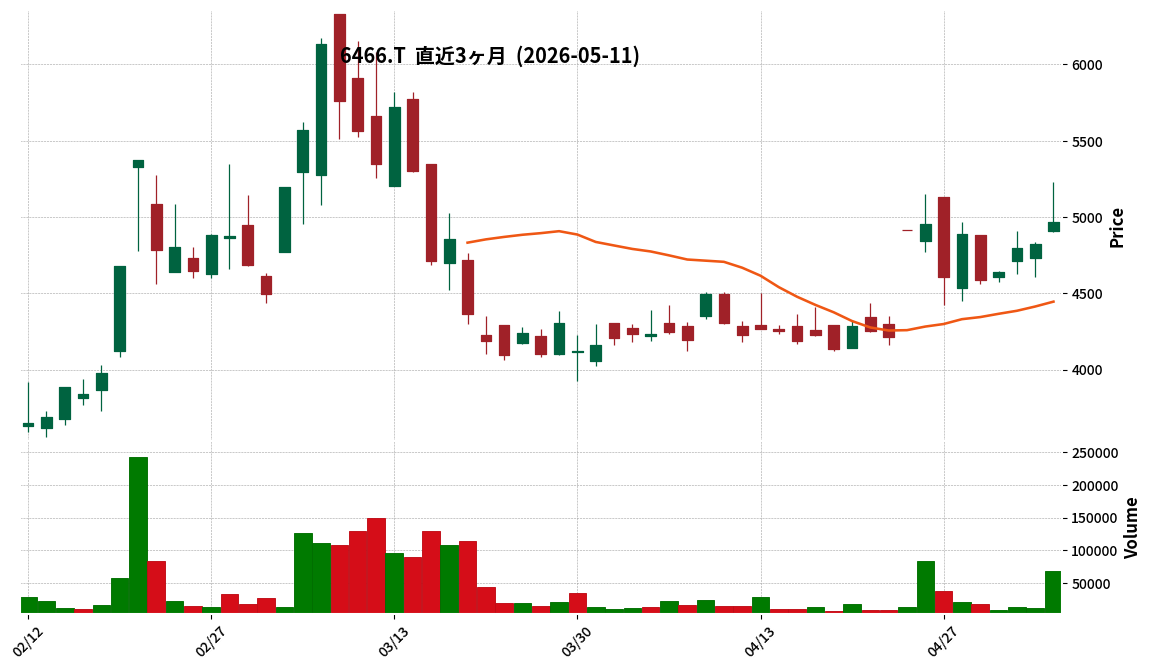
This article is an AI-generated summary and analysis of official IR disclosures.
📄 Announcement (AI-Reviewed)
- TVE Corporation reported consolidated results for the second quarter of the fiscal year ending September 2026, with net sales of JPY 6,003 million (+27.0% year-on-year), operating income of JPY 839 million (+339.5% YoY), ordinary income of JPY 948 million (+254.7% YoY), and net income attributable to owners of parent of JPY 608 million (+237.9% YoY).
- By segment, the Valve business recorded net sales of JPY 4,234 million (+42.7% YoY) and segment profit of JPY 1,026 million (+168.1% YoY), driven by sales from periodic inspection and repair work at domestic nuclear power plants.
- The Steel Manufacturing business reported net sales of JPY 604 million (-17.3% YoY) and a segment loss of JPY 48 million. In contrast, the Electrical Equipment Related business achieved net sales of JPY 1,036 million (+8.2% YoY) and segment profit of JPY 265 million (+25.9% YoY).
- The full-year consolidated earnings forecast for the fiscal year ending September 2026 remains unchanged, projecting net sales of JPY 10,500 million (+3.1% YoY), operating income of JPY 700 million (+17.5% YoY), and net income attributable to owners of parent of JPY 520 million (-13.0% YoY).
- A second-quarter interim dividend of JPY 20.00 per share (annual dividend forecast: JPY 40.00) is expected.
🤖 AI Perspective
- TVE’s robust performance in the second quarter of FY2026 was notably propelled by significant growth in its Valve business, particularly from projects related to nuclear power plants.
- Despite these strong interim results, the decision to maintain the full-year earnings forecast might suggest a cautious outlook from the company regarding the latter half of the fiscal year or potential future market dynamics.
- While the Valve business shows substantial growth, the Steel Manufacturing segment recorded a loss, indicating varied performance across the company’s different operational segments that could be worth monitoring.
8173|Joshin
2880.0
▼ -1.40%
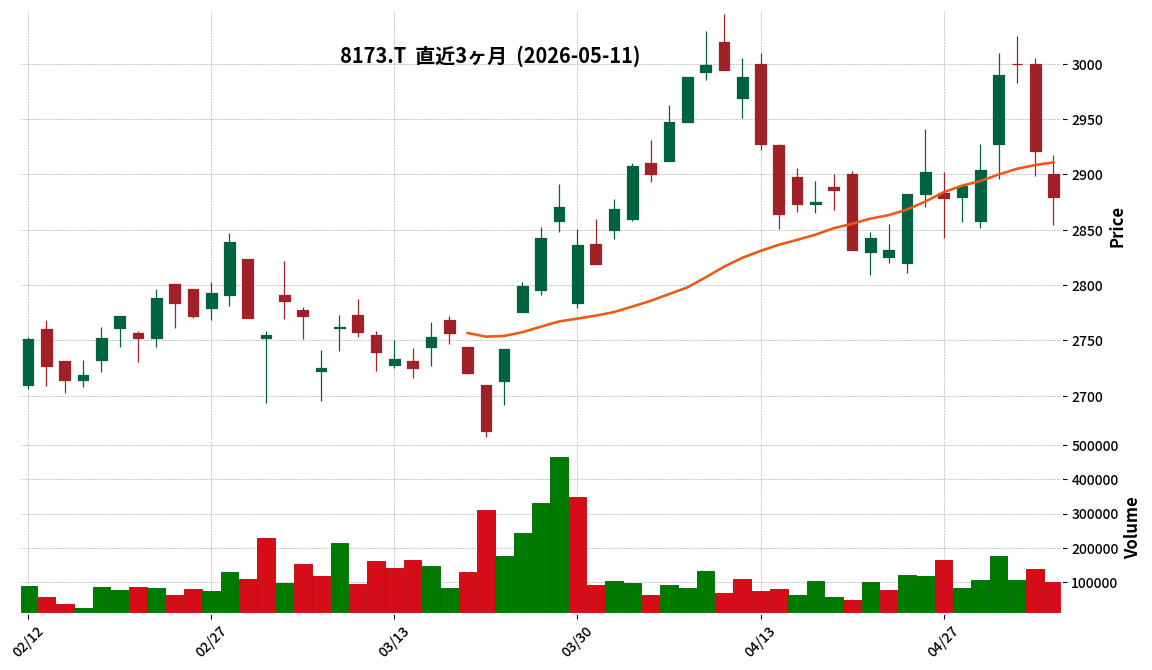
This article is an AI-generated summary and analysis of official IR disclosures.
📄 Announcement (AI-Reviewed)
- Joshin Co., Ltd. announced a partial correction to its “FY2025 (ending March 2026) Full-Year Financial Results Briefing Material” on May 11, 2026.
- The corrected document was originally disclosed on May 8, 2026, at 12:00 PM.
- The reason for the correction was identified as a descriptive error in a part of the disclosed material.
- Notably, there are no corrections to the figures presented in the “FY2026 March Financial Results Tanshin” (summary of financial results) that was released on the same day.
- The specific corrections pertain to the “FY22026 (ending March 2027) Full-Year Forecast” section, as detailed in attached appendices, and the corrected material is available from page 4 onwards and on the company’s website.
🤖 AI Perspective
- This correction primarily addresses descriptive errors within the financial results briefing material concerning the full-year forecast for FY2026 (ending March 2027).
- As the “Financial Results Tanshin” figures remain unchanged, the company’s past performance data is understood to be unaffected.
- Investors may wish to review the revised briefing material to ascertain the updated details regarding the company’s future business outlook.
9942|ジョイフル
—
▲ +0.00%
This article is an AI-generated summary and analysis of official IR disclosures.
📄 Announcement (AI-Reviewed)
- For the third quarter of the fiscal year ending June 2026 (July 1, 2025 – March 31, 2026), Joyfull reported consolidated net sales of ¥54,818 million (up 4.9% year-on-year), operating profit of ¥3,770 million (up 26.5%), ordinary profit of ¥3,871 million (up 28.2%), and profit attributable to owners of parent of ¥2,390 million (up 0.9%).
- As of the end of the third consolidated quarter, total assets were ¥33,490 million, net assets were ¥14,818 million, and the equity ratio stood at 43.9%.
- The annual dividend forecast for the fiscal year ending June 2026 is ¥10.00 (year-end ¥5.00), with no revisions from the most recently announced forecast.
- The full-year consolidated earnings forecast remains unrevised, projecting net sales of ¥72,330 million (up 4.0% year-on-year), operating profit of ¥4,880 million (up 52.4%), ordinary profit of ¥4,890 million (up 52.0%), and profit attributable to owners of parent of ¥3,150 million (up 37.0%).
- During the third consolidated quarter, the total number of stores reached 670, following the opening of 13 new directly-managed stores, the closure of 2 directly-managed stores and 2 franchise stores, the conversion of 45 directly-managed stores to franchises, and 1 franchise store to a directly-managed store.
🤖 AI Perspective
Joyfull’s Q3 results indicate robust growth in net sales, operating profit, and ordinary profit compared to the previous year. This performance may suggest the positive impact of proactive strategies, including frequent grand menu revisions, popular anime/character collaborations, and new store format developments. Furthermore, an equity ratio of 43.9% reflects a stable financial foundation, which could be a point of interest for investors.
💡 Start investing with IR insights
※ 本ページには広告が含まれます(PR)
Disclaimer: This article is for informational purposes only and does not constitute investment advice. All investment decisions are at your own risk.

コメント