
📌 Today’s Highlights
Today we cover 42 IR announcements. Notable among them: G-ロボペイ (4374), 大日塗料 (4611), メイコー (6787). Use the table of contents below to navigate to each company.
- 4374|G-ロボペイ
- 4611|大日塗料
- 6787|メイコー
- 1948|弘電社
- 4958|長谷川香
- 8473|SBI
- 145A|G-エルイズビー
- 1494|One・高配当日本株
- 3187|G-ミラタップ
- 354A|iF高配当50
- 413A|iF台湾テック
- 4375|G-セーフィー
- 7458|第一興商
- 8591|オリックス
- 5269|日コンクリ
- 3800|ユニリタ
- 2317|システナ
- 8214|AOKI HD
- 231A|Q-Cross E
- 478A|G-フツパー
- 6544|JESHD
- 7505|扶桑電通
- 8705|日産証券グループ
- 8958|R-グロバル
- 6644|大崎電
- 1807|佐藤渡辺
- 2094|REITインバース
- 2555|東証REIT-ETF
- 281A|G-インフォメティス
- 3080|ジェーソン
- 3777|G-環境フレンドリー
- 4634|artience
- 5721|エスクリプトエナジー
- 6087|アビスト
- 6208|石川製
- 6418|日金銭
- 6572|オープンG
- 7887|南海プライウッド
- 8783|abc
- 8877|エスリード
- 5031|G-モイ
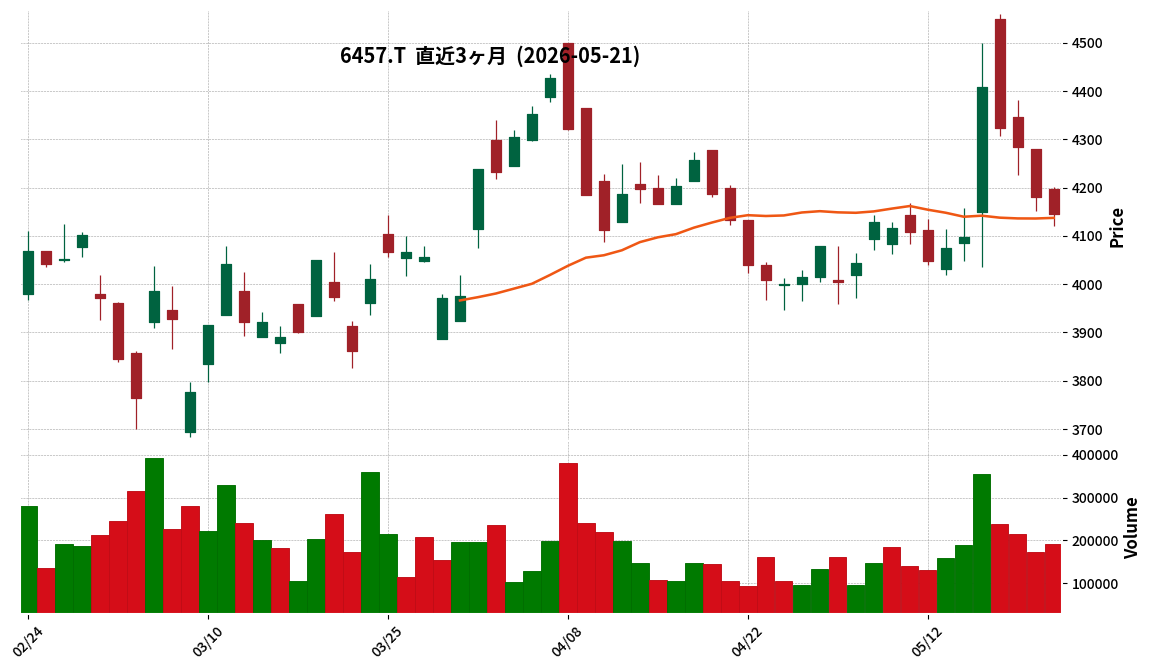
- 6457|グローリー
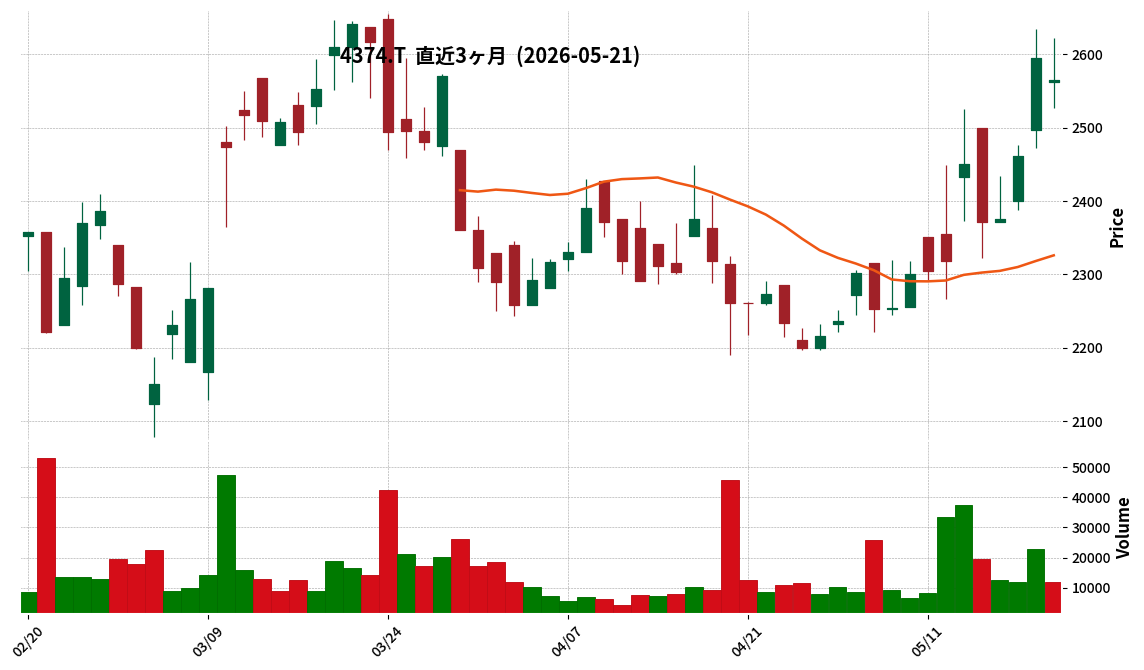
4374|G-ロボペイ
2565.0
▼ -1.16%
This article is an AI-generated summary and analysis of official IR disclosures.
📄 Announcement (AI-Reviewed)
- ROBOT PAYMENT, Inc. (4374) published a summary of Q&A from its Q1 FY2206 individual investor meeting on May 21, 2026, held on May 18, 2026.
- The company plans to allocate 15% of profits to business investments and 65% to M&A, based on its capital allocation criteria for growth investments.
- The new “Debt Collection Robo” service, launched in March 2026, is progressing with sales efforts and acquiring customers from both new and existing client bases.
- To achieve revenue growth of over 30%, the company plans to expand revenue in Phase 3 through a revenue model based on GMV (Gross Merchandise Value), such as RBF.
- The mid-term operating profit margin target is 20% to 25%, with a long-term management strategy prioritizing sustained profit growth and accelerated future revenue growth through re-investment.
- For shareholder returns, the company prioritizes sustainable profit distribution centered on dividends, while also considering share buybacks as an option depending on stock price.
- The decrease in cost of sales was primarily attributed to the reduction in depreciation expenses for intangible software assets.
🤖 AI Perspective
The IR suggests that in addition to solid growth in existing businesses, the new “Debt Collection Robo” service is progressing ahead of plan, which could be a key driver for future earnings. The company’s commitment to balancing revenue growth and improving profit margins, along with its transparent communication on capital allocation and shareholder returns, may enhance investor confidence. The introduction of a GMV-based revenue model, in particular, could indicate significant potential for substantial revenue expansion in the future.
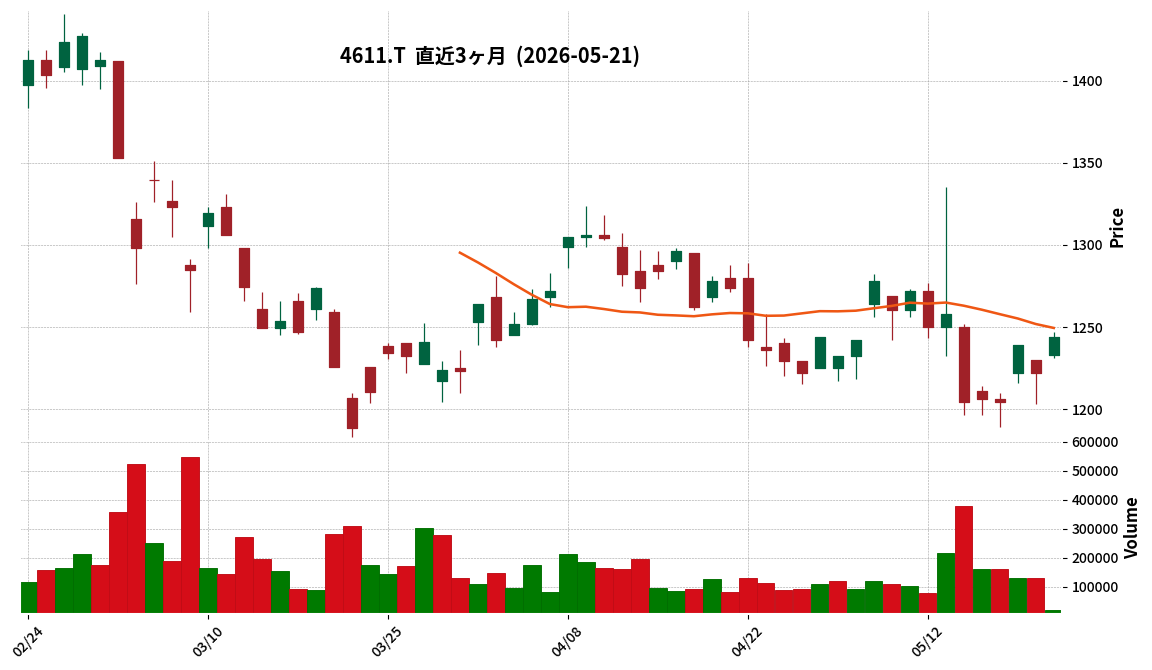
4611|大日塗料
1244.0
▲ +1.80%
This article is an AI-generated summary and analysis of official IR disclosures.
📄 Announcement (AI-Reviewed)
- Dainippon Paint announced its full-year financial results for FY2025 (ending March 2026), with net sales of ¥93,759 million (up 29.3% year-on-year), operating profit of ¥3,854 million (down 18.3% year-on-year), and net profit attributable to owners of parent of ¥1,688 million (down 82.1% year-on-year).
- In the domestic paint business, sales increased due to new consolidation (Shinto Paint), but sales recovery after the lifting of the JIS temporary suspension was limited, and industrial applications also saw revenue decline due to market stagnation. Operating profit decreased by 37.4% due to sluggish sales and increased expenses.
- The overseas paint business saw sales growth due to the consolidation of the Shinto Paint Group. Operating profit increased by 54.2% due to the reduction of losses in the China business.
- The lighting equipment business showed robust performance in the LED sector, but UV and fluorescent lamps faced declining demand. Operating profit decreased by 6.6% due to increased depreciation expenses from head office relocation and personnel costs.
- For FY2026 (ending March 2027), the company projects consolidated net sales of ¥96,000 million (up 2.4% year-on-year), operating profit of ¥5,500 million (up 42.7% year-on-year), and net profit attributable to owners of parent of ¥3,400 million (up 101.4% year-on-year).
🤖 AI Perspective
While net sales saw significant growth in FY2025 due to new consolidations, the decline in operating and net profit suggests challenges from the deteriorating profitability of the domestic paint business and losses from the divestiture of the China business. The FY2026 forecast indicates a recovery driven by improved domestic paint sales, enhanced production efficiency, and the absence of prior year’s losses from affiliate restructuring. Investors may want to monitor the progress of structural reforms across all business segments. Furthermore, the exclusion of recent Middle East geopolitical impacts on raw material costs from the FY2026 forecast is a factor worth watching for potential future adjustments.
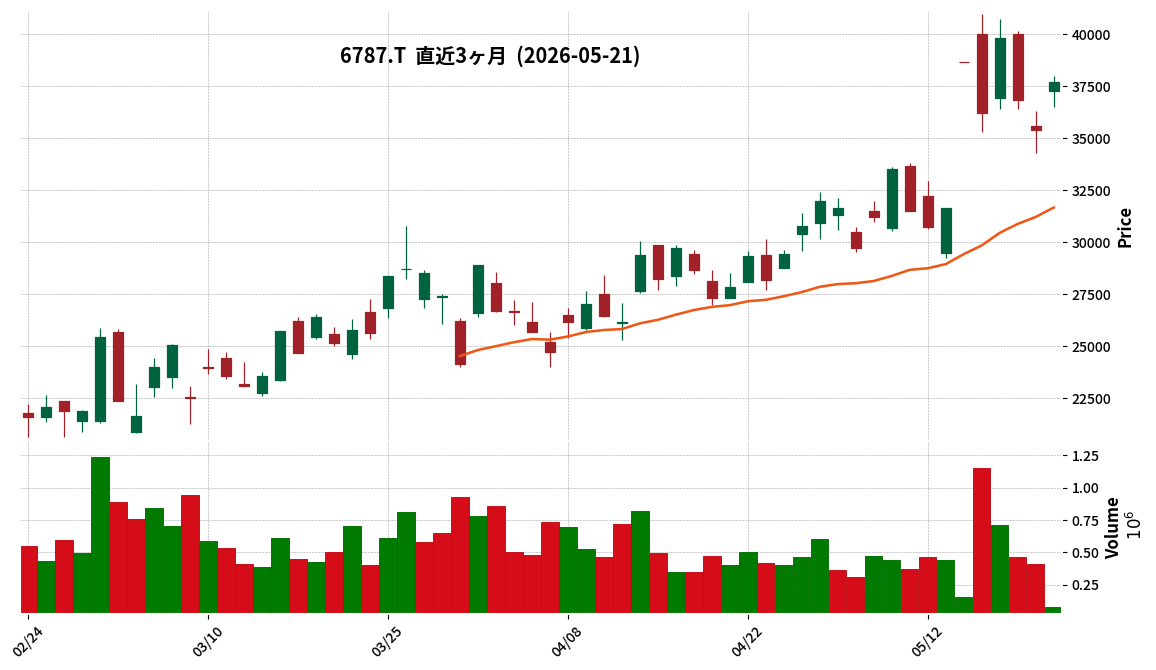
6787|メイコー
37700.0
▲ +6.50%
This article is an AI-generated summary and analysis of official IR disclosures.
📄 Announcement (AI-Reviewed)
- Meiko Electronics reported consolidated results for FY2025, with net sales of ¥240.6 billion, operating profit of ¥24.6 billion, ordinary profit of ¥26.5 billion, and net profit of ¥19.8 billion.
- The full-year forecast for FY2026 projects net sales of ¥320.0 billion, operating profit of ¥38.0 billion, ordinary profit of ¥36.0 billion, and net profit of ¥27.0 billion.
- The new mid-term management plan sets targets for FY22028: net sales of ¥460.0 billion, operating profit of ¥65.0 billion, and an operating profit margin of 14%.
- Capital expenditure for FY2025 was ¥49.7 billion, with plans for ¥70.0 billion annually from FY2026 to FY2028.
- Vietnam Plant 4 began operations in July 2025 and is still undergoing line expansion, with mass production for satellite and AI applications having commenced. The investment scale for this plant has increased from approximately ¥25.0 billion to ¥45.0 billion.
🤖 AI Perspective
Meiko’s IR document highlights strong performance in FY2025 and an optimistic outlook for FY2026, with AI server and automotive PCBs identified as key growth drivers. The aggressive capital expenditure outlined in the new mid-term plan, particularly the increased investment in Vietnam Plant 4, suggests a strong focus on enhancing future production capacity and meeting market demand. The continuous improvement targets for sales and profit margins indicate the company’s commitment to strengthening its competitive position.
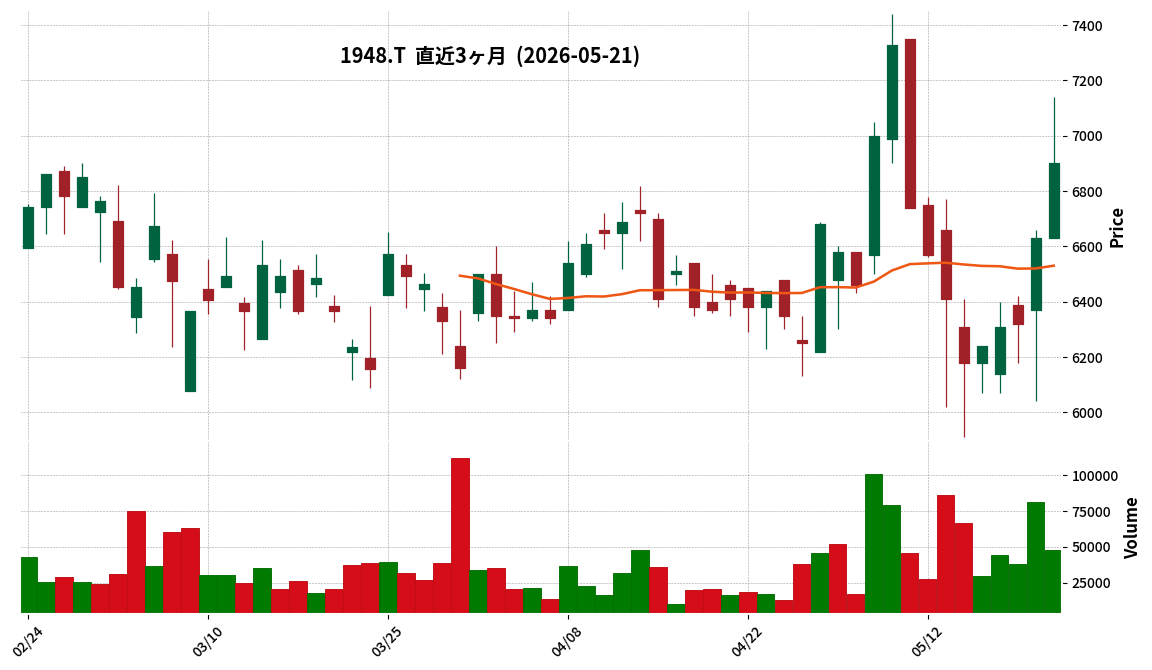
1948|弘電社
6900.0
▲ +4.07%
This article is an AI-generated summary and analysis of official IR disclosures.
📄 Announcement (AI-Reviewed)
- KODENSHA announced on May 21, 2026, a partial correction to its consolidated financial results for the fiscal year ended March 2026.
- The correction pertains to “3. Information on sales, profit or loss, assets, liabilities, and other items by reporting segment and disaggregation of revenue” within the segment information on page 17 of the supplementary materials for the financial report published on May 13, 2026.
- Specifically, the revenue from “goods or services transferred at a point in time” for the Electrical Installation Works segment was corrected from 14,330 million yen to 6,258 million yen, and revenue from “goods or services transferred over time” was corrected from 21,144 million yen to 29,216 million yen.
- This correction only affects the breakdown of revenue within the segment information; the total “revenue from contracts with customers” of 44,234 million yen and “net sales to external customers” of 44,234 million yen remain unchanged.
- Segment profit, segment assets, depreciation expenses, and increases in tangible and intangible fixed assets were also not subject to correction.
🤖 AI Perspective
This correction primarily concerns the disaggregation of revenue within segment information, aligning with revenue recognition accounting standards. Given that the overall consolidated revenue and profit figures remain unchanged, it suggests that the company’s fundamental financial performance or outlook is not directly impacted by this adjustment. For investors, this provides more accurate granularity in understanding how revenue is recognized within specific segments, which could be relevant for detailed segment analysis.
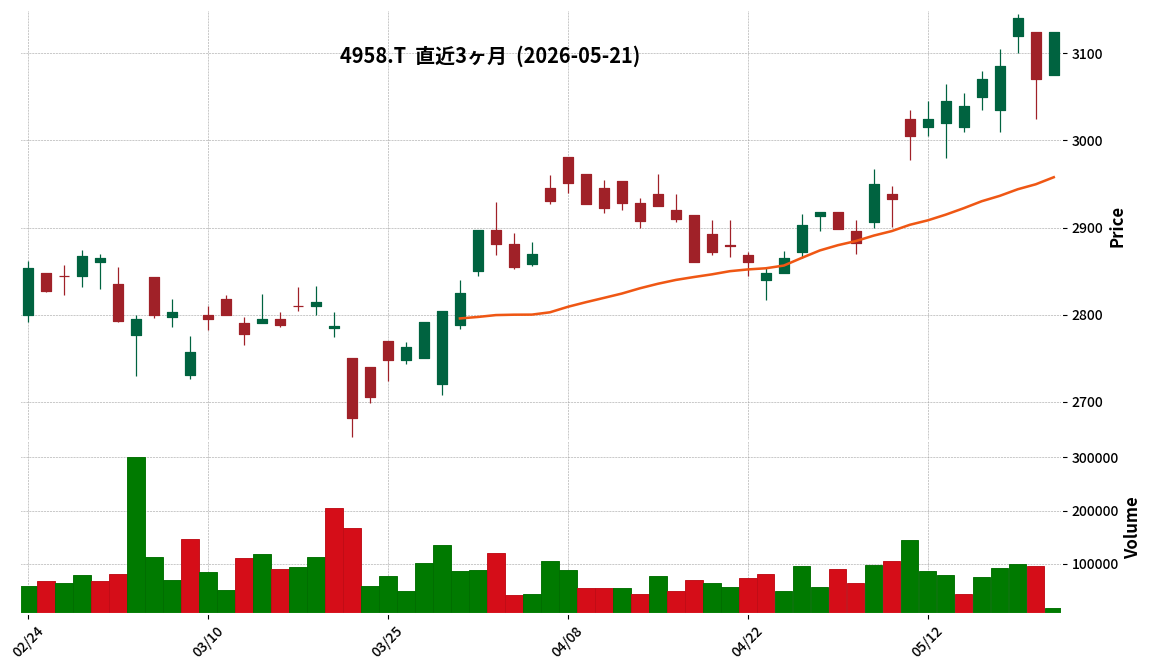
4958|長谷川香
3125.0
▲ +1.79%
This article is an AI-generated summary and analysis of official IR disclosures.
📄 Announcement (AI-Reviewed)
- T. Hasegawa Co., Ltd. announced its consolidated financial results for the second quarter of the fiscal year ending September 2026 (October 1, 2025 – March 31, 2026).
- Consolidated net sales reached ¥37,585 million (up 4.9% year-on-year), operating income was ¥4,528 million (up 0.2%), ordinary income was ¥4,936 million (up 0.2%), and net income attributable to owners of the parent was ¥3,749 million (up 11.6%).
- Of the ¥1,761 million increase in net sales, ¥671 million (38%) was attributed to favorable foreign exchange rates.
- By segment, Flavor sales were ¥32,990 million (up 4.0%), and Fragrance sales were ¥4,595 million (up 11.8%).
- The ratio of overseas sales to consolidated net sales increased to 51.0% (from 49.6% in FY2025).
🤖 AI Perspective
The depreciation of the yen positively impacted net sales and operating income, while one-off factors such as acquisition costs for a Vietnamese subsidiary partially tempered operating income. Achieving increased sales across all major locations, particularly the double-digit growth in the fragrance segment, may suggest a strong underlying demand. The rising proportion of overseas sales could indicate effective progress in the company’s global expansion strategy.
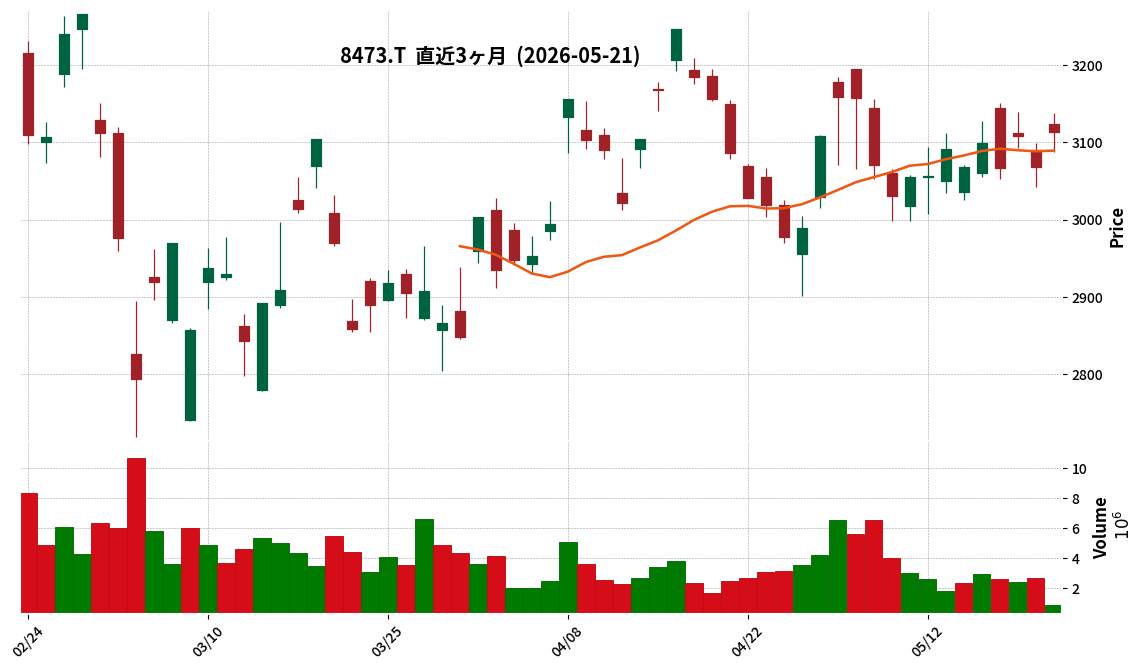
8473|SBI
3114.0
▲ +1.50%
This article is an AI-generated summary and analysis of official IR disclosures.
📄 Announcement (AI-Reviewed)
- SBI Holdings, Inc. has signed a share transfer agreement with Ridge-i, Inc. for the acquisition of shares in Star Music Entertainment Co., Ltd., making it a subsidiary.
- The number of shares acquired is 710,000, and the acquisition price is 921 million Japanese Yen.
- Post-acquisition, SBI Holdings’ voting rights ownership ratio in Star Music Entertainment will be 66.98%.
- The basic agreement was signed on March 30, 2026, and the share transfer agreement was signed on May 18, 2026.
- The share transfer is scheduled to be executed on July 16, 2026, subject to approval at Ridge-i’s general meeting of shareholders.
- SBI Holdings stated that the impact of this share transfer on its consolidated financial results for the fiscal year ending March 2027 is expected to be minor.
🤖 AI Perspective
SBI Holdings has formalized its intent to acquire Star Music Entertainment, moving from a basic agreement to a definitive share transfer agreement. This strategic move could potentially broaden SBI’s business portfolio and introduce new areas for synergy within the group. Investors may consider monitoring the completion of this transaction, particularly the shareholder approval condition, and how it aligns with SBI’s long-term growth strategy.
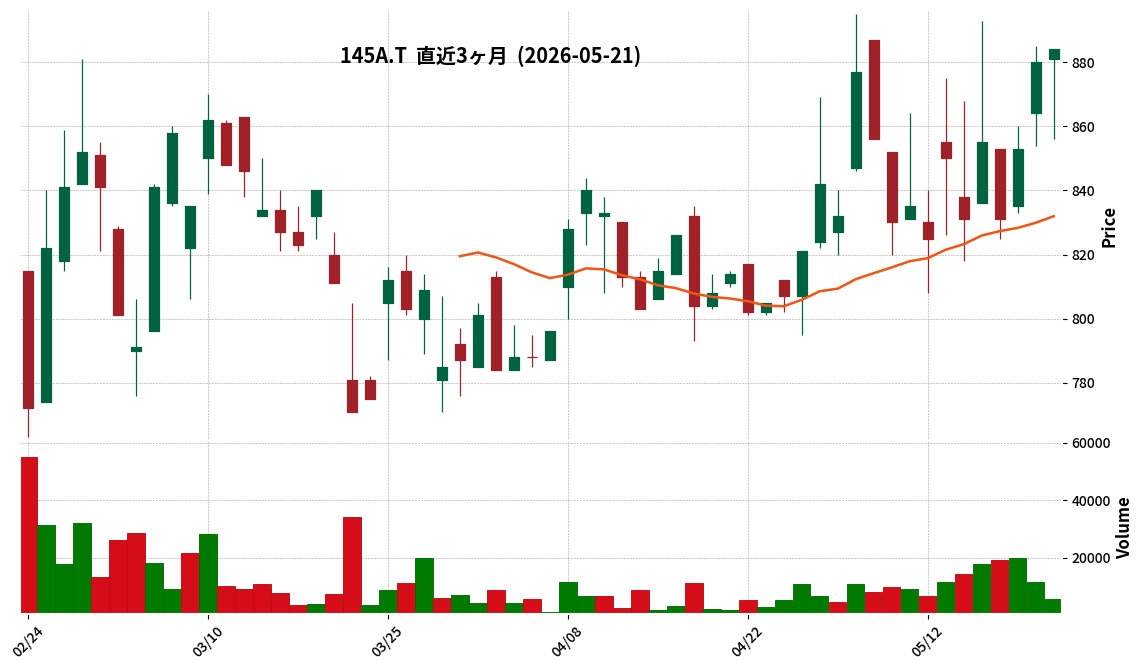
145A|G-エルイズビー
884.0
▲ +0.45%
📎 Source:G-エルイズビー Official IR →
This article is an AI-generated summary and analysis of official IR disclosures.
📄 Announcement (AI-Reviewed)
- G-L is B implemented a uniform 20% price revision for “direct” from April 1, 2026. No significant cancellation impact from the price increase has been observed, and it is expected to contribute positively to performance.
- The company stated that the effects of the “direct” price increase are partially factored into the forecast operating profit margin of 9.5% for the current fiscal year, and customer acceptance has been better than initially anticipated.
- Regarding the forecast operating profit growth of +57.8% for FY2026, the company explained that M&A-related goodwill amortization is one factor, and the +257.9% growth in the previous year was partly due to the smaller base figure in the year prior.
- For the BIM business subsidiary, IU BIM STUDIO, approximately 90% of Q1 sales were from human resources dispatch. Out of 53 BIM professionals at the company, around 45 are engaged in HR dispatch.
- The company’s fundamental M&A strategy is to combine its customer base with the acquired company’s services to generate synergies and achieve mutual growth. Customer referrals from G-L is B’s sales team to IU BIM STUDIO have already been initiated.
🤖 AI Perspective
The limited impact of the “direct” price revision on cancellation rates and its expected positive contribution to performance could be a significant factor for future profitability improvement. Furthermore, the explicit efforts to create synergies through M&A strategies are noteworthy in evaluating the overall group growth strategy. While the high proportion of human resources dispatch sales in the BIM business subsidiary provides a stable revenue stream, the focus may shift to whether further growth in consulting and contracted services can become future growth drivers.
Disclaimer: This article is for informational purposes only and does not constitute investment advice.
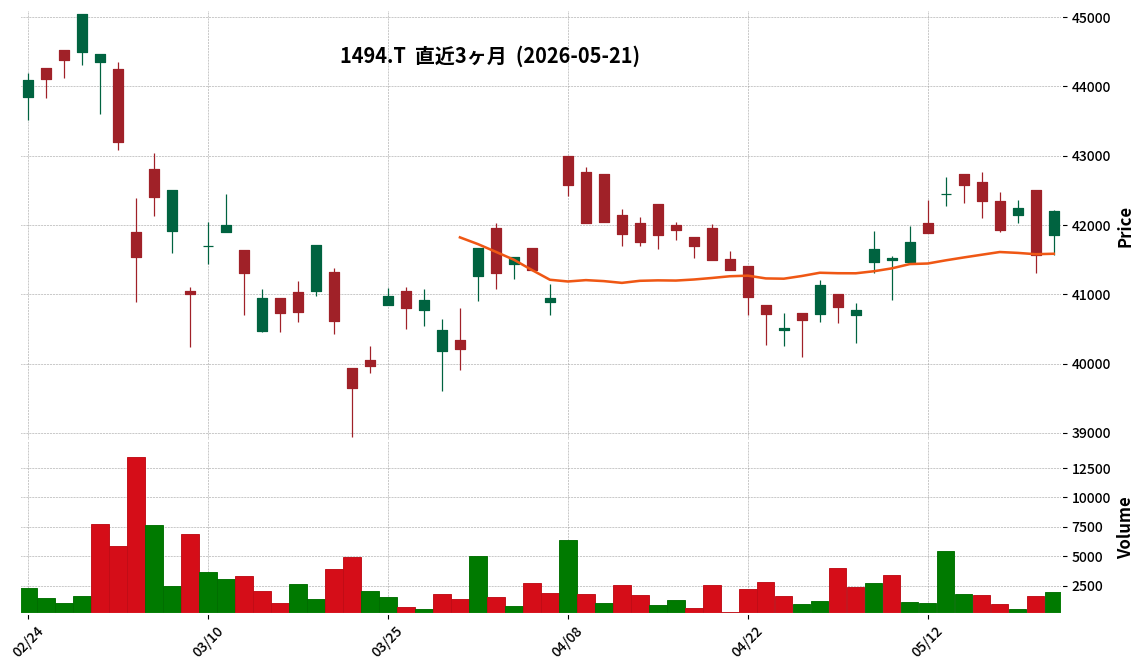
1494|One・高配当日本株
42200.0
▲ +1.54%
📎 Source:One・高配当日本株 Official IR →
This article is an AI-generated summary and analysis of official IR disclosures.
📄 Announcement (AI-Reviewed)
- One ETF High Dividend Japan Stock (Ticker: 1494) announced its financial results for the April 2026 fiscal period, covering October 9, 2025, to April 8, 2026.
- Total net assets at the end of the period reached ¥84,028 million, an increase of 20.07% from the previous period. The primary investment asset, equities, totaled ¥81,359 million, representing 96.8% of the portfolio.
- The number of outstanding units increased to 1,968 thousand units, a 0.41% rise from the previous period end.
- The net asset value per unit was ¥42,690, marking a 19.48% increase from the prior period end.
- The distribution per unit was announced as ¥688, an increase of 21.34% from the previous period. The distribution payment start date is May 15, 2026.
🤖 AI Perspective
The financial results for One ETF High Dividend Japan Stock for the April 2026 period indicate growth in both net assets and net asset value per unit, suggesting an expansion in fund size and favorable operational performance. The substantial increase in the distribution per unit may also be a noteworthy point for investors.
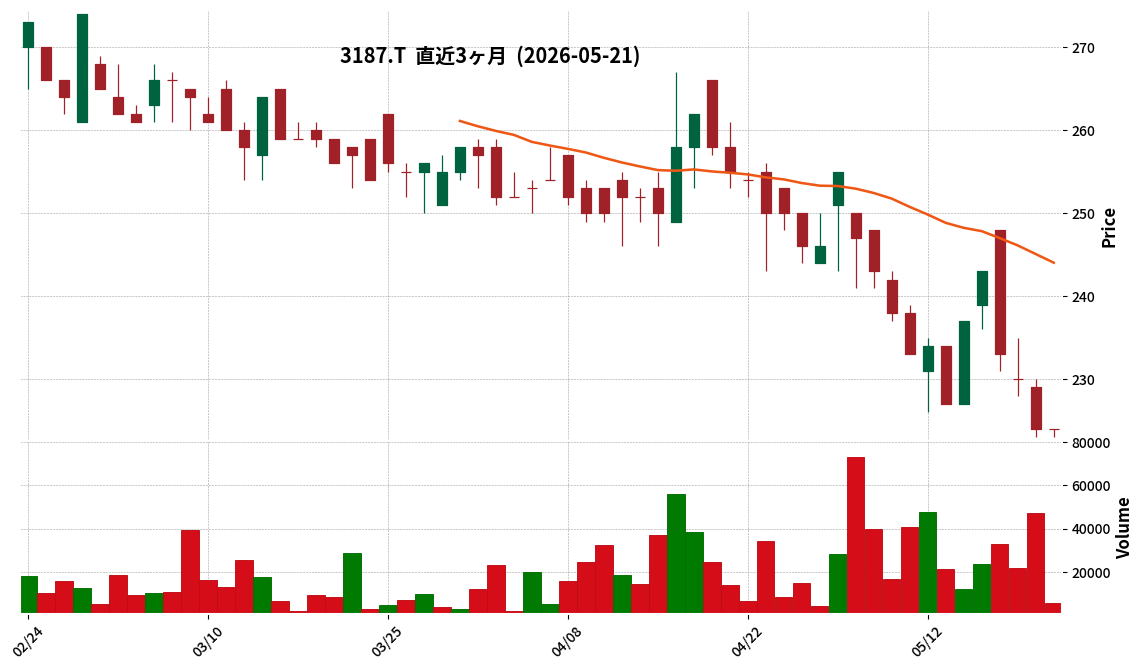
3187|G-ミラタップ
224.0
▲ +0.00%
📎 Source:G-ミラタップ Official IR →
This article is an AI-generated summary and analysis of official IR disclosures.
📄 Announcement (AI-Reviewed)
- Miratap Inc. has published its financial results presentation video for the second quarter of the fiscal year ending September 2026.
- A transcript of the financial results presentation video has also been posted on Logmi Finance.
- Beginning with this second quarter, the company utilized an AI avatar for its financial results presentation video, marking a first for Miratap Inc.
- For the second quarter of FY2026 (October 1, 2025 – March 31, 2026), the company transitioned to non-consolidated financial statements, reporting standalone sales of ¥7,886 million (up 2.0% year-over-year) and operating profit of ¥269 million.
- Sales increased year-over-year, achieving a record high for a second quarter.
- Key factors contributing to the increase in sales include higher order value and frequency from loyal customers.
🤖 AI Perspective
This announcement indicates that G-Miratap achieved increased revenue and profit in the second quarter of FY2026, with the record-high sales being a notable point. The introduction of an AI avatar for their IR video suggests the company’s proactive approach to adopting new technologies for enhanced information disclosure and investor engagement. This initiative could potentially improve the quality and speed of information dissemination to investors.
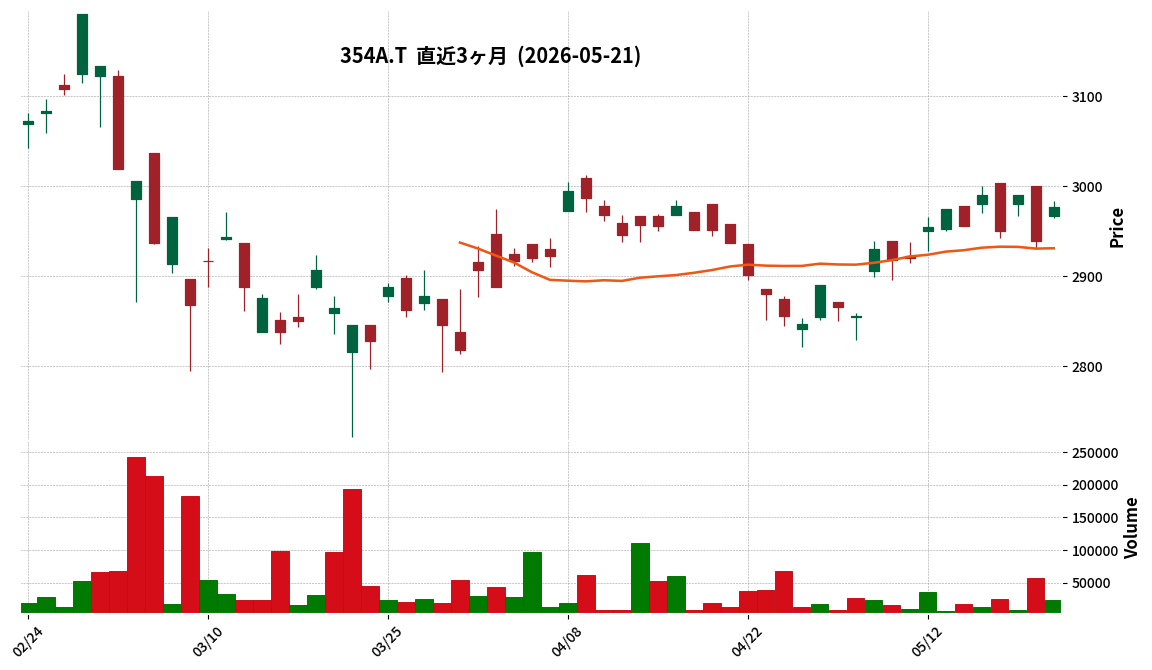
354A|iF高配当50
2977.0
▲ +1.29%
📎 Source:iF高配当50 Official IR →
This article is an AI-generated summary and analysis of official IR disclosures.
📄 Announcement (AI-Reviewed)
- iFreeETF Bloomberg Japan High Dividend 50 (Fund name: iFreeETF Bloomberg Japan High Dividend 50 Index, Code: 354A) announced its financial results for the fiscal period ending April 2026 (October 8, 2025 – April 7, 2026).
- Total net assets for the period amounted to JPY 60,568 million, an increase of approximately 1.77 times from JPY 34,105 million in the previous period (October 2025).
- Equity, the primary investment asset, reached JPY 59,678 million (composition ratio 98.5%) at the end of the current period, up from JPY 33,997 million (99.7%) at the end of the previous period.
- The number of outstanding units at the end of the specified period increased to 20,751 thousand units from 13,804 thousand units at the end of the previous period.
- The net asset value per unit rose to JPY 2,918.72, up from JPY 2,470.62 in the previous period.
- The distribution per unit was JPY 43 for the April 2026 period. This compares to JPY 41 for the October 2025 period and JPY 8 for the January 2026 period.
- Total operating revenue was JPY 8,614 million, and net profit for the period was JPY 8,537 million.
🤖 AI Perspective
The significant increase in net assets and outstanding units for iFreeETF Bloomberg Japan High Dividend 50 in the April 2026 period suggests a notable expansion in the fund’s scale. The growth in equity holdings, a primary investment asset, and the corresponding rise in net asset value per unit, reflect both the market environment and the fund’s operational performance. The increased distribution per unit compared to the previous period may also be a point of interest for investors.
Disclaimer: This article is for informational purposes only and does not constitute investment advice.
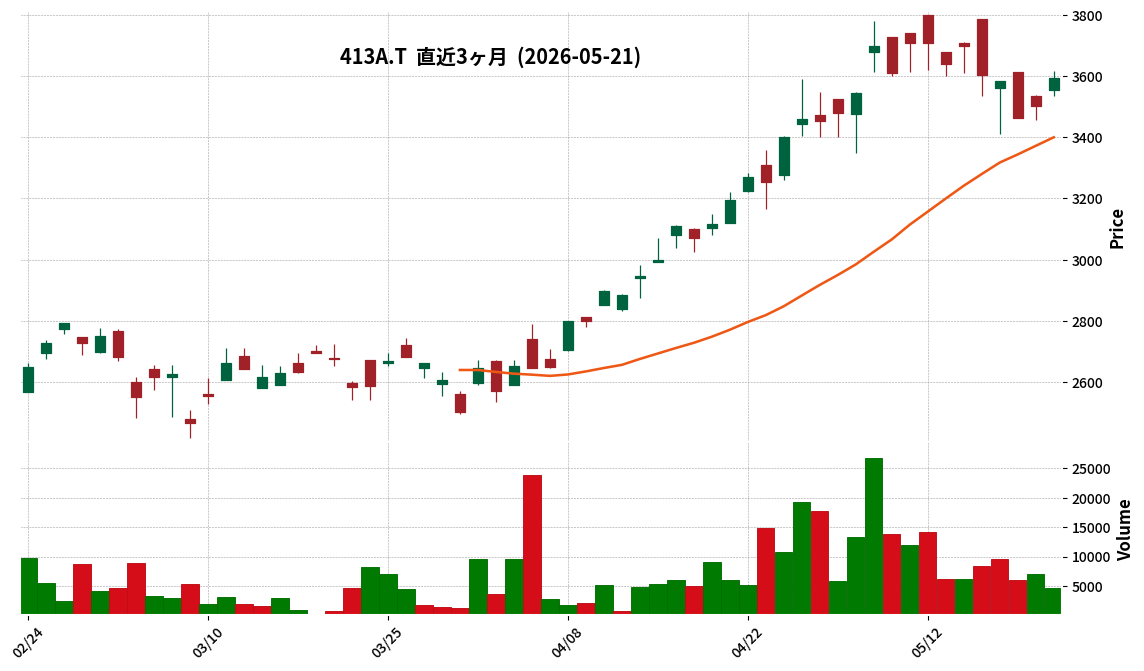
413A|iF台湾テック
3595.0
▲ +2.63%
📎 Source:iF台湾テック Official IR →
This article is an AI-generated summary and analysis of official IR disclosures.
📄 Announcement (AI-Reviewed)
- iFreeETF Cathay Taiwan Tech Leader (413A) announced its financial results for the fiscal period ended April 2026 (September 10, 2025 – April 7, 2026) on May 21, 2026.
- Total net assets for the period amounted to JPY 1,066 million (100.0% of total assets). Major investment assets were JPY 1,138 million (106.8%), and cash, deposits, and other assets (net of liabilities) were negative JPY 72 million (△6.8%).
- The number of units outstanding at the end of the period was 408 thousand units, with a net asset value per unit of JPY 2,613.74.
- A distribution of JPY 175 per unit was announced, with the distribution payment start date set for May 15, 2026.
- Total operating revenue was JPY 280,059,122, total operating expenses were JPY 1,688,631, and net income for the period was JPY 278,370,491.
🤖 AI Perspective
The initial financial results for iFreeETF Cathay Taiwan Tech Leader indicate a solid start with robust net assets and a noteworthy distribution per unit. Given its structure as an ETF primarily investing in beneficiary certificates of a parent fund, its performance likely reflects the movements of its benchmark, the TIP FactSet Taiwan Technology Leader & Communications Index. The announced distribution level could be a key indicator for investors assessing the fund’s profitability and income generation capacity.
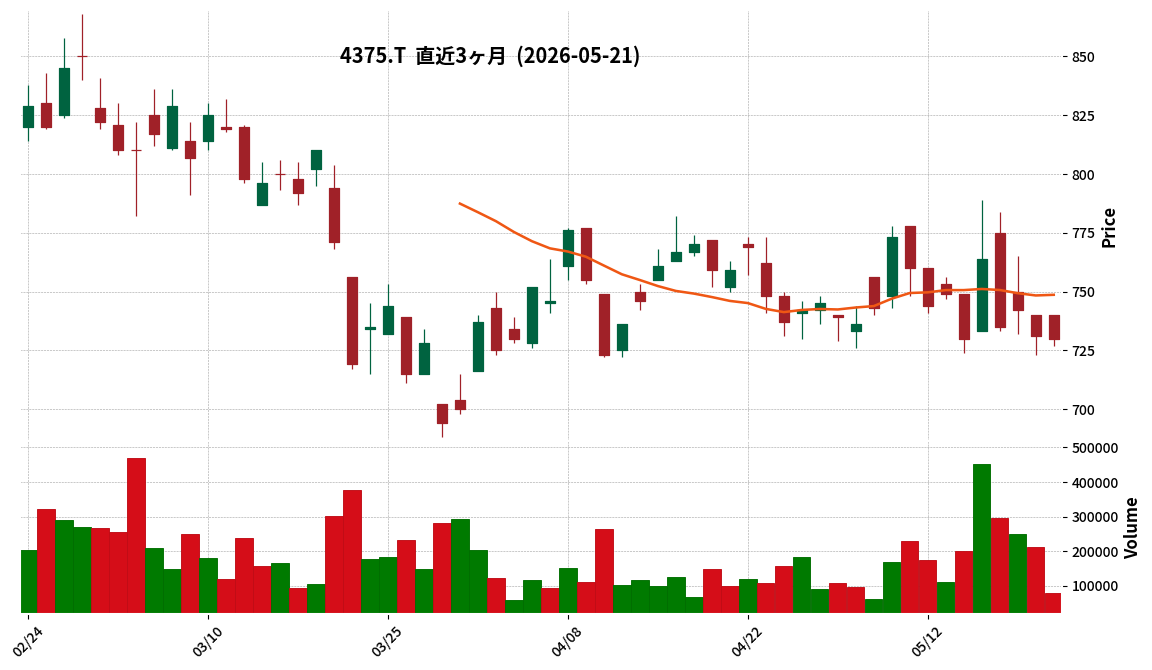
4375|G-セーフィー
730.0
▼ -0.14%
📎 Source:G-セーフィー Official IR →
This article is an AI-generated summary and analysis of official IR disclosures.
📄 Announcement (AI-Reviewed)
- For Q1 FY2026, revenue reached 5,107 million yen (up 20.9% YoY) and gross profit was 2,669 million yen (up 28.4% YoY).
- Adjusted operating profit was 203 million yen, showing an increase compared to the previous quarter and a 144 million yen increase YoY.
- The gross profit margin improved by 3.1 percentage points from the previous period, reaching 52.3%.
- Spot revenue was 1.40 billion yen (up 19.3% YoY), and recurring revenue was 3.69 billion yen (up 21.5% YoY).
- G-Safie announced the planned group joining of Laska Co., Ltd. (a construction company) to strengthen construction and maintenance systems and accelerate the implementation of On-site AX.
🤖 AI Perspective
The increase in adjusted operating profit for the first quarter suggests a strong start towards achieving full-year performance targets. The M&A for strengthening construction and maintenance capabilities could accelerate the promotion of On-site AX (AI Transformation). Growth in both recurring and spot revenues may indicate a balanced approach to building a stable revenue base while expanding business operations.
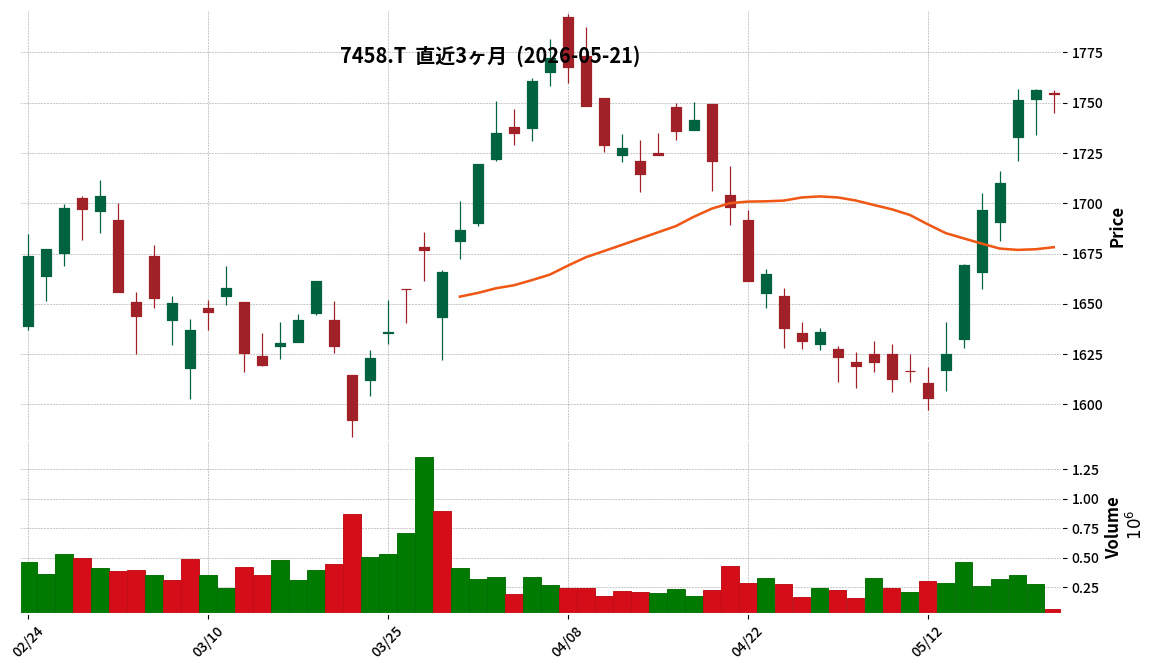
7458|第一興商
1754.5
▼ -0.11%
This article is an AI-generated summary and analysis of official IR disclosures.
📄 Announcement (AI-Reviewed)
- DAIICHIKOSHO’s consolidated results for the fiscal year ended March 2026 show net sales increased by 6.5% year-on-year to ¥162.95 billion, marking a new record high.
- Operating profit was ¥17.917 billion, a 0.2% decrease from the previous year, remaining largely flat.
- Net profit attributable to owners of parent decreased by 12.6% year-on-year to ¥15.889 billion.
- In the Commercial Karaoke Business, the launch of the new product “LIVE DAM WAO!” led to increased product sales, with DAM operating units slightly increasing to 222,000 units at the end of the period.
- The Karaoke and Restaurant Store Business achieved year-on-year existing store sales growth of +4% for karaoke stores and +2% for restaurant stores.
- The number of stores at the end of the period was 521 for karaoke (including 16 stores acquired through M&A) and 167 for restaurants.
- The Parking Business saw its facilities increase to 4,400 and parking spaces to 51,000.
- The company relocated its head office in February 2026 and sold real estate including the former head office building.
🤖 AI Perspective
DAIICHIKOSHO’s FY2026/3 results highlight the positive impact of the new “LIVE DAM WAO!” flagship product on achieving record net sales. However, increased selling, general, and administrative expenses, including new product promotion costs, personnel expenses, and head office relocation costs, appear to have offset revenue growth, resulting in a flat operating profit. Investors may also note the decrease in net profit attributable to the parent due to the absence of special gains from real estate sales recorded in the previous year.
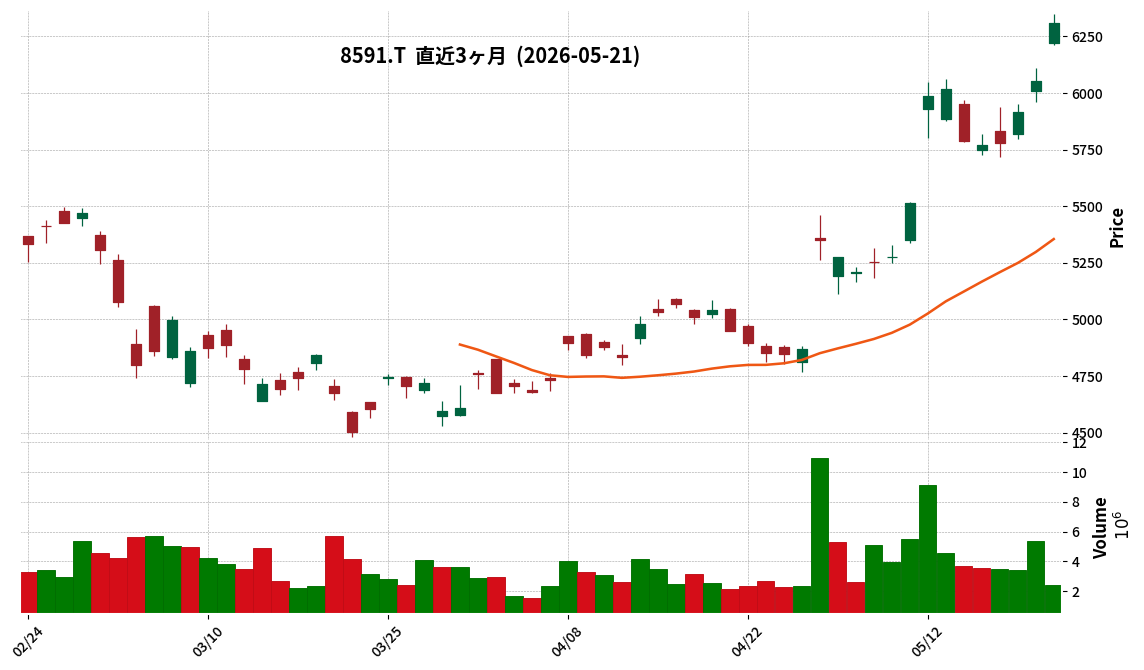
8591|オリックス
6307.0
▲ +4.21%
This article is an AI-generated summary and analysis of official IR disclosures.
📄 Announcement (AI-Reviewed)
- Orix announced an update regarding the impact of Toshiba Corporation’s full-year financial results for the fiscal year ended March 2026 on Orix’s consolidated financial results for Q1 FY2027.
- Based on Toshiba’s gains from Kioxia Holdings Corporation-related stock sales and valuation recorded in Q4 FY2026, Orix estimated the impact using the Q4 FY2026 performance outlook of TB Investment Business Limited Partnership (TB Investment LP) and Orix’s LP investment ratio.
- As a result, Orix expects to record approximately ¥179.8 billion in “equity method investment gain” before tax in Q1 FY2027.
- This is estimated to result in an additional positive impact of approximately ¥70 billion on net profit attributable to Orix shareholders for Q1 FY2027, compared to the previously announced consolidated earnings forecast for FY2027.
- However, Orix stated that this amount is an estimate based on TB Investment LP’s Q4 FY2026 performance outlook, and it is currently difficult to revise the full-year forecast as the impact of Toshiba-related investment gains or losses on the full-year consolidated results for FY2027 will fluctuate due to Toshiba’s future financial results, Toshiba’s buying and selling of Kioxia shares, and other factors.
🤖 AI Perspective
This announcement indicates that Orix anticipates recording a significant equity method investment gain in Q1 FY2027, stemming from Toshiba’s Kioxia-related profits, which could provide a temporary boost to Orix’s Q1 performance. However, the full-year consolidated earnings impact remains uncertain, suggesting that investors should monitor Toshiba’s future movements and Kioxia-related transactions. It is important for investors to note that this estimate is based on specific Q1 factors and that further updates on the full-year forecast may be forthcoming.
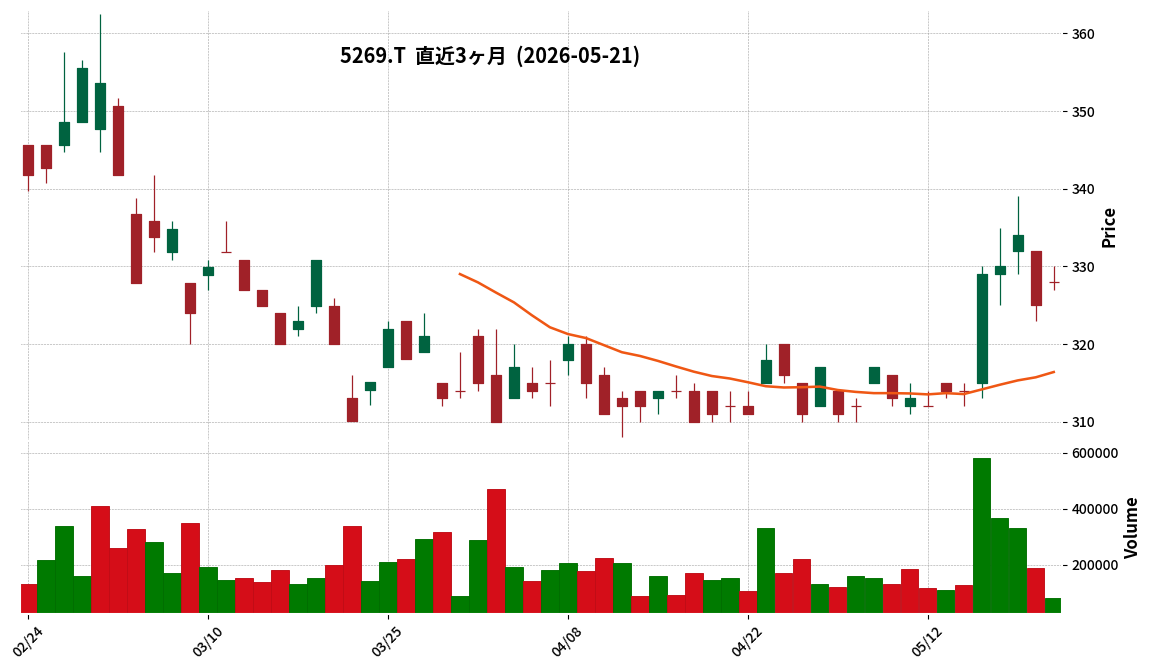
5269|日コンクリ
328.0
▲ +0.92%
This article is an AI-generated summary and analysis of official IR disclosures.
📄 Announcement (AI-Reviewed)
- Nikko Concrete’s consolidated net sales for the fiscal year 2025 were ¥49,233 million, a 6.5% decrease from the previous year.
- Consolidated operating profit was ¥322 million, representing a 67.4% decrease year-on-year.
- Net profit attributable to owners of the parent turned profitable at ¥684 million, a significant improvement from the ¥209 million loss in the prior fiscal year.
- Sales decrease was attributed to struggles in securing large orders and project delays in the foundation business, as well as inspection delays for the Linear Chuo Shinkansen project in the civil engineering products business.
- The swing to net profit was primarily driven by approximately ¥770 million in extraordinary gains, mainly from the sale of policy-held shares.
🤖 AI Perspective
The FY2025 full-year results showed a significant decline in both net sales and operating profit, falling short of both prior year figures and initial forecasts. This can be attributed to challenges in the foundation business and delays in a major civil engineering project. However, the one-time gain from the sale of policy-held shares played a crucial role in returning net profit to the black. Investors may monitor the company’s ability to secure new projects and manage existing project timelines for future performance.
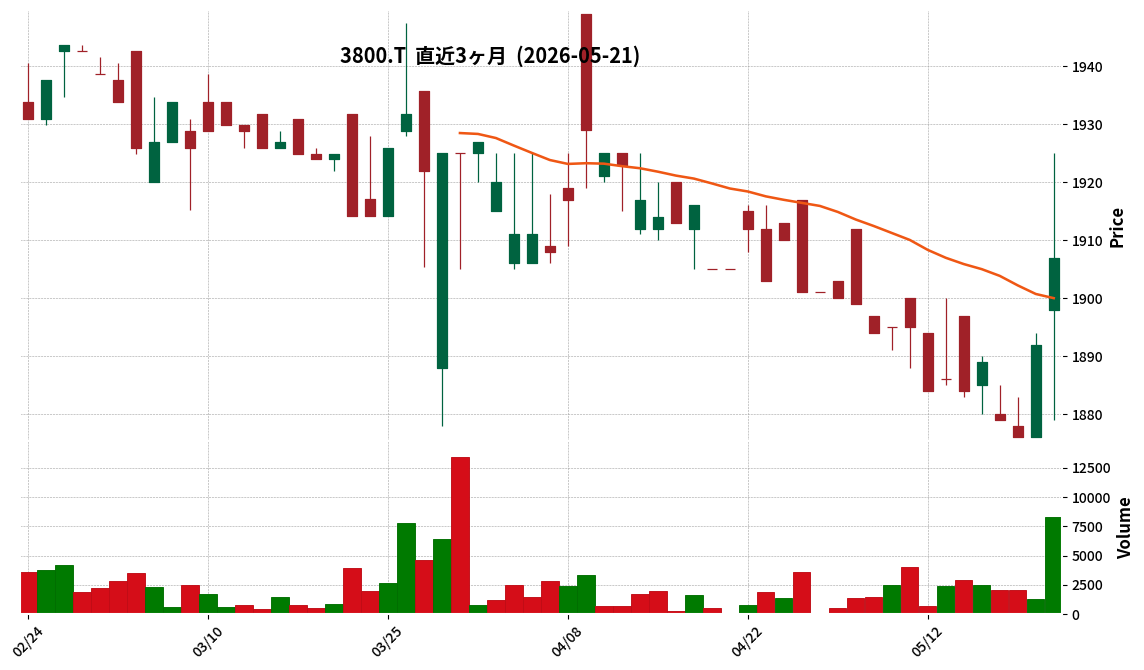
3800|ユニリタ
1907.0
▲ +0.79%
This article is an AI-generated summary and analysis of official IR disclosures.
📄 Announcement (AI-Reviewed)
- Unirita Co., Ltd. resolved to change its shareholder benefit program at a Board of Directors meeting held on May 21, 2026.
- The new shareholder benefit program will apply to shareholders listed or recorded in the shareholder registry as of the end of March 2027.
- The change aims to express gratitude to shareholders, enhance investment appeal, and encourage broader share ownership.
- The current point system will be replaced with “Digital Gift®” provided by Digital Plus Co., Ltd.
- The value of the Digital Gift® to be awarded ranges from 2,000 yen to 18,000 yen, depending on the number of shares held, with new, more detailed tiers for holdings of 600 shares or more, up to 18,000 yen for 1,000 shares or more.
🤖 AI Perspective
The announced changes to Unirita’s shareholder benefit program appear to prioritize convenience and expanded choices for shareholders. The transition from a point system to “Digital Gift®,” offering selections from various digital gift options, could enhance the usability of the benefits for shareholders. Additionally, the refinement of tiers for shareholders holding 600 shares or more, with a maximum of 18,000 yen for 1,000 shares or more, might signal a focus on rewarding long-term shareholders.
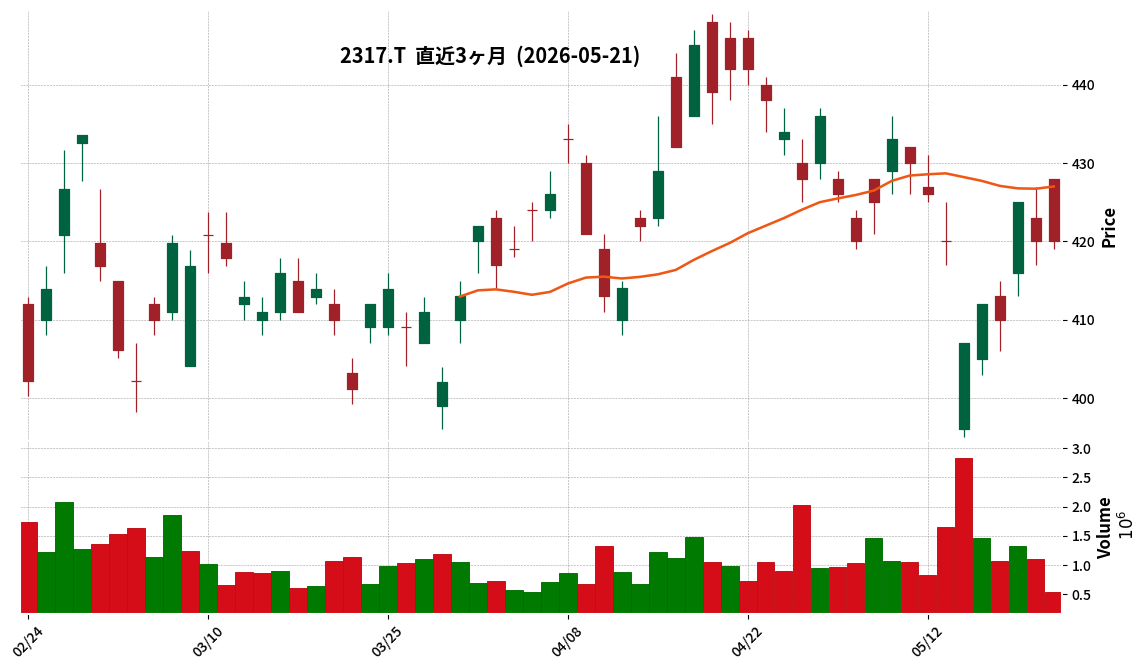
2317|システナ
420.0
▲ +0.00%
This article is an AI-generated summary and analysis of official IR disclosures.
📄 Announcement (AI-Reviewed)
- Systena Corporation announced its consolidated financial results for the fiscal year ended March 2026.
- For FY2026/3, consolidated net sales were ¥94,400 million, operating profit was ¥15,367 million, ordinary profit was ¥16,145 million, and profit attributable to owners of parent was ¥11,312 million.
- Compared to the previous fiscal year (FY2025/3), net sales increased by 12.9%, operating profit by 27.3%, ordinary profit by 36.2%, and profit attributable to owners of parent by 33.4%.
- The equity ratio stood at 64.9% (as of March 31, 2026), and the debt-to-equity ratio was 3.91% (as of the same date).
- The company stated it continued to build up recurring revenue businesses to stabilize its revenue base and concentrated resources on high-margin areas such as generative AI implementation support and DX promotion.
🤖 AI Perspective
The reported double-digit growth in sales and all profit stages for the fiscal year 2026/3 suggests an improvement in the company’s profitability. The emphasis on enhanced productivity and allocation of resources to high-margin areas could indicate a strategic focus on efficiency and value creation. The improvement in the equity ratio may also be noted as a positive sign regarding financial stability.
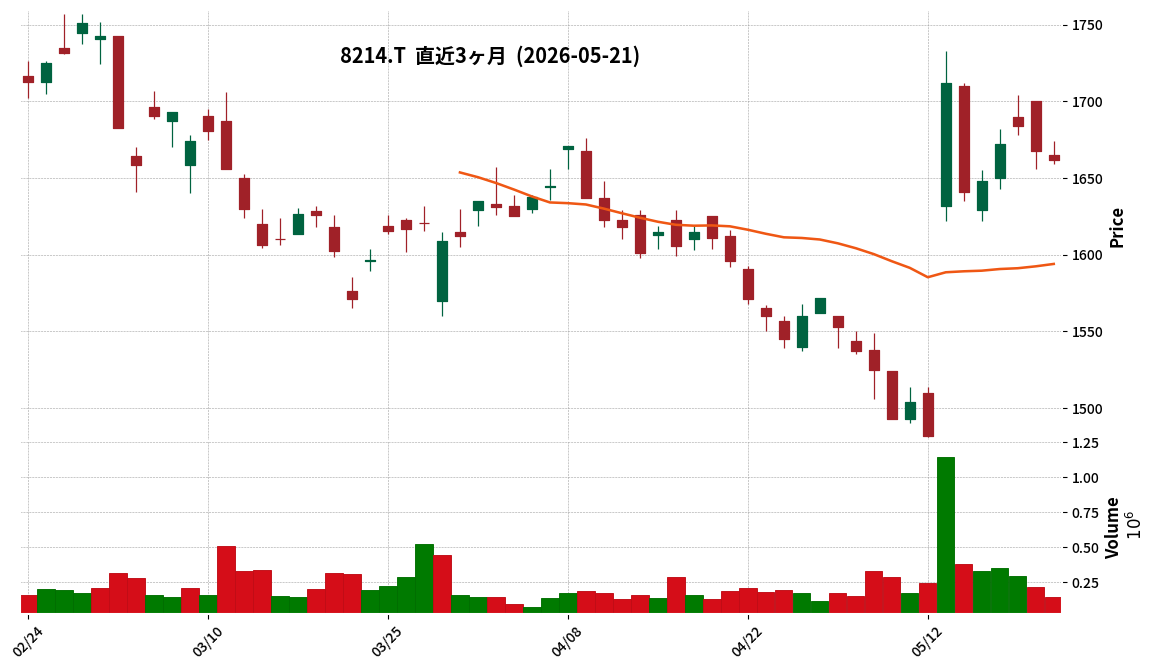
8214|AOKI HD
1662.0
▼ -0.36%
📎 Source:AOKI HD Official IR →
This article is an AI-generated summary and analysis of official IR disclosures.
📄 Announcement (AI-Reviewed)
- AOKI Holdings, Inc. reported consolidated net sales of ¥194.5 billion (up 101.0% year-on-year), operating income of ¥16.9 billion (up 108.3%), and ordinary income of ¥16.3 billion (up 110.7%) for the fiscal year ended March 2026, marking five consecutive years of increased revenue and profit.
- Net income attributable to owners of the parent decreased by 98.8% year-on-year to ¥9.4 billion, primarily due to a decrease in extraordinary gains and an increase in income tax expenses.
- By segment, the Entertainment business achieved its fifth consecutive year of revenue growth and record-high profit. The Anniversaire Bridal business also reported increased revenue and profit. The Fashion business saw revenue growth but a decrease in profit.
- For the fiscal year ending March 2027, the company forecasts consolidated net sales of ¥200.0 billion (up 102.8% year-on-year), operating income of ¥18.0 billion (up 106.2%), ordinary income of ¥17.5 billion (up 106.9%), and net income attributable to owners of the parent of ¥10.0 billion (up 105.7%), projecting record-high sales and six consecutive years of profit growth.
- As of March 31, 2026, consolidated total assets stood at ¥225.4 billion (down ¥7.5 billion from the previous year-end), and net assets were ¥145.2 billion (up ¥3.0 billion). While cash and deposits decreased, tangible fixed assets increased due to new store openings.
🤖 AI Perspective
AOKI Holdings’ consistent growth over the past five years appears to be driven by the strong performance of its Entertainment and Anniversaire Bridal segments. The decrease in net income attributable to owners of the parent, despite operating and ordinary profit growth, suggests a shift in the composition of earnings, with a reduction in extraordinary gains and higher tax expenses. The positive outlook for FY2027/3, forecasting record sales and a sixth consecutive year of profit growth, may indicate confidence in their strategic initiatives and the ongoing progress of the “RISING2026” medium-term management plan. Investors might consider these factors when evaluating the company’s future performance.
231A|Q-Cross E
—
▲ +0.00%
📎 Source:Q-Cross E Official IR →
This article is an AI-generated summary and analysis of official IR disclosures.
📄 Announcement (AI-Reviewed)
- For the interim period of FY2026 (October 1, 2025 – March 31, 2026), Q-Cross E reported net sales of ¥1,893,980 thousand, a 29.0% decrease year-over-year, and operating profit of ¥270,745 thousand, a 44.8% decrease year-over-year.
- Key factors for the decrease in sales include delays in new orders within the industrial machinery installation sector, postponement of large projects in the construction and structure construction sector, and a reactionary decline following the completion of large projects in the previous period.
- The decline in operating profit is primarily attributed to the reactionary decrease in high-gross-margin large projects and increased personnel costs from hiring 25 engineers in the previous period.
- On the balance sheet, total fixed assets increased from ¥593,635 thousand to ¥1,142,453 thousand, and goodwill increased from ¥26,069 thousand to ¥134,441 thousand, mainly due to the acquisition of Kyoshin Densetsu Kogyo Co., Ltd.
- The “Solar Power Generation Business” segment was added due to the acquisition of Kyoshin Densetsu Kogyo Co., Ltd., contributing ¥40,054 thousand in sales during the interim period.
- Progress against full-year forecasts shows sales at 40.6% and operating profit at 56.3%; sales progress is slower than anticipated due to the postponement of large project consideration periods.
🤖 AI Perspective
Q-Cross E’s H1 FY2026 results show a decline in both sales and profit compared to the previous year, largely impacted by delays in large projects and a reactionary downturn in the construction and machinery installation business. However, the acquisition of Kyoshin Densetsu Kogyo Co., Ltd. introduces a new revenue stream through the solar power generation business, indicating a strategic expansion of its business portfolio. While sales progress against full-year forecasts is behind schedule, the operating profit is progressing favorably due to thorough cost management. Investors may want to monitor the company’s ability to execute delayed projects and manage costs in the coming periods.
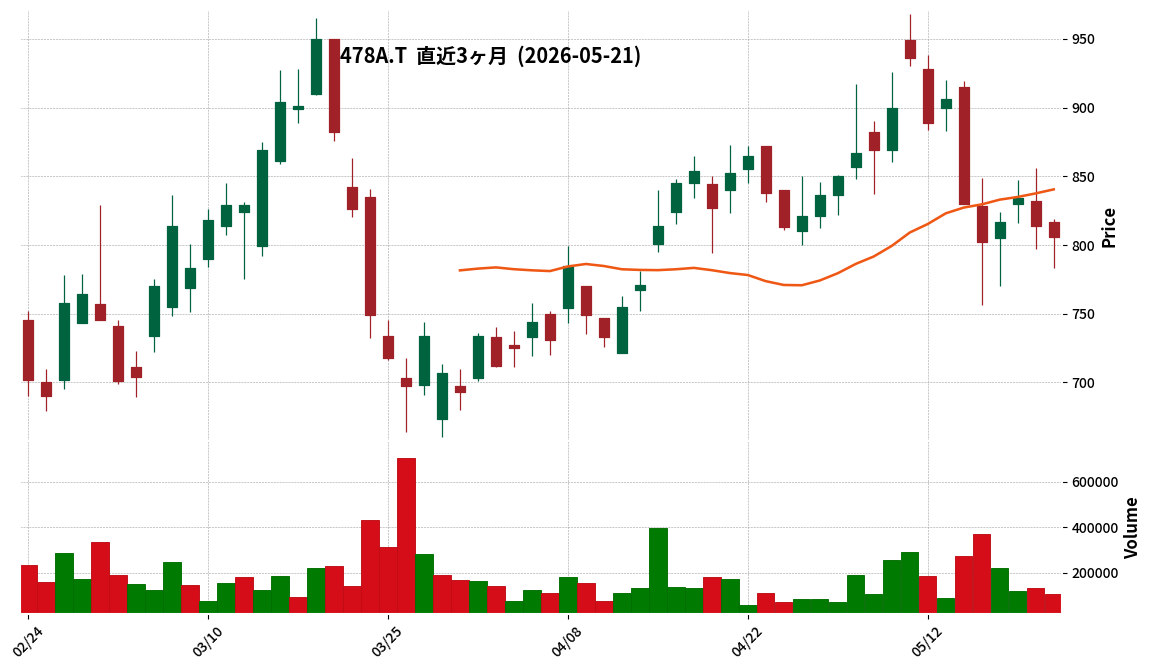
478A|G-フツパー
806.0
▼ -0.98%
This article is an AI-generated summary and analysis of official IR disclosures.
📄 Announcement (AI-Reviewed)
- G-HUTZPER published a Q&A document on May 21, 2026, addressing investor questions regarding its Q1 FY2026 financial results.
- The company aims for simultaneous growth in sales and order backlog, stating that order backlogs are generally delivered within the current fiscal year.
- The large-scale NEDO project was largely factored into the current fiscal year’s plan, and an immediate revision to earnings forecasts is not anticipated.
- Recruitment is progressing as planned, with hiring costs suppressed through the use of SNS and referrals, resulting in a net increase of 8 employees year-on-year.
- The Thailand駐在員事務所 has already secured orders, which are expected to contribute positively to mid-to-long-term performance.
- A Customer Support (CS) department was established in April 2024 with dedicated staff, aiming to build a hybrid support system.
🤖 AI Perspective
G-HUTZPER’s Q&A provides insights into its business growth strategy and current progress. The objective of simultaneous sales and order backlog growth, along with the function of order backlog as a leading indicator, could suggest confidence in sustained business expansion and offers key information for evaluating future performance. Specific developments such as securing the NEDO project, initiating orders in Thailand, steady recruitment, and establishing a new CS department, may indicate a proactive approach to strengthening the business foundation and expanding market presence.
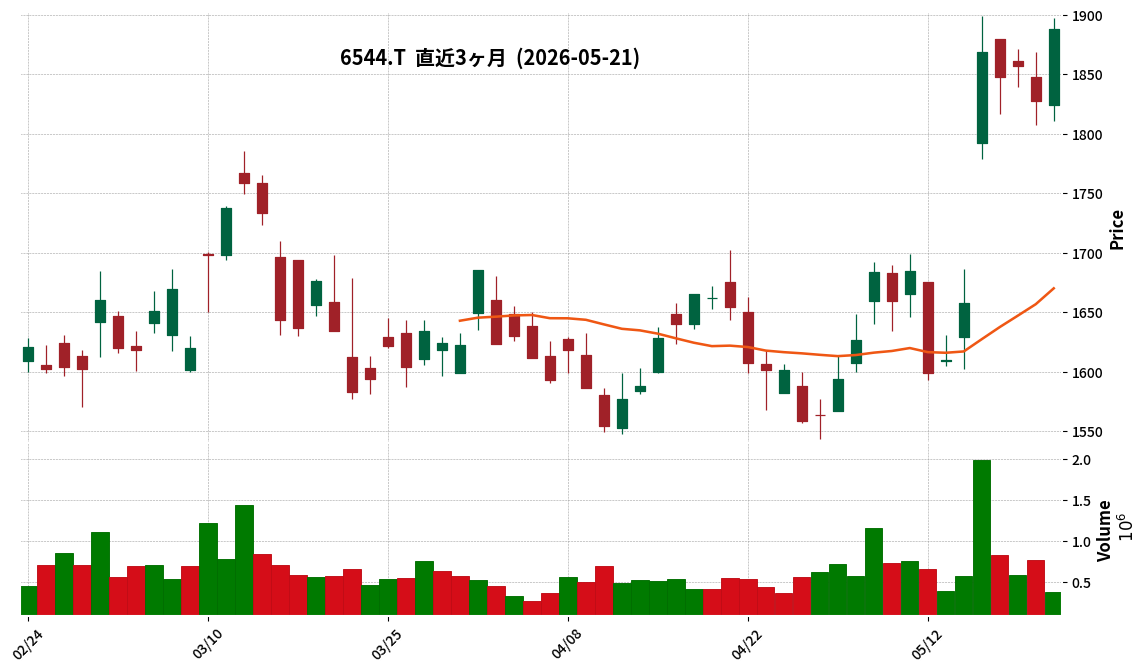
6544|JESHD
1888.0
▲ +3.28%
This article is an AI-generated summary and analysis of official IR disclosures.
📄 Announcement (AI-Reviewed)
- As of March 31, 2026, the number of domestic maintenance contracts reached 126,840 units, achieving a net increase of approximately 13,320 units year-on-year.
- Market share expanded by over 1 percentage point within the year, reaching approximately 11% (estimated).
- For the fiscal year ended March 2026, the company achieved record-high performance for the ninth consecutive year since its listing in 2017, with consolidated net sales of ¥57.6 billion (up 16.7% year-on-year), operating profit of ¥11.0 billion (up 27.7% year-on-year), and net profit of ¥7.3 billion (up 32.4% year-on-year).
- The planned dividend for the fiscal year ended March 2026 is ¥21 (after stock split adjustment), an increase of ¥5.5 from the previous fiscal year, with a projected dividend payout ratio of 51.2%. The company maintains a dividend payout ratio policy of 40% or more.
- The Mid-Term Management Plan VISION2027 is expected to exceed all targets, with the FY2027/3 performance forecast projecting net sales of over ¥60.0 billion and an operating profit margin before amortization of goodwill of over 20%.
🤖 AI Perspective
JESHD’s announcement suggests that the steady increase in domestic maintenance contracts and the corresponding expansion of market share are underpinning the company’s continuous growth. The consistent achievement of record-high performance since listing and the projected over-achievement of mid-term management plan targets could indicate the effectiveness of its business strategies in the current market environment. The commitment to a dividend payout ratio of 40% or more may be viewed as a sign of a stable approach to shareholder returns.
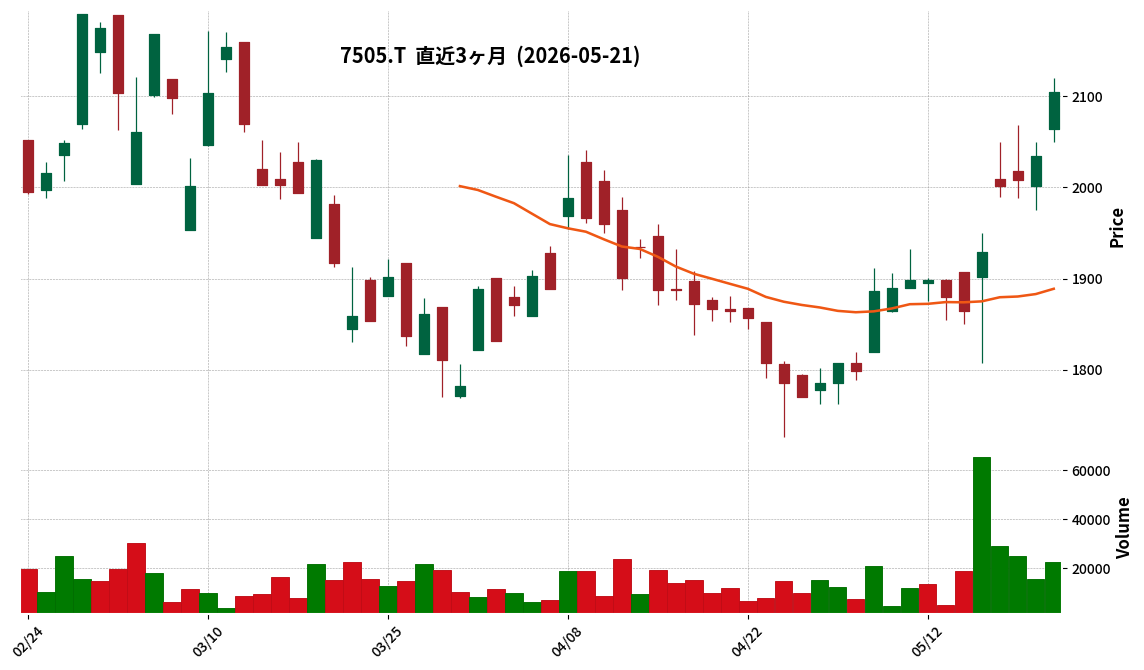
7505|扶桑電通
2105.0
▲ +3.49%
This article is an AI-generated summary and analysis of official IR disclosures.
📄 Announcement (AI-Reviewed)
- Fuso Dentsu announced its Q2 FY2026 (interim) financial results, reporting net sales of ¥35.26 billion (up 26.1% YoY) and operating profit of ¥3.37 billion (up 62.6% YoY).
- Key drivers for revenue growth included large projects in the healthcare business, robust performance in local government businesses such as disaster prevention and mitigation, and strong sales of security-enhanced PCs and software for the power industry.
- The consolidated full-year forecast for FY2026 has been revised upwards, with net sales projected to increase from ¥55.00 billion to ¥59.30 billion, and operating profit from ¥2.20 billion to ¥3.58 billion.
- The year-end dividend forecast for FY2026 has been revised from ¥79.50 per share to ¥81.50 per share, leading to an expected annual dividend of ¥89.00 per share.
- The company consolidated System Make Co., Ltd. as a subsidiary on December 22, 2025, transitioning to consolidated financial statements from the current period.
🤖 AI Perspective
The interim results highlight significant growth driven by the healthcare and local government sectors, contributing to substantial increases in both revenue and profit. The upward revision of the full-year consolidated forecast and the increased year-end dividend could be viewed positively by investors, potentially indicating confidence in future performance. The improvement in gross profit margin alongside increased sales appears to be a key factor in the operating profit growth, suggesting a potential enhancement in profitability.
Disclaimer: This article is for informational purposes only and does not constitute investment advice.
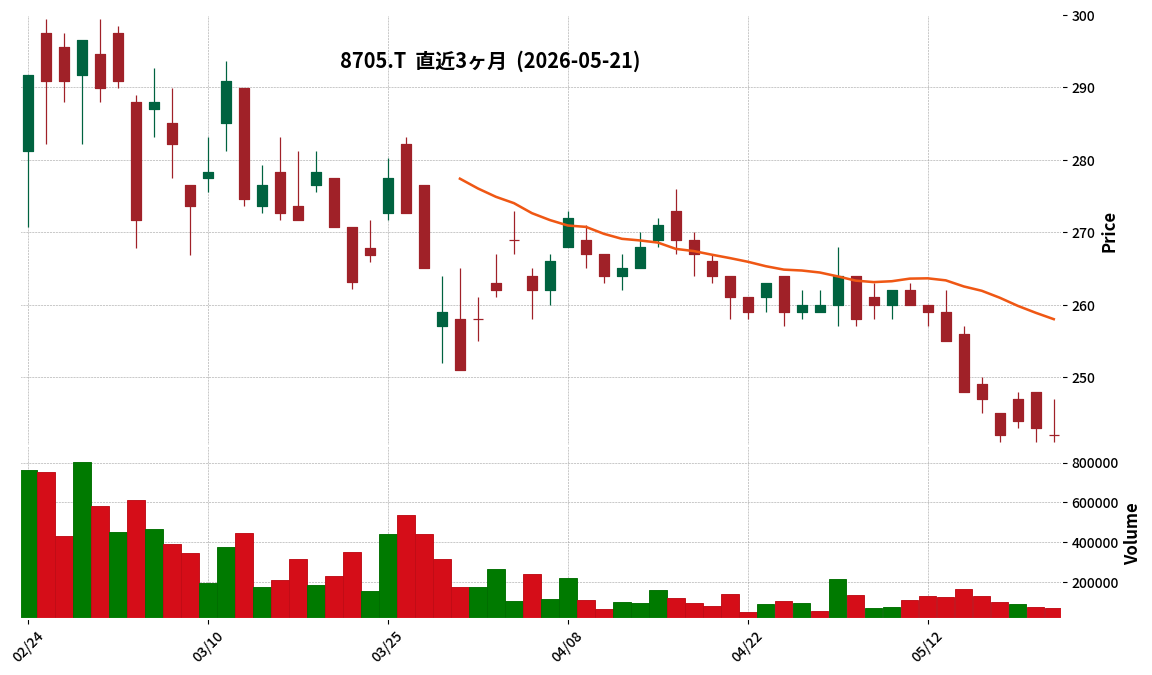
8705|日産証券グループ
242.0
▼ -0.41%
📎 Source:日産証券グループ Official IR →
This article is an AI-generated summary and analysis of official IR disclosures.
📄 Announcement (AI-Reviewed)
- Nissan Securities Group Co., Ltd. announced the financial results for the fiscal year ended March 31, 2026 (April 1, 2025 – March 31, 2026) of its unlisted parent company (other affiliated company), NSHD Inc.
- NSHD Inc.’s business activity is the holding and operation of securities, with a capital of 1,001 thousand yen as of March 31, 2026.
- As of March 31, 2026, the total number of issued shares was 20,020, with individuals and others owning 100.00%. The major shareholders comprise five individual shareholders, including Representative Director and President Hideaki Nika (25.02%).
- The balance sheet as of March 31, 2026, shows total assets of 6,217,036 thousand yen and total net assets of 6,086,005 thousand yen.
- For the fiscal year ended March 2026, the income statement reports operating revenue of 130,340 thousand yen, ordinary income of 96,930 thousand yen, and net income of 464,225 thousand yen.
🤖 AI Perspective
This IR disclosure provides financial information on NSHD Inc., the unlisted parent company of the publicly traded Nissan Securities Group. Given that NSHD Inc.’s business involves holding and operating securities, its financial results could offer valuable insights into the broader business environment and capital strategy of the Nissan Securities Group. The reported net income of 464,225 thousand yen and substantial net assets relative to its capital base may suggest a stable asset foundation for the parent company.
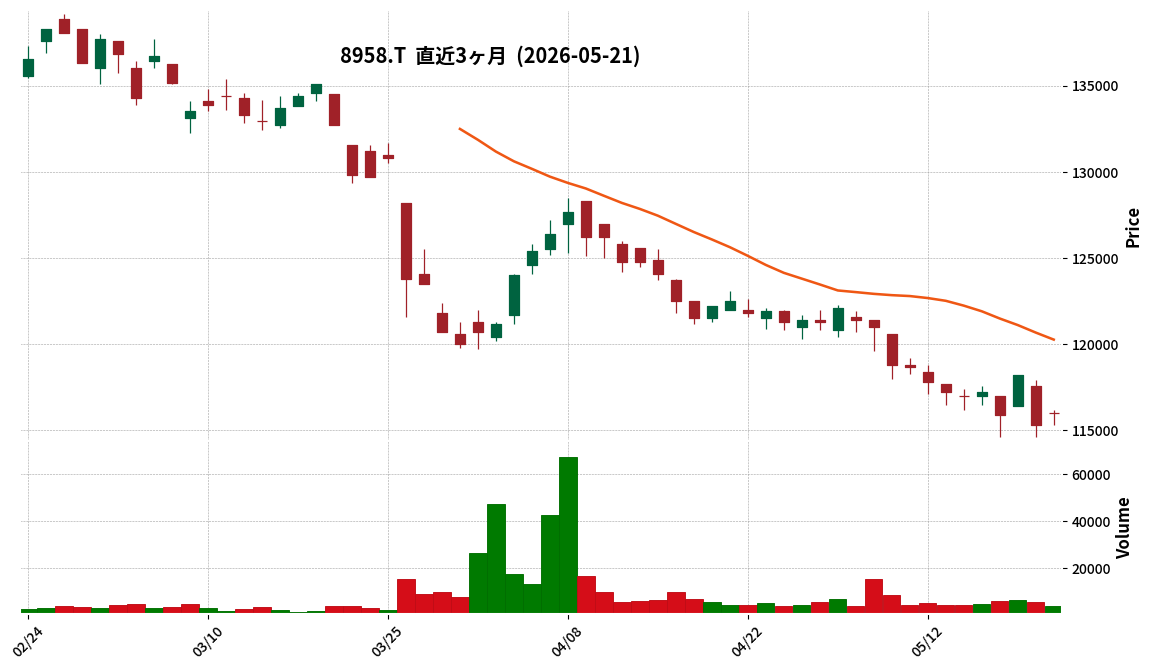
8958|R-グロバル
116000.0
▲ +0.61%
This article is an AI-generated summary and analysis of official IR disclosures.
📄 Announcement (AI-Reviewed)
- R-グロバル announced its financial results for the fiscal year ended March 2026 (October 1, 2025 – March 31, 2026).
- For the current period, operating revenue was ¥7,544 million (down 6.7% YoY), operating income ¥4,595 million (down 9.2% YoY), ordinary income ¥3,976 million (down 13.8% YoY), and net income ¥3,975 million (down 13.8% YoY).
- Net income per unit was ¥4,088, and distribution per unit (excluding excess distributions) was ¥3,681.
- Regarding the financial position, total assets stood at ¥237,885 million, net assets at ¥99,935 million, and the equity ratio at 42.0%.
- For the forecast of the September 2026 period, operating revenue is projected at ¥8,014 million with a distribution per unit of ¥3,200, and for the March 2027 period, operating revenue is projected at ¥7,964 million with a distribution per unit of ¥3,200.
🤖 AI Perspective
R-グロバル reported a decrease in key financial metrics for the fiscal year ended March 2026 compared to the previous period. This could be influenced by the performance of existing properties, as well as the asset portfolio restructuring carried out during the period, including partial disposals of Arkacentral and Yokohama Plaza Building, and acquisitions of a portion of Meiji Yasuda Life Osaka Umeda Building, Fukuoka K Square, Lucid Square Shin-Osaka, and GRAND CENTRAL CHIBA. While the next period’s operating revenue forecast shows an increase, the distribution per unit is expected to decrease, making future asset acquisition and disposal strategies and rental market trends worth monitoring.
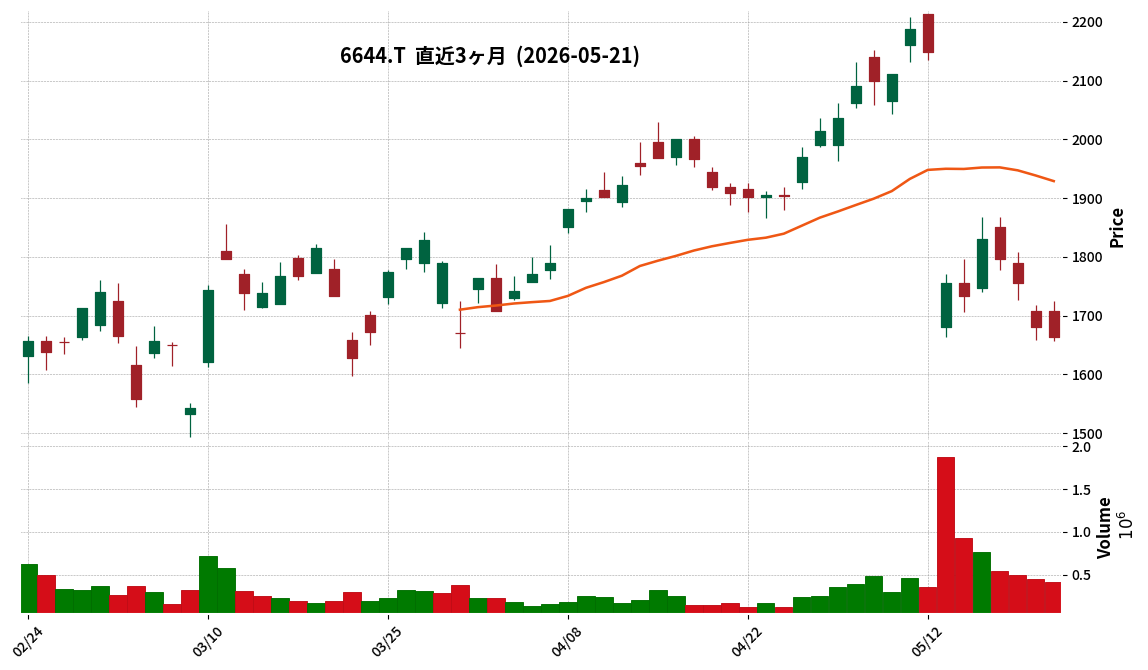
6644|大崎電
1663.0
▼ -1.01%
This article is an AI-generated summary and analysis of official IR disclosures.
📄 Announcement (AI-Reviewed)
- Osaki Electric Co., Ltd. announced a correction to a part of its “Consolidated Financial Results for the Fiscal Year Ended March 31, 2026,” originally published on May 12, 2026.
- The reason for the correction was the discovery of errors in the descriptions within “Consolidated Cash Flow Status,” “Overview of Current Period Cash Flow,” and “Consolidated Cash Flow Statement.”
- The corrections primarily involve “Cash flows from financing activities” and “Foreign currency translation adjustments on cash and cash equivalents.”
- For the fiscal year ended March 31, 2026, “Cash flows from financing activities” were revised from an outflow of △5,828 million yen to an outflow of △8,807 million yen.
- The revised financing cash outflow factors include a net decrease in short-term borrowings of 3,237 million yen, repayment of long-term borrowings of 2,978 million yen, expenditure for acquisition of treasury shares of 1,031 million yen, and dividends paid of 1,387 million yen.
- “Foreign currency translation adjustments on cash and cash equivalents” were revised from △2,539 million yen to 439 million yen.
🤖 AI Perspective
This correction primarily impacts the financing activities and translation adjustments within the cash flow statement. The inclusion of long-term debt repayments indicates a larger outflow from financing activities than initially reported. While the corrected figures do not change the year-end cash and cash equivalents balance, investors may find it useful to review the updated breakdown to understand the underlying cash movements and the company’s financial management activities.
1807|佐藤渡辺
1819.0
▼ -0.11%
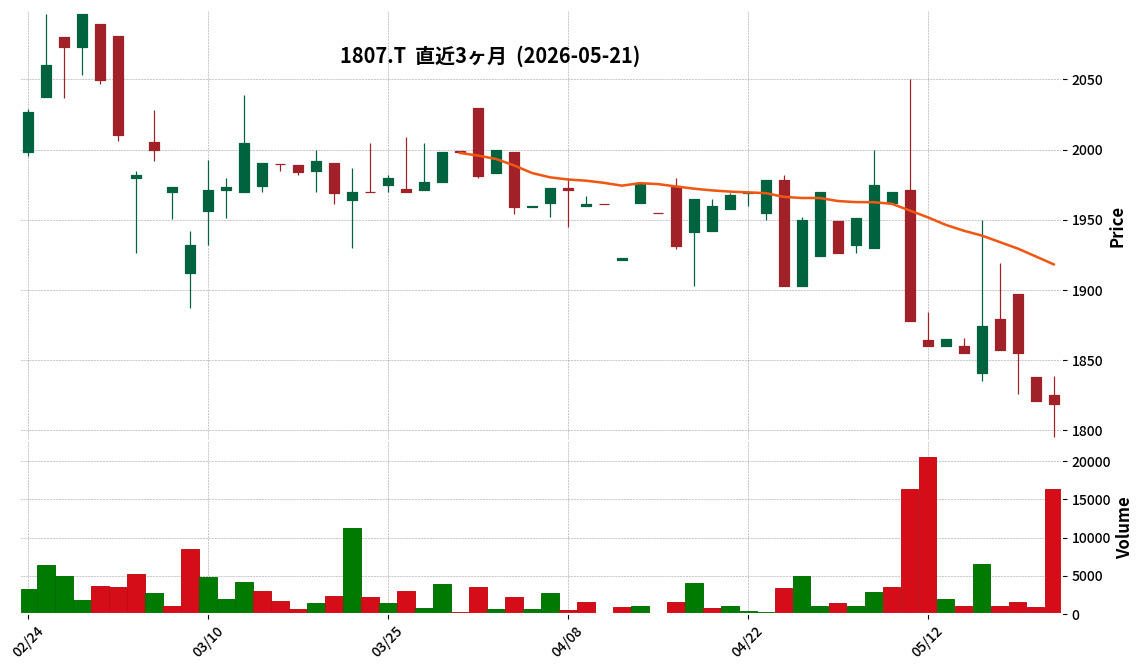
This article is an AI-generated summary and analysis of official IR disclosures.
📄 Announcement (AI-Reviewed)
- Sato Watanabe Co., Ltd. reported consolidated net sales of 33,704 million yen for the fiscal year ended March 2026, falling short of the initial forecast of 37,000 million yen.
- Operating income was 1,070 million yen, which was below the initial forecast of 1,200 million yen.
- Conversely, ordinary income reached 1,369 million yen and net income was 883 million yen, both exceeding the initial forecasts of 1,300 million yen and 850 million yen, respectively.
- The primary reason for net sales falling below the initial forecast was attributed to delays in order placement in the construction division due to the impact of administrative actions.
- Despite this, the company maintained gross profit comparable to the previous year through diligent efforts to improve profitability, and recorded ordinary income and net income above initial forecasts due to factors such as the recognition of non-operating income.
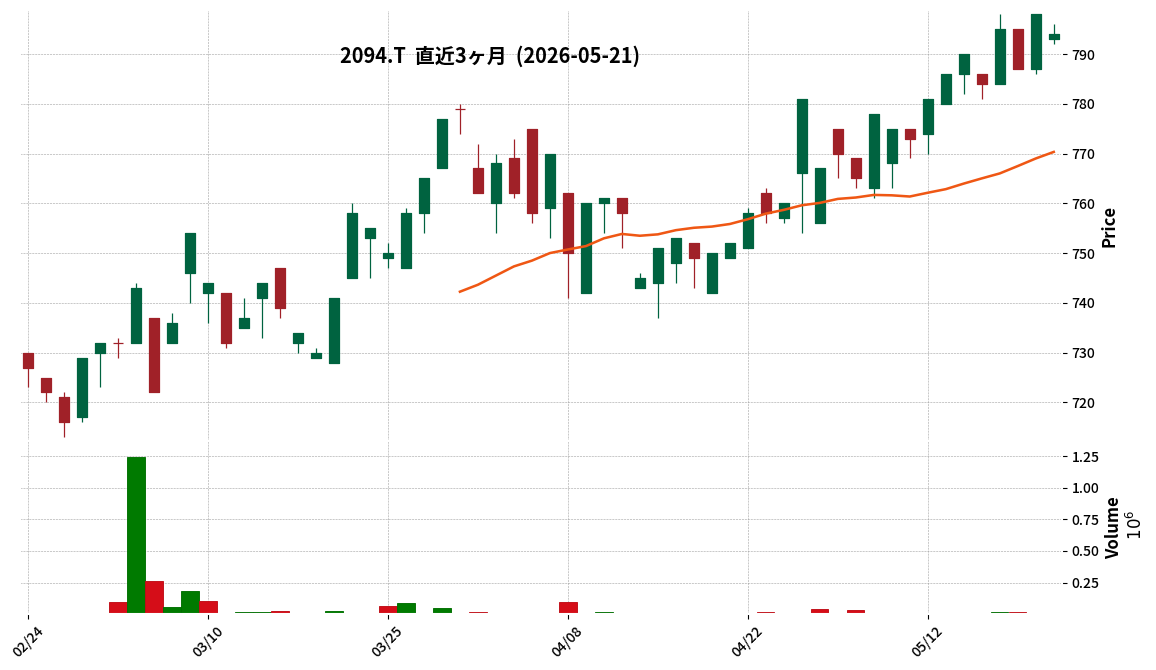
2094|REITインバース
794.0
▼ -0.50%
📎 Source:REITインバース Official IR →
This article is an AI-generated summary and analysis of official IR disclosures.
📄 Announcement (AI-Reviewed)
- REIT Inverse (Code: 2094) announced its interim financial results for the first half of fiscal year 2026, covering the period from October 13, 2025, to April 12, 2026.
- Net assets at the end of the interim period totaled ¥466 million, compared to ¥1,210 million at the end of FY2025.
- The net asset value (NAV) per unit was ¥753, a decrease from ¥786 at the end of FY2025.
- Units outstanding at the end of the interim period were 620 thousand, down from 1,540 thousand at the end of the prior period, with 1,420 thousand units set and 2,340 thousand units redeemed.
- The primary investment asset remains public and corporate bonds, accounting for ¥357 million (76.7% of total assets) in the interim period ended April 2026.
- The interim net loss for the period was △¥38,099,074.
🤖 AI Perspective
The interim results for REIT Inverse indicate a notable decrease in both net assets and NAV per unit, primarily driven by a significant reduction in units outstanding due to redemptions exceeding subscriptions. Given its mandate to track the inverse of the TSE REIT Index, the fund’s performance is closely tied to the real estate market in Japan. Investors might want to monitor how this fund’s strategy of mainly holding public and corporate bonds interacts with the inverse REIT index’s movements, particularly in the context of broader economic shifts.
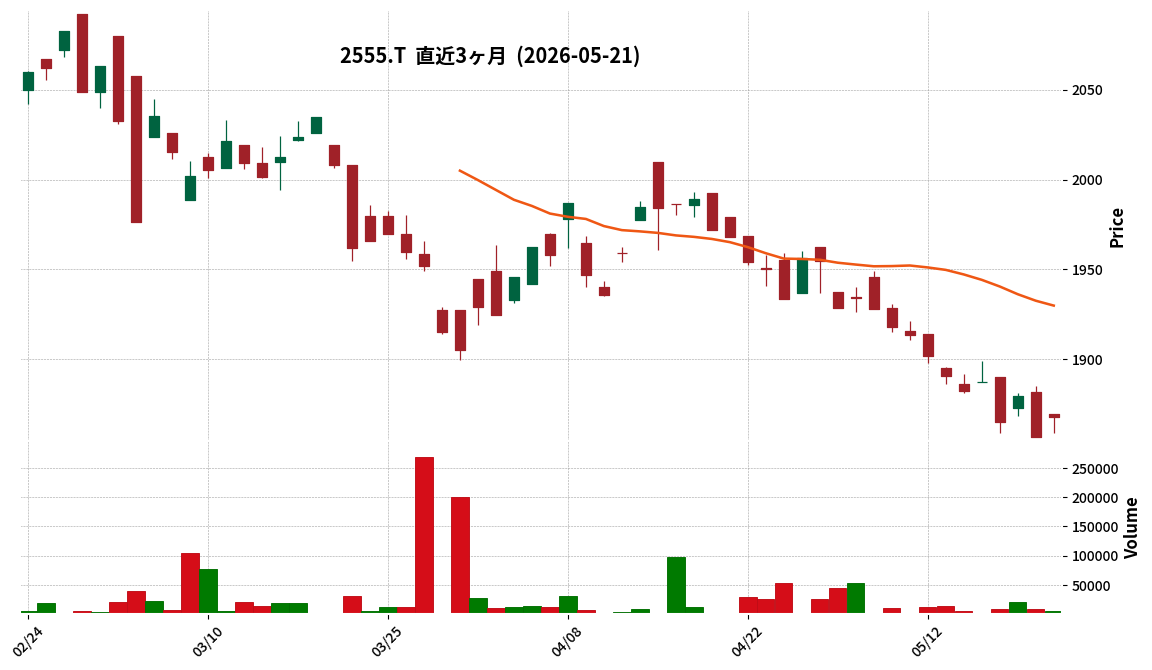
2555|東証REIT-ETF
1868.0
▲ +0.62%
📎 Source:東証REIT-ETF Official IR →
This article is an AI-generated summary and analysis of official IR disclosures.
📄 Announcement (AI-Reviewed)
- TOKYO REIT ETF (Code: 2555) announced its financial results for the April 2026 fiscal period (October 13, 2025 – April 12, 2026).
- The number of outstanding units at the end of the period was 32,843 thousand units.
- Total net assets amounted to ¥64,623,459,553, and the net asset value per 10 units was ¥19,676.
- The dividend per 10 units was announced as ¥230, with the dividend payment scheduled to begin on May 21, 2026.
- The main investment asset is real estate investment trust securities, accounting for 98.8% of assets (¥63.836 billion).
🤖 AI Perspective
The announced financial results for the April 2026 period provide concrete figures regarding the fund’s net assets and dividends per 10 units, which are crucial for investors evaluating the fund’s operational status. Compared to the previous period (October 2025), while net assets have decreased, the increase in dividends per 10 units may be noteworthy. These figures could offer insights into the fund’s stability and distribution policy for investors.
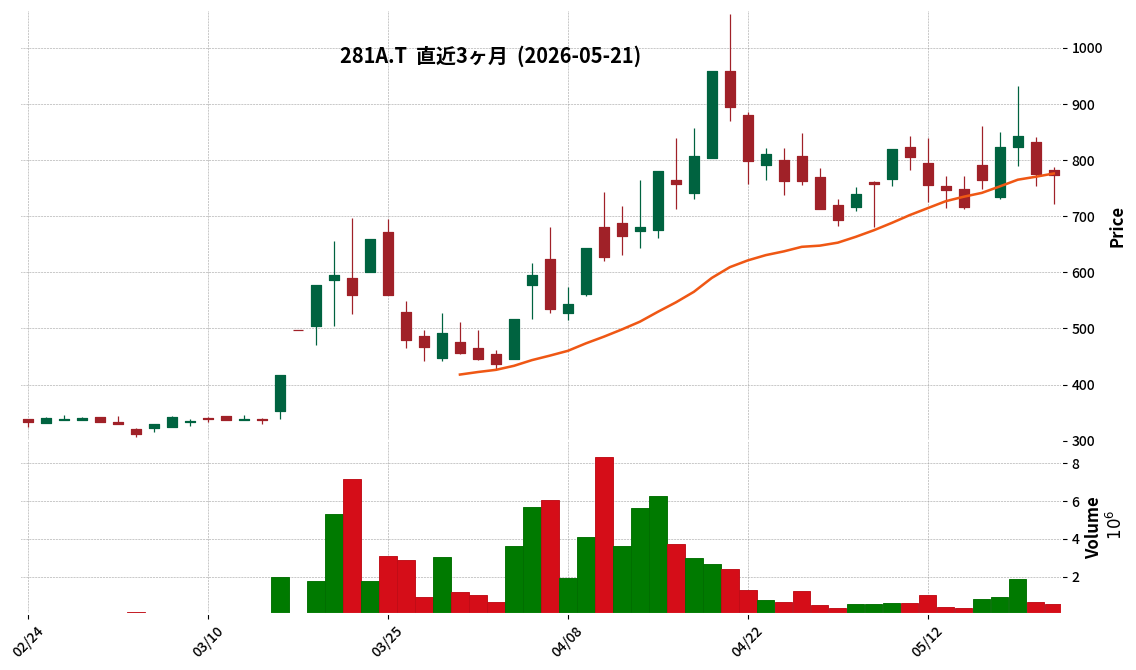
281A|G-インフォメティス
773.0
▼ -0.26%
📎 Source:G-インフォメティス Official IR →
This article is an AI-generated summary and analysis of official IR disclosures.
📄 Announcement (AI-Reviewed)
- G-Informetis reported Q1 FY2026 revenue of ¥203 million and gross profit of ¥144 million, representing year-over-year increases of 72.0% and 265.8% respectively.
- Ordinary profit for the first quarter was ¥2 million, turning profitable from an ordinary loss of ¥23 million in the same period last year.
- This turnaround to ordinary profit was supported by equity method investment income of approximately ¥73 million from equity method affiliate Energy Gateway Co., Ltd.
- The 9th series of share options with an exercise price adjustment clause, issued on December 22, 2025, were fully exercised by April 3, 2026, raising approximately ¥370 million.
- The company continues to maintain a ¥300 million borrowing under a special overdraft facility agreement with Mizuho Bank, aimed at stabilizing its financial base.
🤖 AI Perspective
G-Informetis achieving ordinary profit in Q1 FY2026 suggests a positive shift in the company’s profitability and overall earning capacity within the group. The significant contribution from equity method investment income highlights the strategic importance of its affiliates in driving consolidated earnings. Furthermore, the successful completion of equity financing and continued credit facilities may indicate a stable financial foundation for future business expansion, which could be a point of interest for investors monitoring the company’s growth trajectory.
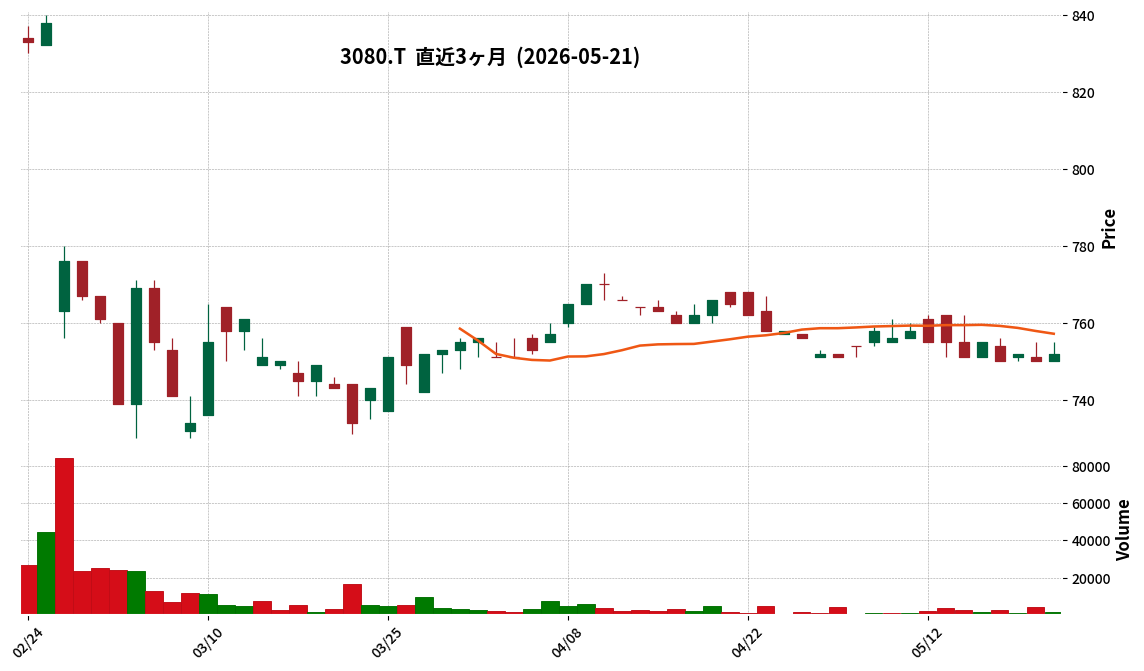
3080|ジェーソン
752.0
▲ +0.27%
This article is an AI-generated summary and analysis of official IR disclosures.
📄 Announcement (AI-Reviewed)
- Jason Co., Ltd.’s non-listed parent company, Ota Kogyo Co., Ltd., announced its financial results for the fiscal year ended February 2026 (March 1, 2025 – February 28, 2026).
- As of February 28, 2026, Ota Kogyo’s overview includes its name as Ota Kogyo Co., Ltd., its primary business as real estate leasing, and a capital of ¥100,000 thousand.
- Regarding the relationship between Jason and Ota Kogyo, Ota Kogyo holds 33.41% of Jason’s voting rights, and Jason’s Representative Director, Manzohiko Ota, also serves as Ota Kogyo’s Representative Director.
- Ota Kogyo’s consolidated balance sheet for the fiscal year ended February 2026 shows total assets of ¥6,770,798 thousand, total liabilities of ¥6,355,954 thousand, and total net assets of ¥414,844 thousand.
- Ota Kogyo’s consolidated statement of income for the fiscal year ended February 2026 reported net sales of ¥631,683 thousand, operating profit of ¥60,593 thousand, ordinary profit of ¥102,194 thousand, and net income of ¥101,143 thousand.
🤖 AI Perspective
The disclosure of financial results by a non-listed parent company of a listed entity provides crucial insights into the parent’s business performance and financial health, which may not be fully reflected in the consolidated financial statements. Given Ota Kogyo holds 33.41% of Jason’s voting rights, its financial performance, particularly in its primary business of real estate leasing, could be a factor in understanding the potential influence on Jason’s management policies and capital strategies. Investors may find it worthwhile to monitor the financial stability and performance of this significant shareholder.
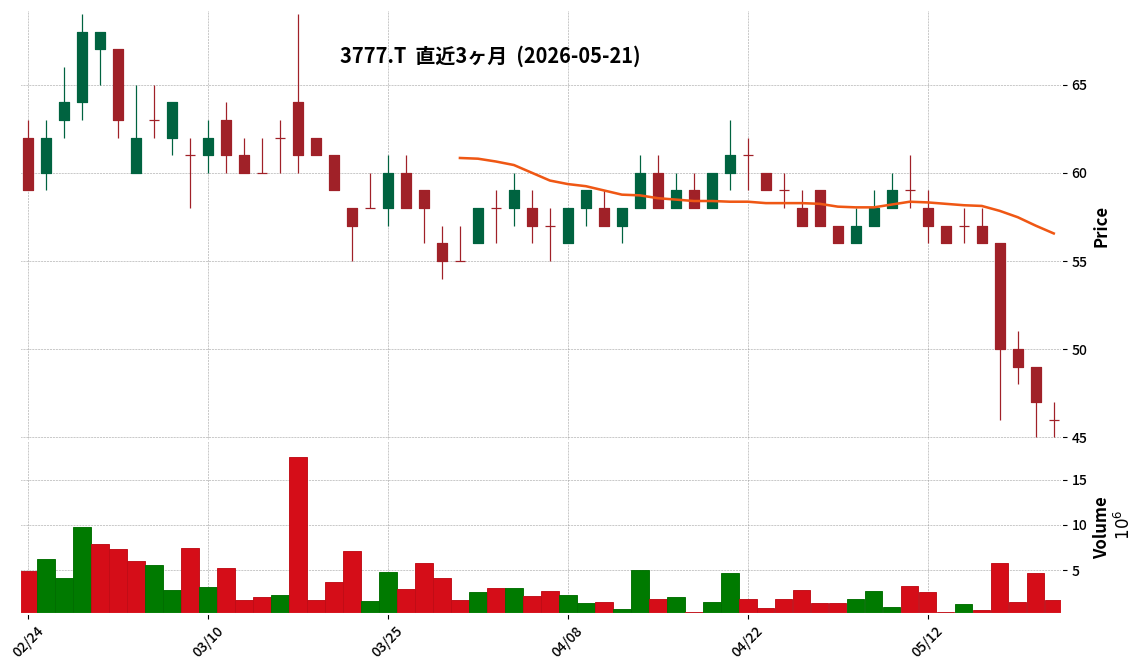
3777|G-環境フレンドリー
46.0
▼ -2.13%
📎 Source:G-環境フレンドリー Official IR →
This article is an AI-generated summary and analysis of official IR disclosures.
📄 Announcement (AI-Reviewed)
- G-Kankyo Friendly Holdings Co., Ltd. resolved to enter into a business alliance agreement with eScript Energy Co., Ltd. at its board meeting on May 21, 2026.
- This alliance aims to enhance G-Kankyo Friendly’s corporate value over the medium to long term, focusing on developing next-generation energy and digital infrastructure businesses based on renewable energy, specifically in mining, battery, and AI data center operations.
- eScript Energy possesses domestic business sites and is advancing into the energy and digital infrastructure sector with a growth strategy centered on crypto asset and power-related businesses.
- The collaboration includes cooperation on mining, battery, and AI data center businesses, as well as general shared matters such as examining power costs, equipment efficiency, planning introductions, designing power infrastructure, and sharing market trends.
- G-Kankyo Friendly plans to allocate 285,000 units (28,500,000 potential shares) of its 23rd Series Stock Acquisition Rights to eScript Energy. However, this is not a capital alliance, and no mutual acquisition of shares or other capital relationship will arise.
- The business commencement date for the alliance is scheduled for June 8, 2026.
🤖 AI Perspective
This business alliance could be a significant step for G-Kankyo Friendly in accelerating its expansion into the next-generation energy and digital infrastructure sectors. The combination of eScript Energy’s business sites and expertise in power-related operations with G-Kankyo Friendly’s business development capabilities may facilitate the concretization of projects in high-growth areas such as mining, battery storage, and AI data centers. However, investors should note that specific project implementations are not yet finally agreed upon and will be materialized through future discussions. Additionally, the impact on earnings is still under review and warrants close monitoring.
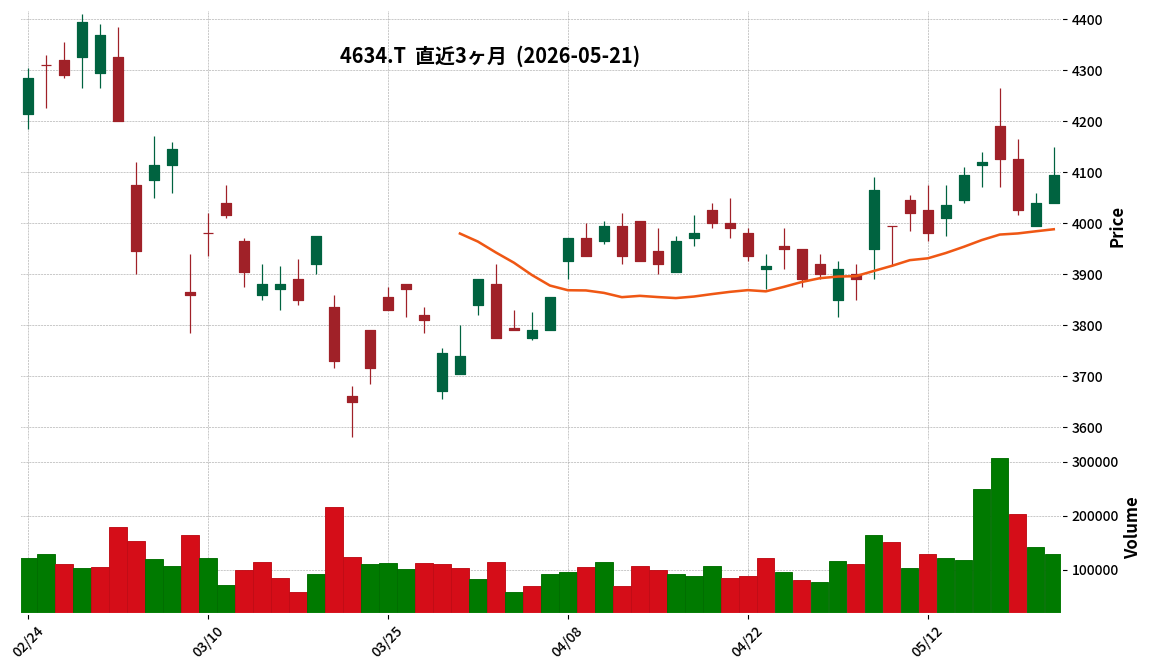
4634|artience
4095.0
▲ +1.36%
📎 Source:artience Official IR →
This article is an AI-generated summary and analysis of official IR disclosures.
📄 Announcement (AI-Reviewed)
- artience announced its consolidated results for the first quarter of the fiscal year ending December 2026. Net sales reached ¥88.3 billion, a 7.5% increase year-on-year (YoY). Operating profit was ¥5.2 billion (+16.1% YoY), and ordinary profit was ¥6.1 billion (+45.4% YoY).
- Net income attributable to owners of parent surged to ¥6.6 billion, a 123.0% increase from ¥2.9 billion in the same period last year, primarily due to the recording of ¥3.6 billion in gain on sale of investment securities.
- All business segments achieved increases in both sales and operating profit compared to the previous year. Specifically, Colorant & Functional Materials saw strong performance in CF materials for large displays, while Polymers & Coatings benefited from mobile-oriented functional films and can coatings. Packaging also performed well with liquid inks.
- The full-year consolidated performance forecast and dividend forecast for FY2026 remain unchanged, projecting net sales of ¥360.0 billion, operating profit of ¥23.0 billion, and net income attributable to owners of parent of ¥21.0 billion.
- The company noted fluctuations in raw material and logistics markets due to escalating tensions in the Middle East. While naphtha prices in Q1 2026 were approximately ¥65,700/KL (largely flat QoQ), the April estimate rose to ¥92,500/KL. A potential increase in raw material costs due to naphtha price hikes is estimated at approximately ¥12.0 billion for FY2026.
🤖 AI Perspective
The strong Q1 performance, particularly the significant increase in net income driven by the gain on sale of investment securities, provides a positive start to the fiscal year. While the full-year forecast remains stable, investors may want to monitor the impact of rising naphtha prices and the company’s ability to manage associated raw material costs. The contribution of non-operating income to the net profit should also be considered when assessing core business performance.
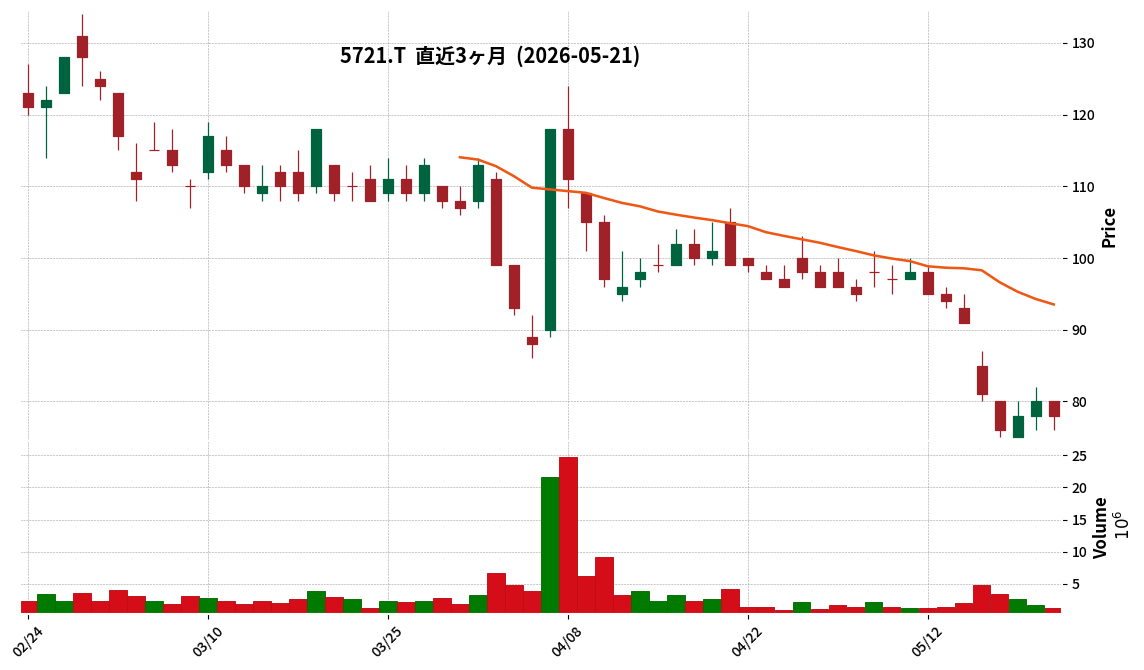
5721|エスクリプトエナジー
78.0
▼ -2.50%
📎 Source:エスクリプトエナジー Official IR →
This article is an AI-generated summary and analysis of official IR disclosures.
📄 Announcement (AI-Reviewed)
- S-Cryptoenergy Co., Ltd. has resolved to subscribe to a portion of the 23rd Series Share Options issued by Kankyo Friendly Holdings Co., Ltd. (TSE Growth: 3777).
- The total investment for this acquisition, including the acquisition cost and exercise price of the share options, amounts to approximately ¥1.3 billion.
- Concurrently, both companies have agreed to enter into a business alliance agreement concerning mining, battery storage, and AI data center businesses.
- This business alliance does not, at present, constitute a final decision on specific commercialization or investment execution; future discussions and considerations will determine further steps.
- The investment is positioned as a pure investment, and S-Cryptoenergy does not intend to be involved in the management of Kankyo Friendly Holdings.
🤖 AI Perspective
S-Cryptoenergy’s advisory investment in Kankyo Friendly Holdings and the business alliance mark a strategic move into the cryptocurrency and next-generation energy and data infrastructure sectors, aligning with S-Cryptoenergy’s mid-term management plan. This initiative is presented as a concrete example of their integrated approach to “strategy design, investment, and communication.” The collaboration, leveraging the resources and development capabilities of both entities, could potentially pave the way for advancements in mining, battery storage, and AI data center projects, warranting close observation of their future progress.
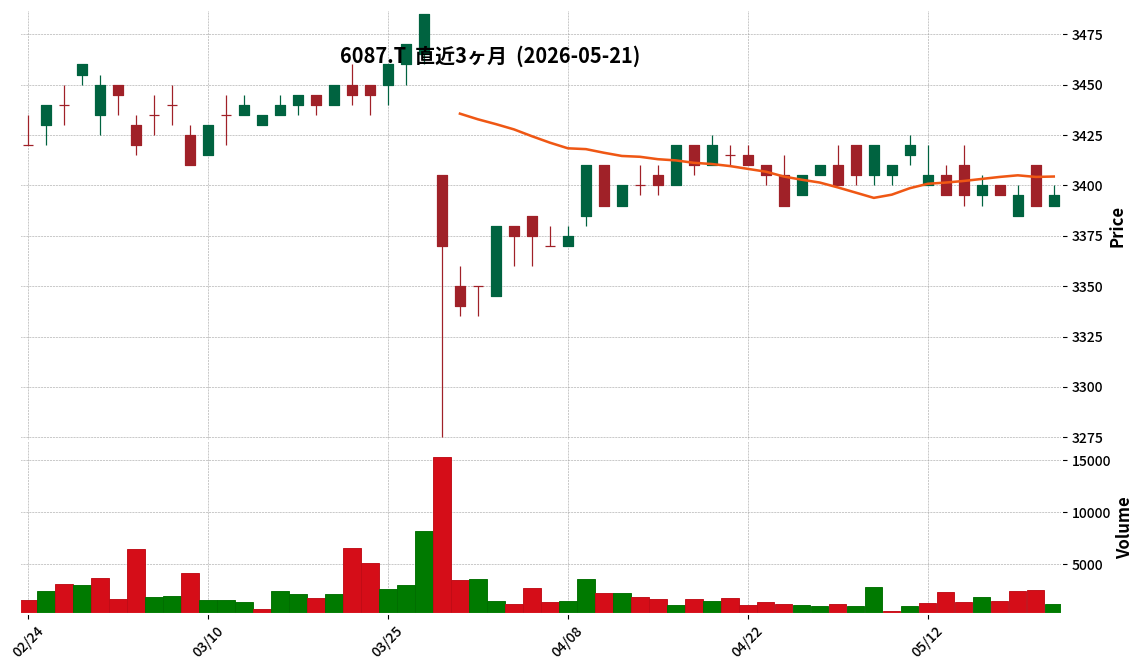
6087|アビスト
3395.0
▲ +0.15%
This article is an AI-generated summary and analysis of official IR disclosures.
📄 Announcement (AI-Reviewed)
- ABIST Inc. released its investor presentation for the second quarter of the fiscal year ending September 2026 (October 1, 2025 – March 31, 2026).
- For the cumulative period of Q2 FY2026, net sales were ¥5,610 million (up 7.7% year-on-year), operating profit was ¥572 million (up 13.6% year-on-year), ordinary profit was ¥578 million (up 12.3% year-on-year), and net income was ¥371 million (up 37.0% year-on-year).
- Against the first-half plan (net sales ¥5,400 million, operating profit ¥290 million, ordinary profit ¥290 million, net income ¥200 million), the company achieved progress rates of 103.9% for net sales, 197.2% for operating profit, 199.3% for ordinary profit, and 185.5% for net income.
- The increase in operating personnel for contract work and the rise in sales per person-month for dispatch services contributed to the increase in both revenue and profit compared to the previous year.
- Key management challenges identified include “improving profitability,” “securing human resources,” and “developing leader-class personnel,” with countermeasures such as reviewing unit prices, strengthening recruitment, and optimizing educational programs.
🤖 AI Perspective
ABIST’s Q2 FY2026 results show a year-on-year increase in both revenue and profit, with operating profit significantly exceeding the first-half plan. This performance appears to be driven by an increase in personnel for contract work and improved sales per person-month in dispatch services. The company’s stated ambition to transform into a “digital solution provider” suggests a strategic focus on value-added services, and the progression of these initiatives will be worth monitoring for future business trajectories.
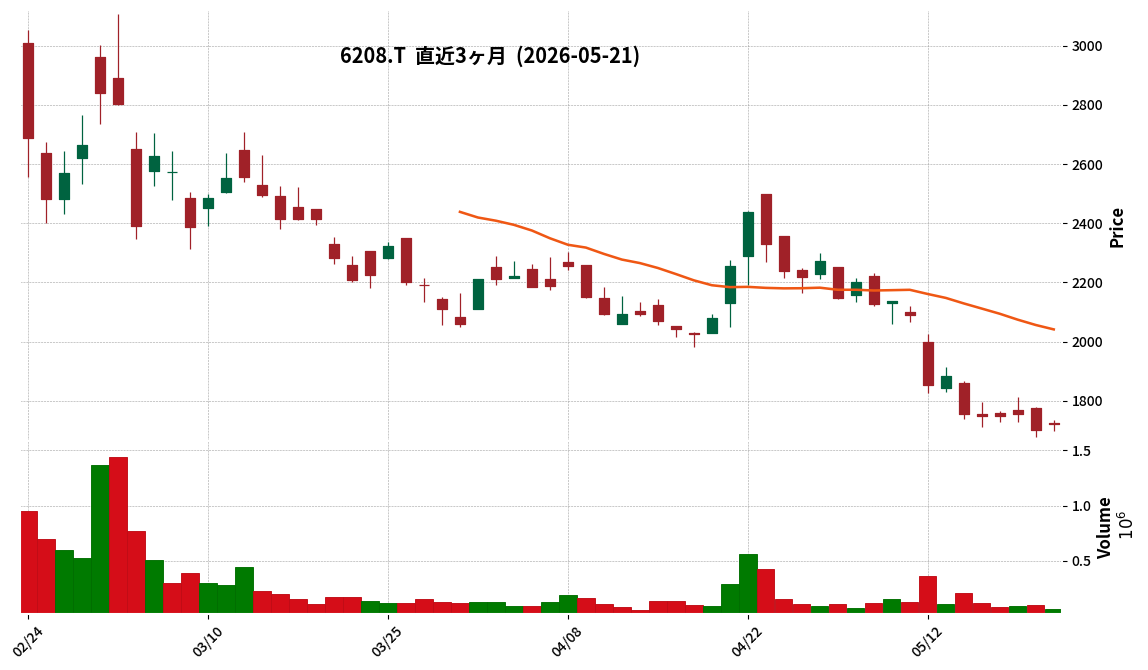
6208|石川製
1723.0
▲ +1.23%
This article is an AI-generated summary and analysis of official IR disclosures.
📄 Announcement (AI-Reviewed)
- Ishikawa Seisakusho Co., Ltd. announced on May 21, 2026, a partial correction to its “FY2026 March Earnings Report [Japanese Standards] (Consolidated).”
- The reason for the correction was stated as “discovery of errors in some descriptions after the submission of the earnings report.”
- The correction pertains to “1. Overview of Business Results (1) Overview of Current Period Business Results.”
- The consolidated orders, previously reported as ¥13,732 million (down 35.5% year-on-year), were corrected to ¥13,735 million (down 35.5% year-on-year).
- Orders for the defense equipment segment were also corrected, from the initial ¥9,954 million (down 41.4% year-on-year) to ¥9,952 million (down 41.4% year-on-year).
- There were no corrections to the consolidated net sales of ¥18,473 million (up 14.0% year-on-year) or defense equipment sales of ¥14,190 million (up 27.9% year-on-year).
🤖 AI Perspective
This correction primarily concerns order intake figures, with minor adjustments made to specific amounts within the consolidated and defense equipment segments. Investors may want to note such amendments as a matter of due diligence, despite the relatively small magnitude of the changes. The absence of corrections to sales figures suggests that the overall revenue recognition for the period remains unchanged, which could indicate a limited impact on the company’s reported top-line performance.
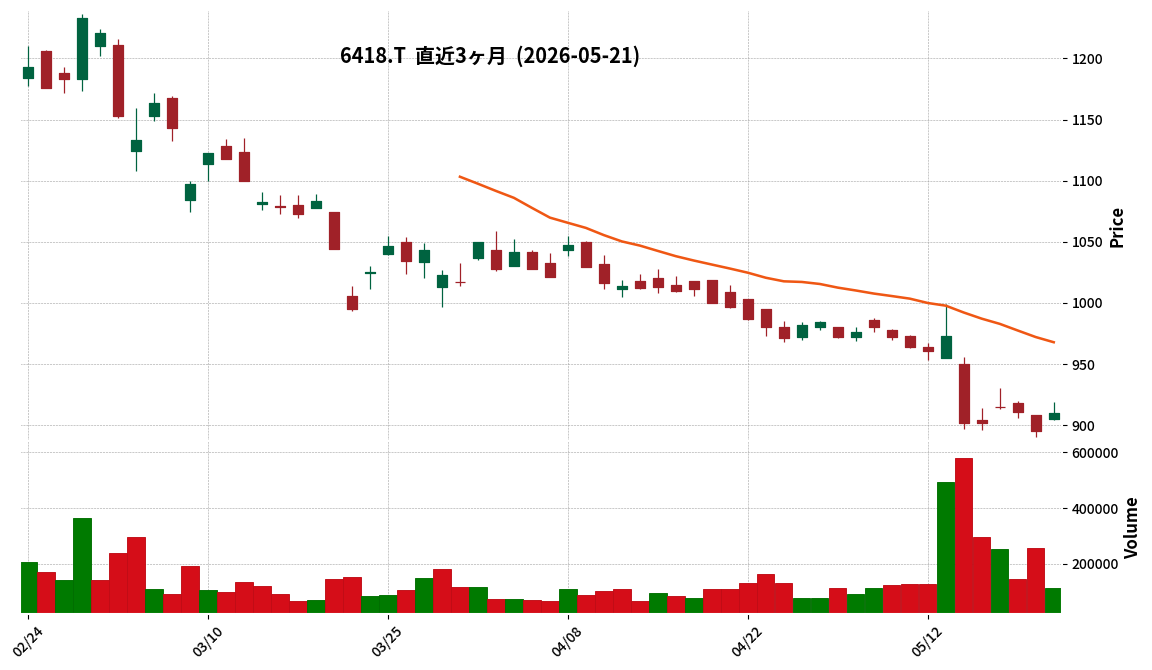
6418|日金銭
910.0
▲ +1.68%
This article is an AI-generated summary and analysis of official IR disclosures.
📄 Announcement (AI-Reviewed)
- Japan Cash Machine Co., Ltd. (JCM) resolved to change its dividend policy and revise its dividend forecast for the fiscal year ending March 2027 (increased dividend) at a Board of Directors meeting held on May 21, 2026.
- The new dividend policy changes from “targeting a consolidated dividend payout ratio of 30% or more, with consideration for the dividend on equity ratio” to “targeting a consolidated dividend payout ratio of 50% or more.”
- The annual dividend forecast for the fiscal year ending March 2027 has been revised from the previous forecast of ¥40 per share to ¥46 per share (interim ¥23, year-end ¥23).
- This change is stated to be for the further enhancement of shareholder returns, based on the medium-term management plan “JCM Global Vision 2032~Next Growth Stage~” announced on the same day.
🤖 AI Perspective
JCM’s revised dividend policy, significantly increasing the target consolidated payout ratio, suggests a strengthened commitment to shareholder returns. The upward revision of the FY2027 annual dividend in line with this new policy and the concurrently announced medium-term management plan could be viewed as a positive signal for investors. The effectiveness of the new dividend policy and the company’s future performance will likely be key factors for investor evaluation.
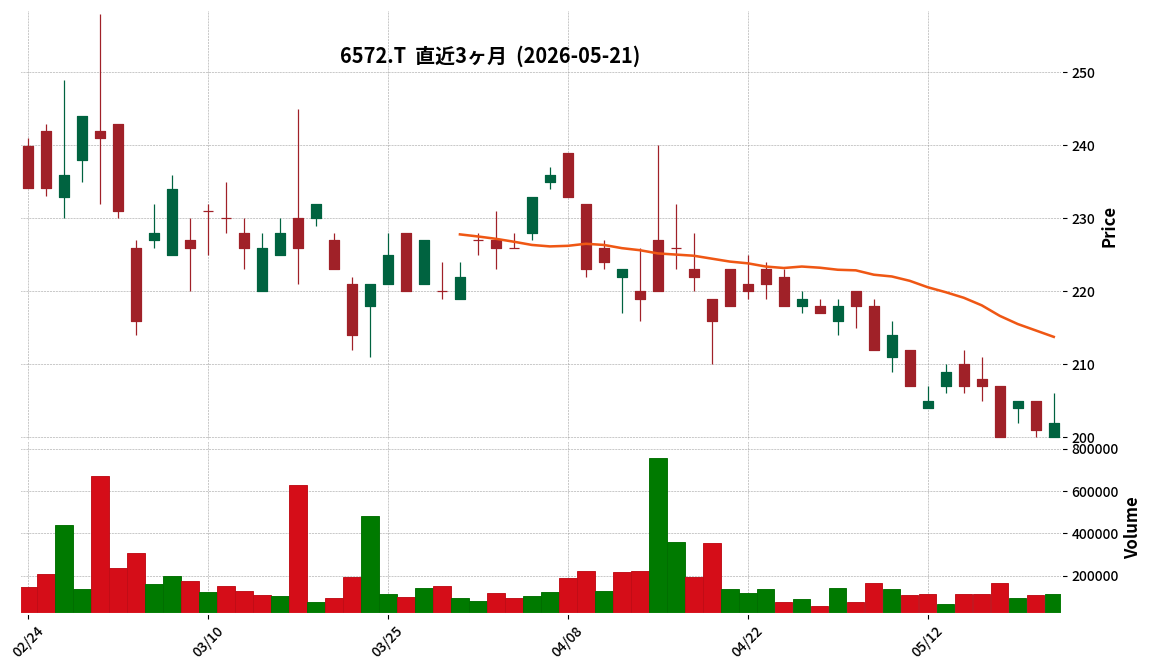
6572|オープンG
202.0
▲ +0.50%
This article is an AI-generated summary and analysis of official IR disclosures.
📄 Announcement (AI-Reviewed)
- OpenG announced a partial correction to its “Consolidated Financial Results for the Fiscal Year Ended February 28, 2026 (Japanese Standards)” on May 21, 2026.
- The reason for the correction is that errors were found in some descriptions of the financial results released on April 14, 2026.
- The corrections pertain to “3. Consolidated Financial Statements and Principal Notes (5) Notes to Consolidated Financial Statements (Notes on Segment Information, etc.) [Segment Information]” on page 13 of the attached materials.
- Specifically, under “1. Overview of Reportable Segments,” “Medical Automation Business” was added as a business content, and OASIS INNOVATION Inc. was additionally noted as operating in the Medical Automation Business as a consolidated subsidiary.
- Even after the correction, the reportable segments remain “Intelligent Automation Business” and “Ad Automation Business.”
- Furthermore, numerical data corrections were made to “Information on Sales, Profit or Loss, Assets, Liabilities, and Other Items by Reportable Segment and Disaggregated Revenue Information” for the previous consolidated fiscal year (March 1, 2024, to February 28, 2025) and the current consolidated fiscal year (March 1, 2025, to February 28, 2026), though the IR document stated “…(omitted below)” for the detailed figures, which are provided in the revised numerical data.
🤖 AI Perspective
This correction primarily involves an addition to the description of reportable segments and a partial adjustment of numerical data. The inclusion of the “Medical Automation Business” may suggest a re-evaluation of the company’s business portfolio. Investors should review the full corrected financial data to understand the precise impact on each segment’s performance.
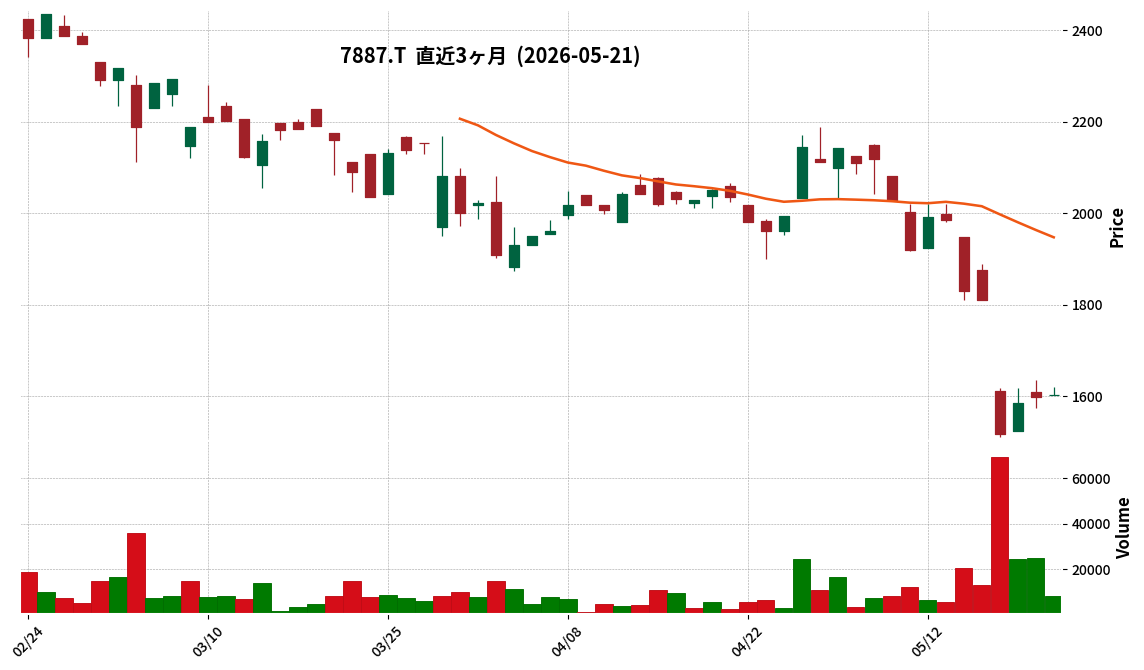
7887|南海プライウッド
1603.0
▲ +0.31%
📎 Source:南海プライウッド Official IR →
This article is an AI-generated summary and analysis of official IR disclosures.
📄 Announcement (AI-Reviewed)
- Nankai Plywood announced a correction to a portion of its “Financial Results for the Fiscal Year Ended March 2026 (Consolidated) [Japanese Standards],” originally published on May 15, 2026.
- The correction specifically relates to the annual dividend figures in “2. Dividends” on page 1 of the summary information.
- The dividend payout ratio (consolidated) for the fiscal year ended March 2026 was corrected from 7.9% to 10.6%, and the dividend on equity ratio (consolidated) was corrected from 0.6% to 0.8%.
- There were no changes to other dividend figures, including those for the fiscal year ended March 2025 and the forecast for the fiscal year ended March 2027.
- The reason for the correction is that an error was discovered in part of the description after the submission of the financial results brief.
🤖 AI Perspective
This correction indicates that previously announced dividend-related figures have been revised. The changes to the dividend payout ratio and dividend on equity ratio for the fiscal year ended March 2026 may be a focal point for investors assessing the company’s financial metrics. It suggests that investors should review the latest, accurate figures to understand the company’s financial position.
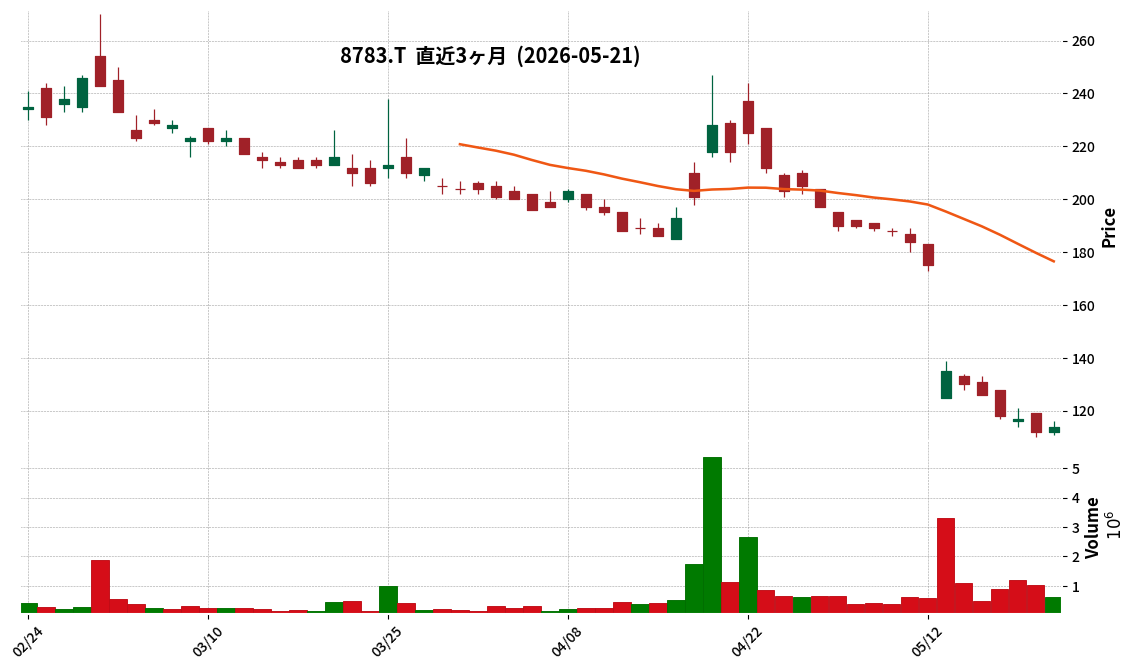
8783|abc
114.0
▲ +1.79%
This article is an AI-generated summary and analysis of official IR disclosures.
📄 Announcement (AI-Reviewed)
- abc Inc. announced on May 21, 2026, the resolution and execution of a simplified stock exchange agreement to make Bond Co., Ltd. a wholly-owned subsidiary.
- The stock exchange, with abc as the wholly-owning parent company and Bond as the wholly-owned subsidiary, is scheduled to become effective on June 12, 2026.
- abc will execute this simplified stock exchange without shareholder approval, based on Article 796, Paragraph 2 of the Companies Act.
- The stock exchange ratio is 35,710 shares of abc’s common stock for every one share of Bond’s common stock, with a planned issuance of 714,200 new shares of abc.
- The purpose of this stock exchange is to expand abc’s business foundation in the entertainment sector through entry into the amusement poker business.
🤖 AI Perspective
This move by abc to acquire Bond Co. suggests a strategic expansion into new entertainment markets, specifically the amusement poker business, which could diversify its revenue streams and broaden its business portfolio. The use of a stock exchange, rather than a cash payment, may indicate an effort to align the interests of existing shareholders with the long-term growth of the combined entity. Furthermore, the exploration of digital payment systems and proprietary tokens hints at a forward-looking approach to leverage technology for business transformation, which could be a point of interest for investors monitoring the company’s innovation strategy.
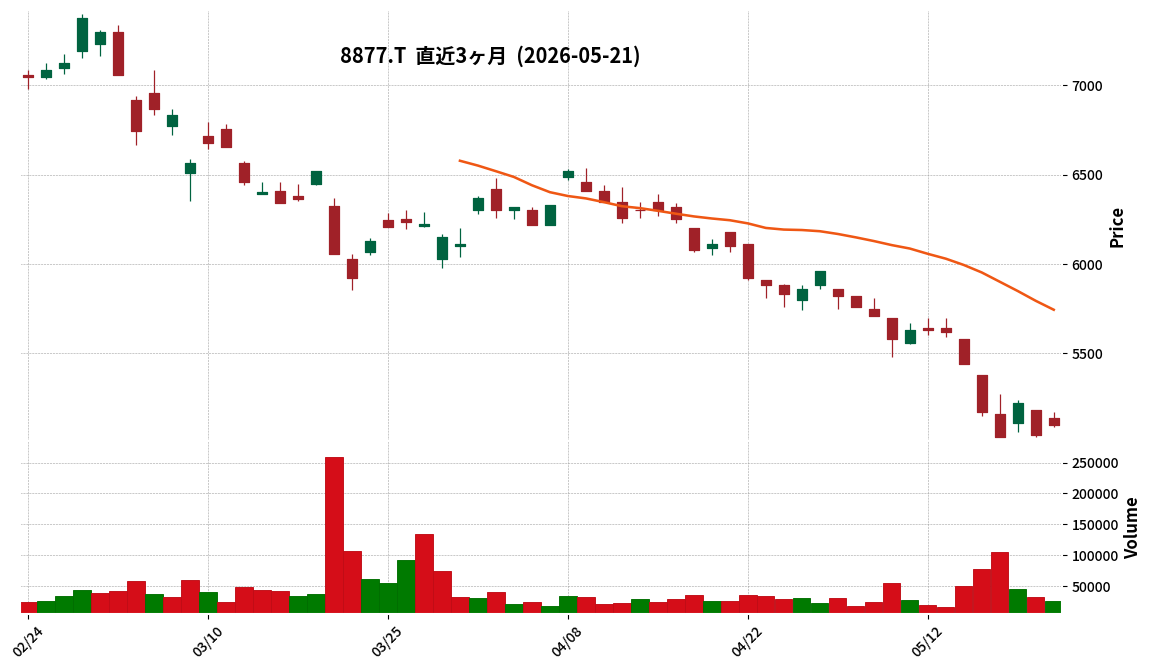
8877|エスリード
5100.0
▲ +1.19%
This article is an AI-generated summary and analysis of official IR disclosures.
📄 Announcement (AI-Reviewed)
- Eslead Co., Ltd.’s parent company, Mori Trust Co., Ltd., announced its financial results for the fiscal year ended March 2026 on May 21, 2026.
- According to Mori Trust Co., Ltd.’s consolidated balance sheet, total assets as of March 31, 2026, were ¥1,822,513 million, and total net assets were ¥687,303 million.
- The consolidated statement of income reported operating revenue of ¥321,087 million and net profit attributable to parent company shareholders of ¥39,231 million for the period from April 1, 2025, to March 31, 2026.
- Mori Trust Co., Ltd. is engaged in real estate development, hotel management, and investment businesses.
- Eslead Co., Ltd. is explicitly listed as one of Mori Trust Co., Ltd.’s 44 major consolidated subsidiaries.
🤖 AI Perspective
The financial results of a parent company, such as Mori Trust, can offer indirect insights into the business environment and financial health of its subsidiary, Eslead. Given Mori Trust’s diverse business operations in real estate development and hotel management, its overall management policies may influence Eslead’s business strategies and future direction. Investors might find it noteworthy to monitor the relationship between Eslead’s operations and its parent company’s financial standing.
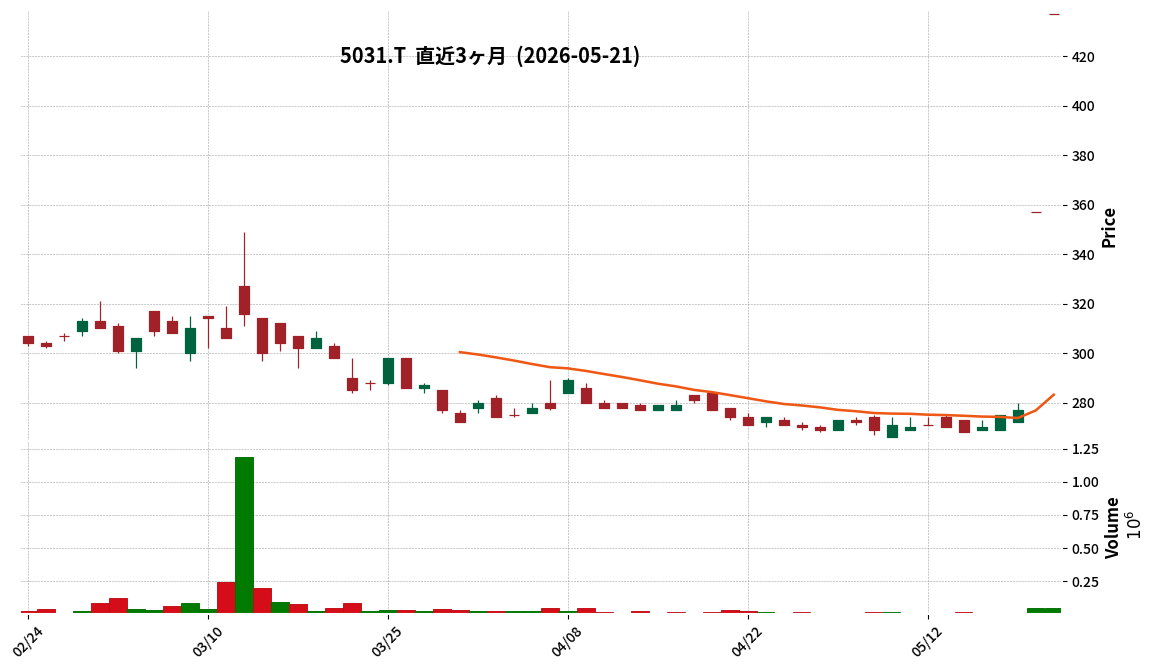
5031|G-モイ
437.0
▲ +22.41%
This article is an AI-generated summary and analysis of official IR disclosures.
📄 Announcement (AI-Reviewed)
- Moi Co., Ltd. announced corrections to a portion of its disclosure made on May 19, 2026, regarding the capital and business alliance with SBI Holdings, the issuance of new shares through third-party allocation, share sales, and changes in controlling shareholders, major shareholders, and other affiliated companies.
- The “Payment Deadline Date” for the third-party allocation of new shares has been revised to a “Payment Period,” now specified as June 4, 2026, to July 31, 2026. The issue price, number of shares, and total amount remain unchanged.
- The commencement date of the capital and business alliance has been corrected to “the date between June 4, 2026, and July 31, 2026, on which the payment for the third-party allocation of new shares and the transfer of shares are completed (scheduled).”
- The scheduled change date for controlling shareholders, major shareholders, and other affiliated companies has also been corrected to the date between June 4, 2026, and July 31, 2026, on which the payment and share transfer are completed (scheduled).
- In the description of Mr. Yosuke Akamatsu’s voting rights and ratio after the change, and SBI Holdings’ voting rights and ratio after the change, the phrase “(scheduled for July 31, 2026)” has been removed from the “After Change” section, but the numerical values remain the same.
🤖 AI Perspective
These corrections primarily clarify the payment schedule for the third-party allocation of new shares in the capital and business alliance with SBI Holdings, changing it from a specific “date” to a “period.” This adjustment to a payment “period” could suggest more flexibility in the execution of the transaction. Investors may find it noteworthy that the revised dates for the alliance’s commencement and changes in shareholder structure now reflect this broadened payment window, providing a clearer understanding of the transactional timeline.
6457|グローリー
4145.0
▼ -0.84%
This article is an AI-generated summary and analysis of official IR disclosures.
📄 Announcement (AI-Reviewed)
- GLORY Ltd. announced a correction to a part of its “FY2026/3 Financial Results Supplementary Information [IFRS]” on May 21, 2026.
- The correction pertains to the “FY2026/3 Financial Results Supplementary Information [IFRS]” that was disclosed on May 15, 2026.
- The reason for the correction was the discovery of an error in the forecasted maintenance service revenue for the fiscal year ending March 2027, as presented on page 2 of the supplementary material.
- The specific correction involves the full-year forecast for maintenance service revenue for FY2027/3, which was revised from ¥113,000 million (YoY change -9.8%) to ¥124,000 million (YoY change -1.0%).
- This correction has no impact on the previously disclosed consolidated financial results for “FY2026/3 Financial Results [IFRS]”.
🤖 AI Perspective
This correction by GLORY Ltd. revises an specific segment’s revenue forecast upwards for FY2027/3, which could be an important detail for investors monitoring segment-level performance. The fact that the correction does not impact the previously reported consolidated financial results may provide a degree of clarity regarding the overall financial position. Investors might consider how this revised segment forecast could influence the company’s future outlook and overall performance trends.
💡 Start investing with IR insights
※ 本ページには広告が含まれます(PR)
Disclaimer: This article is for informational purposes only and does not constitute investment advice. All investment decisions are at your own risk.

コメント