
📌 Today’s Highlights
Today we cover 159 IR announcements. Notable among them: G-ROXX (241A), メディシノバ (4875), G-Arent (5254). Use the table of contents below to navigate to each company.
- 241A|G-ROXX
- 4875|メディシノバ
- 5254|G-Arent
- 3059|ヒラキ
- 1815|鉄建建設
- 6472|NTN
- 7988|ニフコ
- 2780|コメ兵HD
- 3551|ダイニック
- 5105|TOYO TIRE
- 5237|ノザワ
- 5287|イトーヨーギョー
- 6699|ダイヤHD
- 8018|三共生興
- 9405|朝日放送グループHD
- 5471|大同特鋼
- 1301|極洋
- 173A|G-ハンモック
- 1860|戸田建
- 2173|G-博展
- 357A|P-エフアンドエフ
- 3927|フーバーブレイン
- 4375|G-セーフィー
- 4847|IWI
- 4933|Ine
- 5125|G-ファインズ
- 5582|G-グリッド
- 6089|ウィルグループ
- 6942|ソフィアHD
- 7371|G-Zenken
- 9761|東海リース
- 5619|G-マーソ
- 1786|オリエンタル白石
- 2222|寿スピリッツ
- 253A|ETSグループ
- 261A|日水コン
- 279A|P-インターグ
- 3423|エスイー
- 3930|G-はてな
- 4020|G-ビートレンド
- 4099|四国化成HD
- 4169|G-エネチェンジ
- 5616|G-雨風太陽
- 6635|大日光
- 6982|リード
- 7350|おきなわFG
- 9245|G-リベロ
- 2875|東洋水産
- 5869|早稲田学習研究会
- 3909|ショーケース
- 147A|G-ソラコム
- 7037|テノ.
- 8157|都築電気
- 9244|G-デジタリフト
- 1822|大豊建
- 2806|ユタカフーズ
- 2874|ヨコレイ
- 2876|デルソーレ
- 3047|Q-トラックワン
- 3397|トリドールHD
- 3845|アイフリーク
- 4074|G-ラキール
- 4165|G-プレイド
- 4754|トスネット
- 4767|TOW
- 5923|高田機工
- 7270|SUBARU
- 7327|第四北越FG
- 7369|G-メイホーHD
- 7376|G-BCC
- 8362|福井銀
- 9212|G-GEI
- 9663|ナガワ
- 3710|ジョルダン
- 565A|P-FFFHD
- 8066|三谷商
- 546A|MIRAINI
- 3277|サンセイランディック
- 3299|ムゲンエステート
- 3683|サイバーリンクス
- 3861|王子HD
- 4990|昭和化
- 5101|浜ゴム
- 5966|京都機械工具
- 6858|小野測器
- 6977|日抵抗器
- 7272|ヤマハ発
- 8076|カノークス
- 8163|SRSHD
- 8388|阿波銀
- 8714|池田泉州
- 4116|大日精化
- 6151|日東工器
- 1979|大気社
- 406A|P-環境のミカタHD
- 5074|テスホールディングス
- 5724|アサカ理研
- 5918|滝上工
- 6144|西部電機
- 6331|菱化工機
- 6376|日機装
- 6400|不二精機
- 6457|グローリー
- 2376|サイネックス
- 4391|G-ロジザード
- 6190|G-PXB
- 6291|エアーテック
- 352A|G-LOIVE
- 3769|GMOPG
- 4051|GMO-FG
- 9449|GMO
- 153A|G-カウリス
- 1716|第一カッター
- 1376|カネコ種苗
- 2498|オリコンHD
- 5983|イワブチ
- 6637|寺崎電気
- 1783|fantasista
- 2160|G-GNI
- 2388|G-ウェッジHD
- 2585|ライフドリンクC
- 2597|ユニカフェ
- 3150|グリムス
- 3156|レスター
- 3187|G-ミラタップ
- 3359|G-cotta
- 3469|デュアルタップ
- 3652|G-DMP
- 3667|enish
- 3670|協立情報通信
- 3719|AIストーム
- 3763|プロシップ
- 3772|ウェルス
- 2652|まんだらけ
- 7699|G-OPS
- 3664|G-WIZE
- 2323|fonfun
- 6566|要興業
- 7837|アールシーコア
- 8771|Eギャランティ
- 3358|Trailhead
- 4771|エフアンドエム
- 6554|G-エスユーエス
- 6794|フォスター電
- 8252|丸井G
- 9211|G-エフ・コード
- 4258|G-網屋
- 3392|デリカフーズHD
- 4499|Speee
- 5856|エルアイイーエイチ
- 5868|ロココ
- 6579|G-ログリー
- 6912|菊水HD
- 7383|ネットプロHD
- 7790|バルコス
- 6890|フェローテック
- 4192|G-スパイダープラス
- 9984|ソフトバンクグループ
- 8591|オリックス
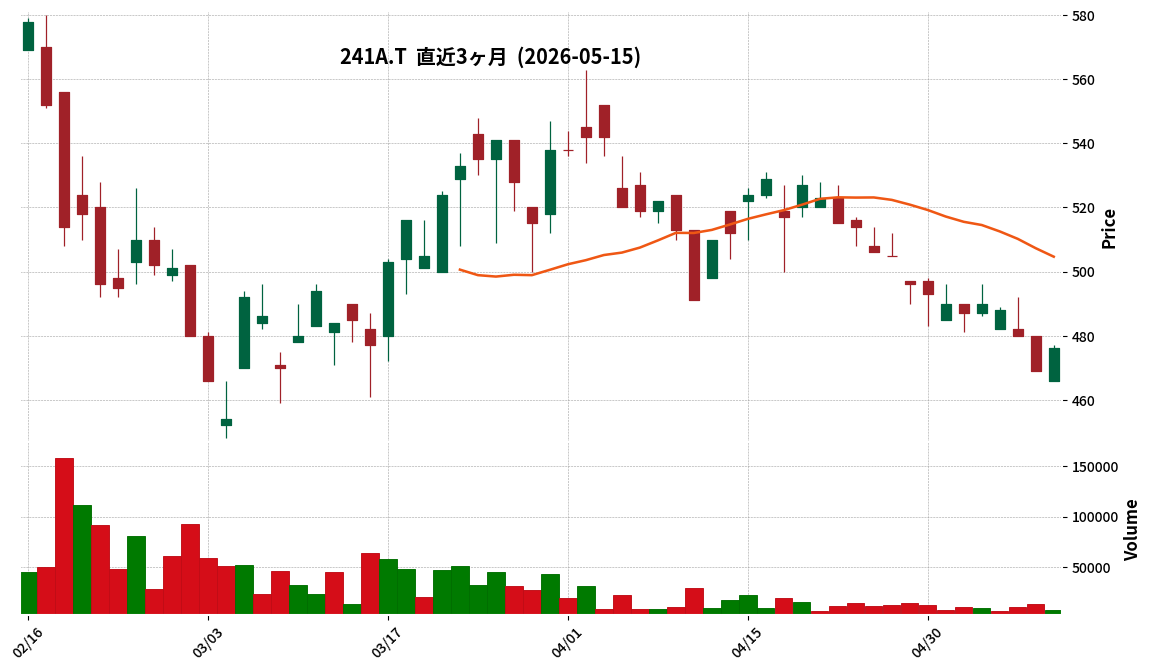
241A|G-ROXX
476.0
▲ +1.49%
This article is an AI-generated summary and analysis of official IR disclosures.
📄 Announcement (AI-Reviewed)
- ROXX Inc. released its “Q2 FY2026 Earnings Briefing Transcript” on May 15, 2026.
- For the second quarter of the fiscal year ending September 2026, revenue reached approximately ¥940 million, marking a 28.2% increase year-on-year.
- The operating loss for the same period was approximately ¥160 million, representing a ¥440 million improvement compared to the same period in the previous year.
- The company aims for full-year revenue of ¥5 billion and full-year profitability, with Q2 revenue achieving a 37.5% progress rate against the full-year target.
- Key topics for Q2 included the introduction of Z Career AI Interviewer to SOMPO Himawari Life Insurance Co., Ltd., and reinforced development of AI-related products.
🤖 AI Perspective
G-ROXX’s Q2 FY2026 results show robust revenue growth and significant improvement in operating loss, which could be positive signals for investors. The company’s business model anticipates losses in the first half due to upfront investments, with a focus on recovery and achieving full-year profitability in the latter half. The emphasis on AI-related product development and deployment may indicate a strategic direction to enhance future revenue streams and operational efficiency.
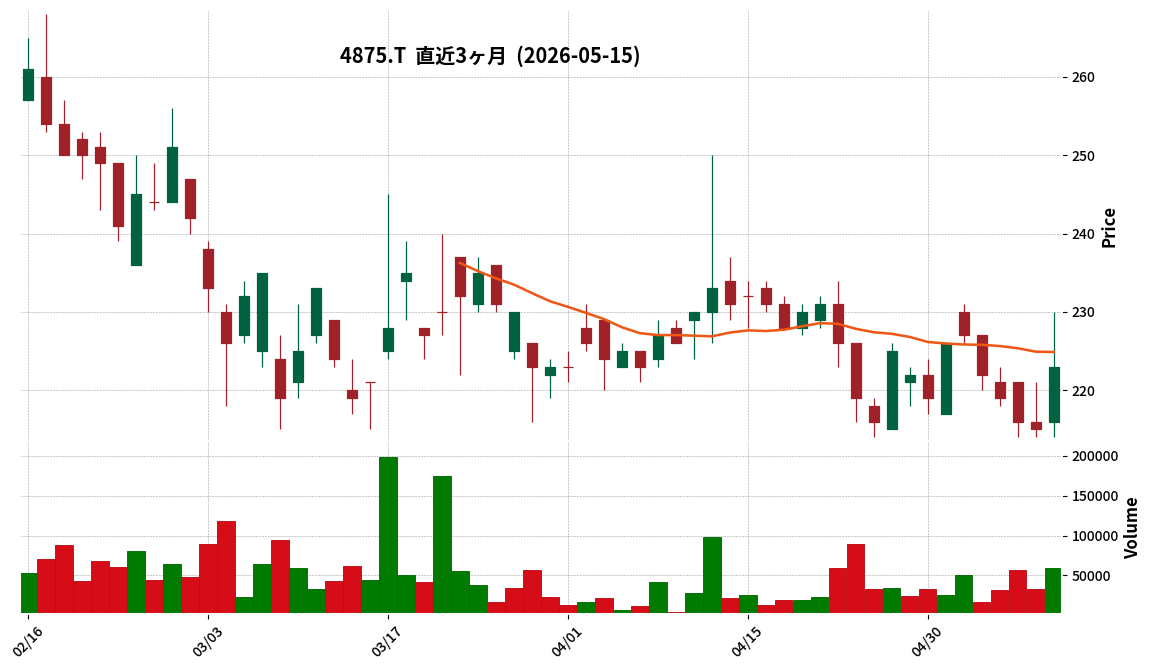
4875|メディシノバ
223.0
▲ +3.72%
This article is an AI-generated summary and analysis of official IR disclosures.
📄 Announcement (AI-Reviewed)
- Medicinova, Inc. announced its consolidated financial results for the first quarter of fiscal year 2026 (January 1, 2026, to March 31, 2026).
- Revenue for the quarter was $186,984.
- Net loss attributable to shareholders was $2,586,258, resulting in a net loss per share of $0.05.
- Total assets as of March 31, 2026, stood at $42,704,854, with total equity at $39,407,234, and an equity ratio of 92.3%.
- The consolidated earnings forecast for the fiscal year ending December 2026 has not been provided, as a reasonable prediction is currently difficult.
🤖 AI Perspective
Medicinova operates as a biopharmaceutical company focused on novel drug development, a sector characterized by significant initial investment and a prolonged path to commercialization. The reported net loss, despite some revenue, may suggest ongoing substantial research and development expenditures typical for companies in this stage. For investors, monitoring the progress of their drug development pipeline rather than immediate profitability could be a key focus.
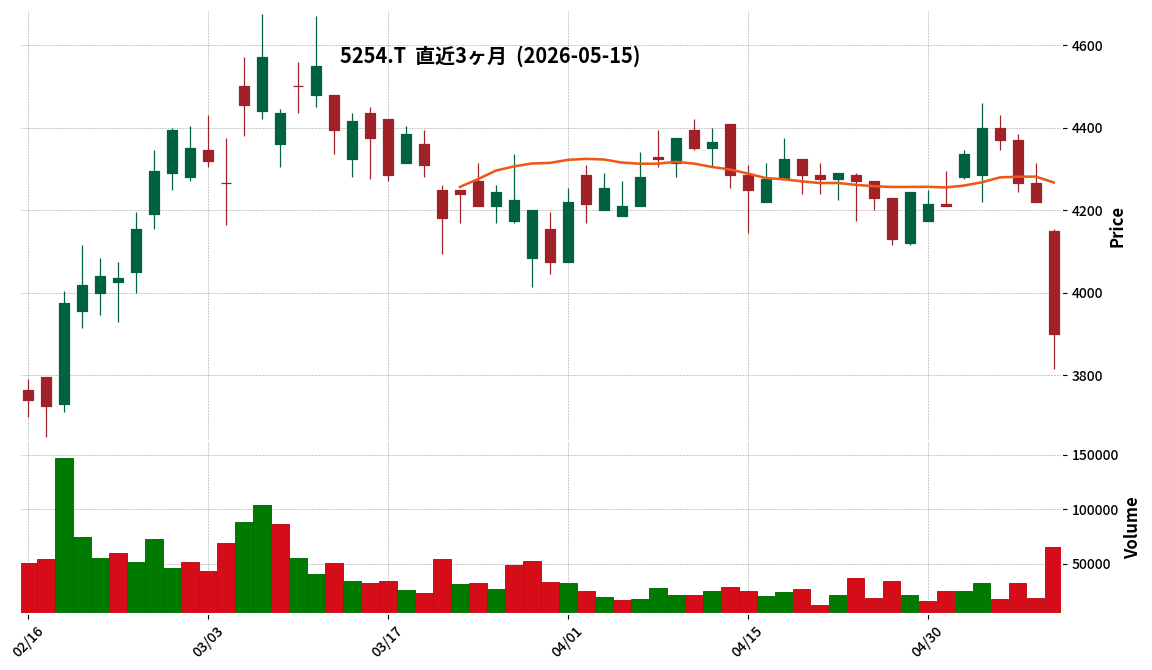
5254|G-Arent
3900.0
▼ -7.58%
📎 Source:G-Arent Official IR →
This article is an AI-generated summary and analysis of official IR disclosures.
📄 Announcement (AI-Reviewed)
- G-Arent Co., Ltd. announced on May 15, 2026, the release of the Q&A transcript and archived video from its Q3 FY2026 earnings call.
- The company stated a strategic shift from its previous M&A-centric approach to focusing on “in-house product development” leveraging generative AI, in light of AI’s advancements.
- This strategic change may accelerate the achievement of the product business’s target profit margin of 40-50%.
- It was stated that sales and profits showed improved underlying profitability due to the resolution of temporary factors in Q2, progressing steadily towards full-year targets.
- The company indicated that preliminary investments related to the traditional M&A strategy would conclude in FY226, with a transition to a profit recovery phase from FY227 onwards.
🤖 AI Perspective
The release of G-Arent’s earnings call Q&A highlights a significant strategic pivot for the company. The shift towards in-house development driven by generative AI could potentially lead to increased development efficiency and an earlier achievement of profit margin targets. Investors may find it worthwhile to monitor how this new strategy translates into future financial performance and the specific progress made.
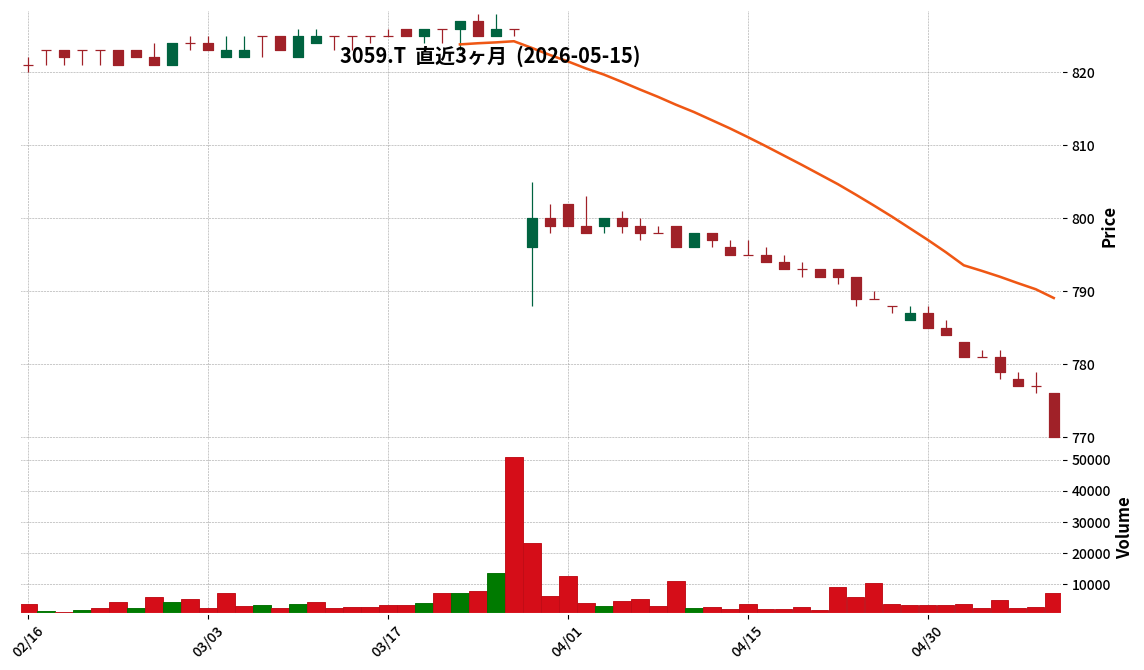
3059|ヒラキ
770.0
▼ -0.90%
This article is an AI-generated summary and analysis of official IR disclosures.
📄 Announcement (AI-Reviewed)
- Hiraki Co., Ltd. announced its consolidated financial results for the fiscal year ended March 2026 (April 1, 2025, to March 31, 2026).
- Consolidated net sales amounted to ¥11,895 million, a decrease of 8.2% compared to the previous fiscal year.
- The company reported an operating loss of ¥320 million, an ordinary loss of ¥313 million, and a net loss attributable to parent company shareholders of ¥426 million.
- Sales for the Mail Order Business segment were ¥5,219 million (down 15.0% YoY), resulting in a segment loss of ¥31 million.
- The Store Sales Business segment recorded sales of ¥6,535 million (down 1.4% YoY) and a segment profit of ¥134 million (down 24.0% YoY).
- The Wholesale Business segment’s sales were ¥141 million (down 26.1% YoY), leading to a segment loss of ¥3 million.
- For the fiscal year ending March 2027 (April 1, 2026, to March 31, 2027), the company forecasts consolidated net sales of ¥12,500 million (up 5.1% YoY), operating profit of ¥150 million, ordinary profit of ¥140 million, and net profit attributable to parent company shareholders of ¥100 million.
- The annual dividend per share for FY2026 March and FY2027 March (forecast) remains unchanged at ¥20.
🤖 AI Perspective
The reported results indicate a decline in net sales and losses at all profit stages for the past fiscal year, primarily influenced by the underperformance of the mail-order business segment. However, the company projects a return to revenue and profit growth for the fiscal year ending March 2027, which may suggest anticipated improvements in business operations or the effectiveness of strategic initiatives. Investors might observe how the company plans to achieve these forward-looking targets amidst the current economic landscape.
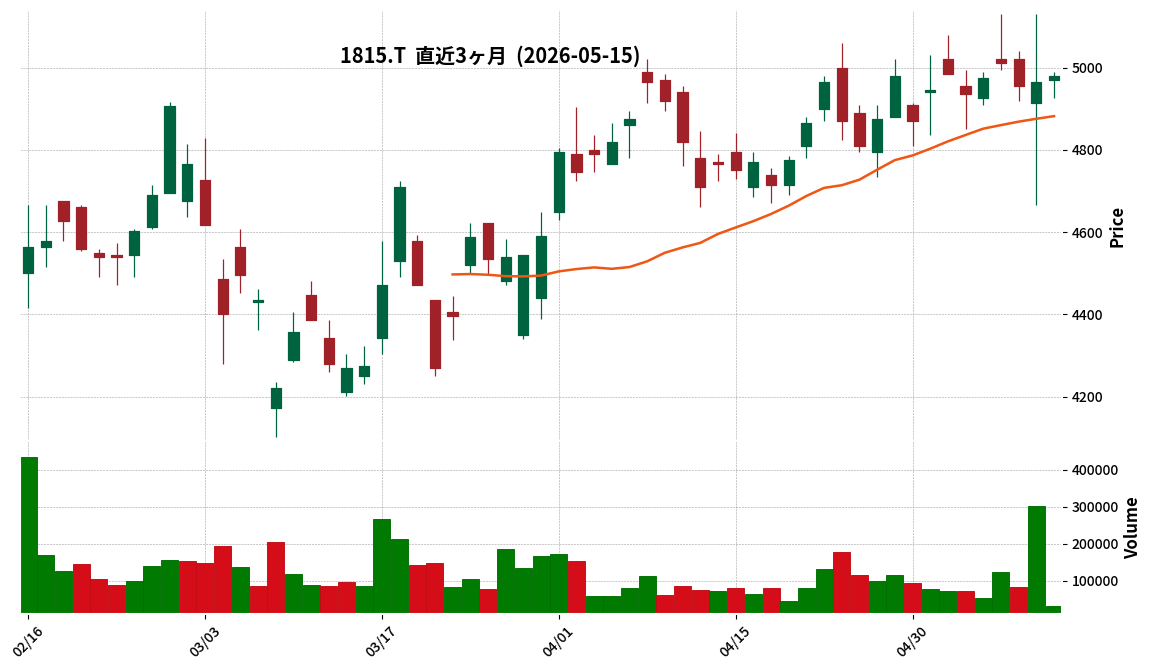
1815|鉄建建設
4980.0
▲ +0.30%
This article is an AI-generated summary and analysis of official IR disclosures.
📄 Announcement (AI-Reviewed)
- Tekken Kensetsu Co., Ltd. announced a correction to its “Update on Medium-Term Management Plan 2028 (Upward Revision of Numerical Targets and Change in Dividend Policy)” which was originally disclosed on May 14, 2026.
- The correction primarily addresses errors in the disclosure content, with no changes to numerical targets, dividend policy, or other substantive aspects of the plan.
- Specific corrections include wording in the P.2 “INDEX” header, the unit for D/E Ratio on P.11 (from “0.96%” to “0.96 times”), a photo caption on P.13, and descriptions on P.22 (Architecture Business), P.26 (DX Strategy), P.27 (Environmental Strategy), and P.44 (Dialogue with Shareholders/Investors).
- Additionally, issues with missing logo displays due to PDF conversion errors were resolved.
- A revised version of the document has been republished to reflect these corrections.
🤖 AI Perspective
This correction clarifies that the previously announced Medium-Term Management Plan 2028 has not undergone any substantive changes regarding its numerical targets or dividend policy. For investors, this ensures that the core details of the plan remain consistent with the initial announcement, focusing on document accuracy rather than strategic shifts.
6472|NTN
439.7
▼ -3.60%

This article is an AI-generated summary and analysis of official IR disclosures.
📄 Announcement (AI-Reviewed)
- NTN reported consolidated financial results for the fiscal year ended March 31, 2026, with net sales of 825.6 billion JPY (+0.1% YoY), operating income of 31.0 billion JPY (+8.1 billion JPY YoY), and net income attributable to owners of the parent of 12.9 billion JPY (compared to a loss of 23.8 billion JPY in the prior year), marking increased revenue, increased profit, and a return to profitability.
- Sales increased due to rising demand in the aftermarket and industrial machinery sectors, coupled with the impact of the yen’s depreciation, despite sluggish demand in the automotive sector. Operating income rose due to sales price improvements, cost reductions, and the yen’s depreciation.
- For the fiscal year ending March 31, 2027, the company forecasts net sales of 810.0 billion JPY (-2.0% YoY), operating income of 33.0 billion JPY (+2.0 billion JPY YoY), and net income attributable to owners of the parent of 15.0 billion JPY (+2.1 billion JPY YoY), anticipating decreased revenue but increased profit.
- By business segment for FY2027, “Bearings and Others” is expected to see increased revenue of 357.0 billion JPY (+8.1 billion JPY YoY) and increased operating income of 14.5 billion JPY (+2.3 billion JPY YoY). In contrast, “CVJ Axles” is projected to experience decreased revenue of 453.0 billion JPY (-24.5 billion JPY YoY) and decreased operating income of 18.5 billion JPY (-0.3 billion JPY YoY).
- The “DRIVE NTN100” Final structural reform initiative is progressing ahead of schedule, with 18.9 billion JPY in expenses and 10.4 billion JPY in effects recorded for FY2025. For FY2026, 5.1 billion JPY in expenses and 5.3 billion JPY in effects are planned.
🤖 AI Perspective
The strong performance in FY2026 appears to reflect the results of structural reforms, including sales price improvements and cost reductions, in addition to the impact of the depreciating yen. While a revenue decline is anticipated for FY2027 due to sluggish automotive demand, the plan to achieve profit growth through continued structural reforms, sales price pass-throughs, and cost reductions is noteworthy. The projected profit increase in the “Bearings and Others” segment and ongoing initiatives in capacity expansion and new product development may suggest shifts in the company’s future business structure.
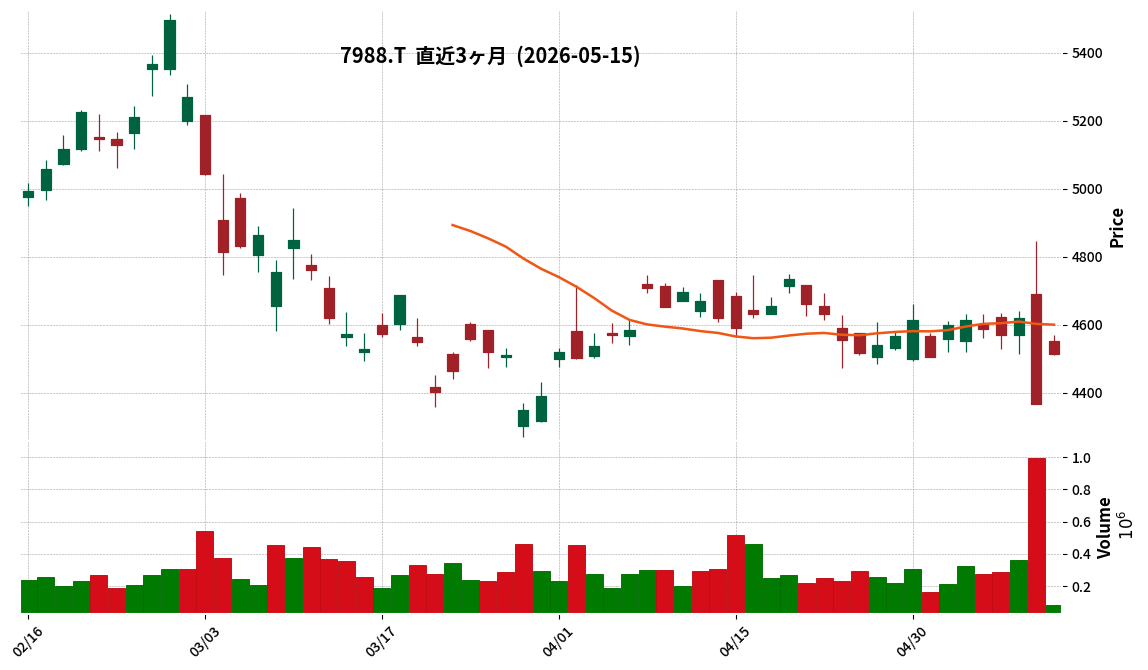
7988|ニフコ
4513.0
▲ +3.37%
This article is an AI-generated summary and analysis of official IR disclosures.
📄 Announcement (AI-Reviewed)
- Nifco announced a partial correction to its “Consolidated Financial Results for the Fiscal Year Ended March 31, 2026 [Japanese GAAP]”, originally disclosed on May 14, 2026.
- The reason for the correction is due to a stock split at a ratio of two shares for every one common share, with a record date of September 30, 2026, and an effective date of October 1, 2026.
- The corrected sections include page 1 of the document and page 4 of the attached materials, specifically “(5) Basic Policy on Profit Distribution and Dividends for the Current and Next Fiscal Years”.
- The dividend forecast for the fiscal year ending March 2027 was revised from a previously planned annual dividend of 112 yen per share to an interim dividend of 56 yen and a year-end dividend of 28 yen (after considering the stock split).
- Converted to pre-stock split terms, the year-end dividend would be 56 yen per share, resulting in an annual dividend of 112 yen per share.
🤖 AI Perspective
Nifco’s correction to its financial results highlights the company’s efforts to ensure clarity regarding its future dividend policy following the recently announced stock split. By providing the dividend forecast for the fiscal year ending March 2027 on a post-split basis, investors can better understand the per-share dividend impact of the split. This move could potentially enhance stock accessibility for a broader range of investors by lowering the price per investment unit.
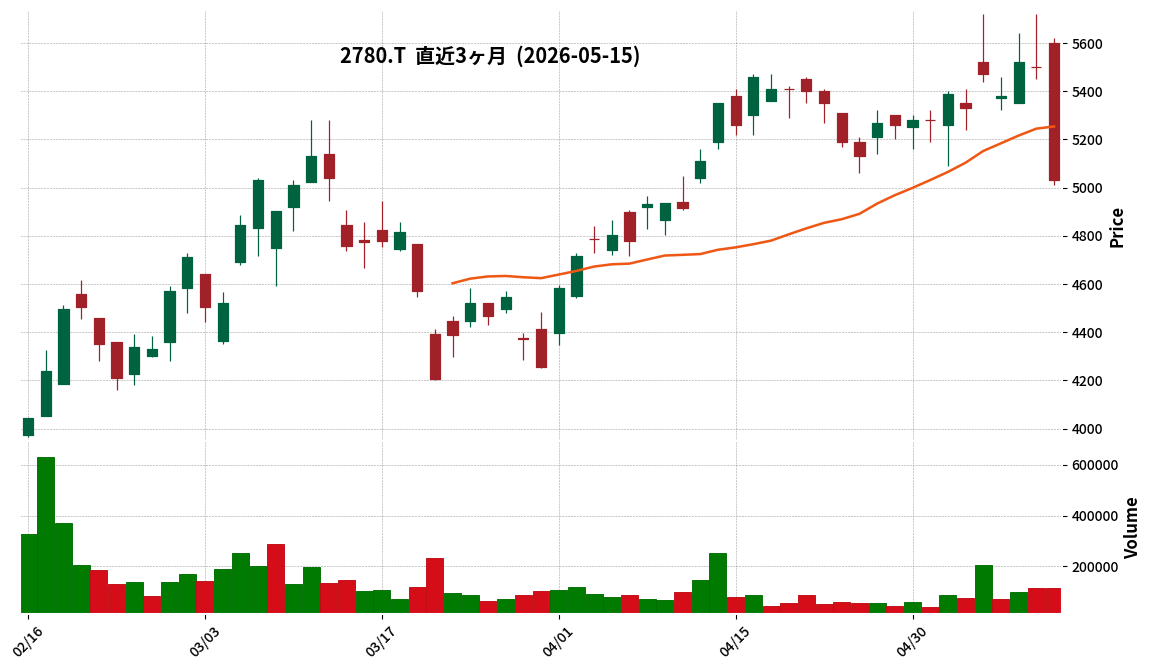
2780|コメ兵HD
5030.0
▼ -8.55%
This article is an AI-generated summary and analysis of official IR disclosures.
📄 Announcement (AI-Reviewed)
- Komehyo Holdings Inc. announced on May 15, 2026, a correction to a part of its “FY2026 March Earnings Presentation Material.”
- The correction addresses errors found on page 47 of the material released on May 14, 2026.
- The projected revenue increase for FY2027 March was revised from 7,070 million yen to 7,039 million yen.
- The projected gross profit increase for FY2027 March was revised from 4,597 million yen to 4,372 million yen.
- The projected gross profit margin improvement for FY2027 March was revised from 1.1 percentage points to 1.9 percentage points.
🤖 AI Perspective
This correction modifies previously disclosed financial projections within the earnings presentation material. Notably, while the revenue increase and gross profit increase were revised downward, the gross profit margin improvement was revised upward, potentially highlighting an increased focus on profitability. Investors may consider these revised figures when evaluating Komehyo HD’s future outlook and the potential implications for its financial performance.
Disclaimer: This article is for informational purposes only and does not constitute investment advice.
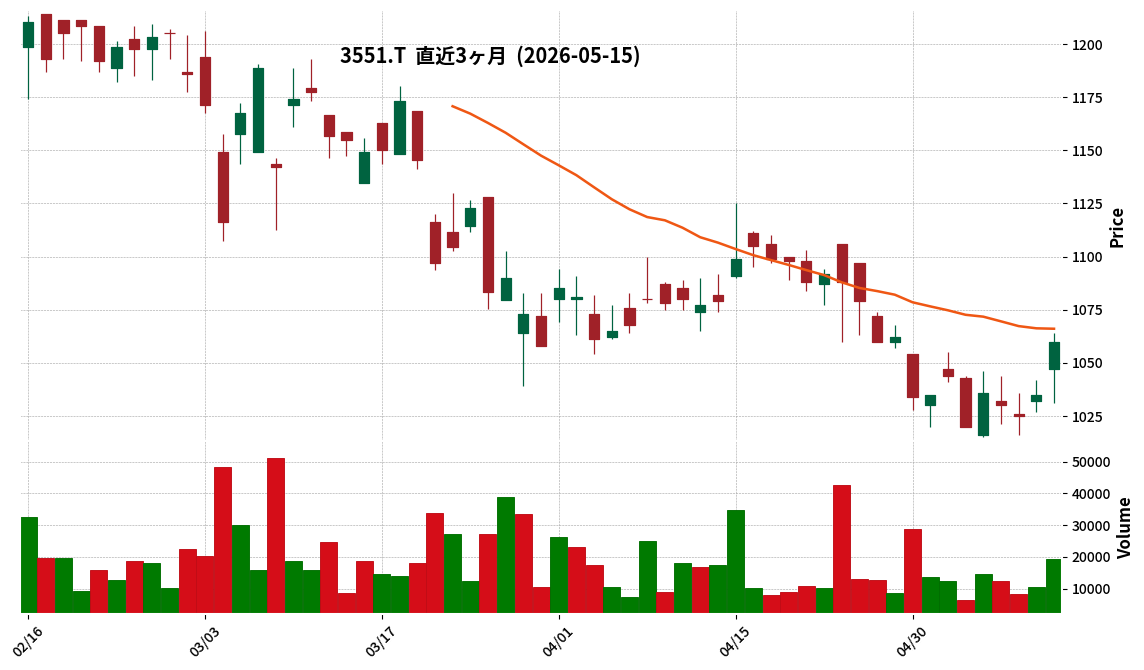
3551|ダイニック
1060.0
▲ +2.42%
This article is an AI-generated summary and analysis of official IR disclosures.
📄 Announcement (AI-Reviewed)
- Dynic Corporation has announced a year-end dividend for the fiscal year ending March 31, 2026.
- The dividend per share will be ¥46, an increase of ¥11 from the previously projected ¥35 (announced May 15, 2025).
- The previous fiscal year’s (March 2025) dividend per share was ¥30.
- The total dividend amount is stated as ¥377 million, compared to ¥251 million in the previous fiscal year.
- The dividend source is retained earnings, with an effective date of June 29, 2026.
- The company attributes the increase to the fiscal year ending March 2026’s performance exceeding initial plans, in line with its revised dividend policy announced on May 15, 2025.
🤖 AI Perspective
- This decision aligns with the company’s updated dividend policy, which emphasizes a minimum dividend payout ratio of 15% and maintaining a consolidated total return ratio of 30% or more.
- The upward revision of the dividend forecast, driven by better-than-expected performance, may be seen as a positive sign regarding the company’s commitment to shareholder returns.
- A consecutive dividend increase from the prior year could indicate stable business growth and a consistent approach to shareholder value.
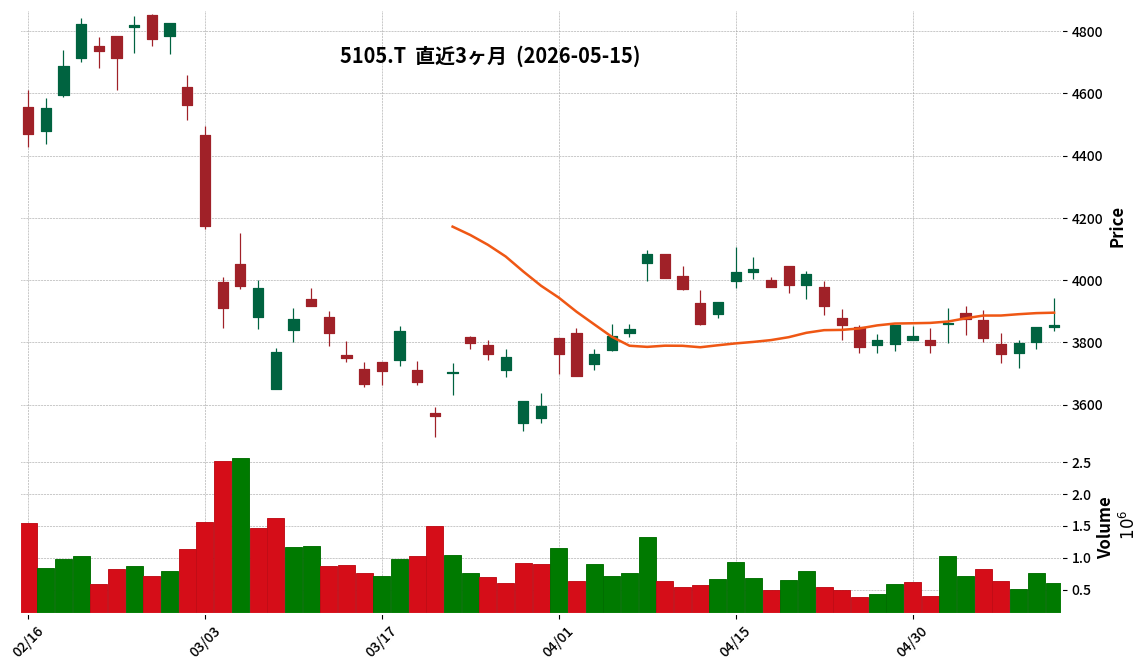
5105|TOYO TIRE
3857.0
▲ +0.23%
📎 Source:TOYO TIRE Official IR →
This article is an AI-generated summary and analysis of official IR disclosures.
📄 Announcement (AI-Reviewed)
- TOYO TIRE announced its consolidated financial results for the first quarter of the fiscal year ending December 2026 (January 1, 2026, to March 31, 2026).
- Net sales amounted to JPY 130,951 million, a 3.4% decrease compared to the same period of the previous year. Operating profit was JPY 20,610 million, an 8.1% decrease year-on-year.
- Ordinary profit increased by 17.0% to JPY 21,352 million, and net profit attributable to owners of the parent rose by 14.6% to JPY 15,476 million.
- Basic earnings per share for the quarter were JPY 100.50, up from JPY 87.71 in the prior year’s first quarter.
- The full-year consolidated earnings forecast and the year-end dividend forecast (JPY 135.00 per share) remain unchanged from the most recently published figures.
🤖 AI Perspective
While net sales and operating profit decreased year-on-year, the increase in ordinary profit and net profit attributable to owners of the parent suggests potential positive impacts from non-operating income/expenses or extraordinary gains/losses. The improvement in the equity ratio from 69.4% to 72.5% could indicate a strengthening of the company’s financial position, which investors may find noteworthy.
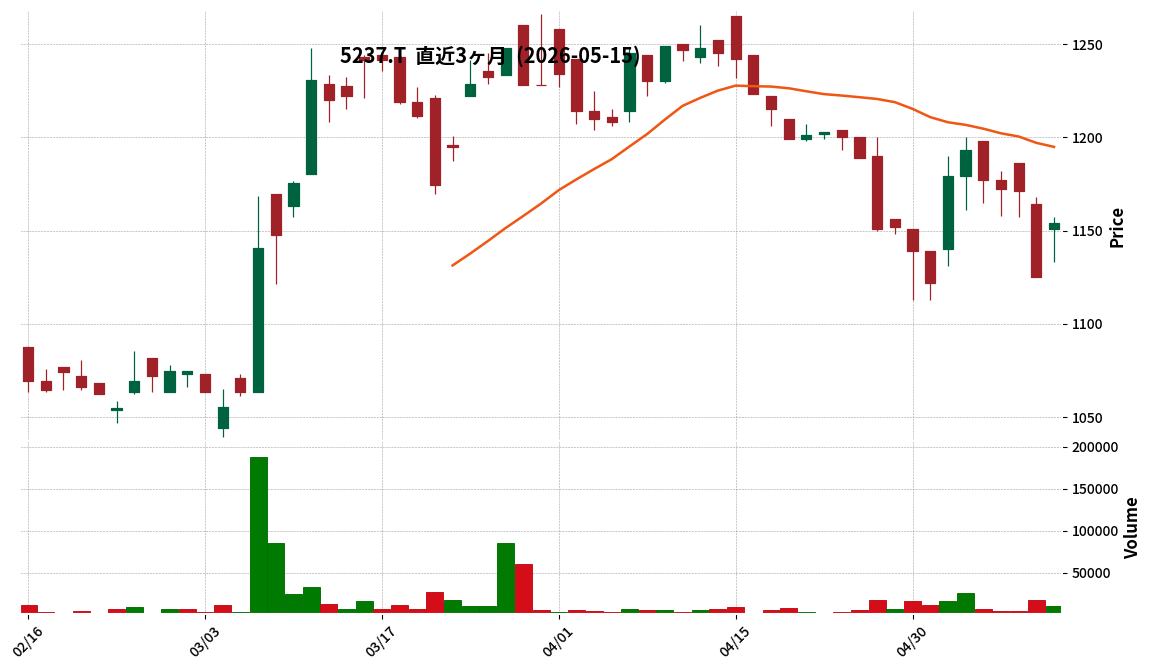
5237|ノザワ
1154.0
▲ +2.58%
This article is an AI-generated summary and analysis of official IR disclosures.
📄 Announcement (AI-Reviewed)
- Nozawa reported consolidated net sales of JPY 22,312 million for the fiscal year ended March 2026, marking an increase of JPY 358 million from the previous year.
- Operating profit reached JPY 1,993 million (up JPY 313 million YoY) and ordinary profit reached JPY 2,166 million (up JPY 328 million YoY), indicating increased revenue and profit at these levels.
- Net profit attributable to owners of parent decreased by JPY 551 million year-on-year to JPY 605 million. This decline was primarily due to increased special losses, including a JPY 948 million increase in litigation losses, an impairment loss of JPY 271 million for “MineMag” products, and JPY 91 million in inventory write-downs.
- Sales of the flagship “Asloc” product decreased by JPY 503 million to JPY 10,098 million, while sales of extruded cement boards for residential use increased by JPY 793 million to JPY 7,394 million.
- Consolidated cash flows showed JPY 236 million from operating activities, a decrease of JPY 790 million from investing activities, and a decrease of JPY 478 million from financing activities. Cash and cash equivalents at the end of the period decreased by JPY 1,032 million year-on-year to JPY 5,723 million.
🤖 AI Perspective
Nozawa’s FY2026/3 financial results indicate solid performance in revenue and ordinary profit, but the significant special losses appear to have heavily impacted the final net profit. Investors may consider these special losses, particularly litigation and impairment charges, as points of interest for future strategic monitoring. Conversely, the growth in residential product sales could suggest resilience in specific segments of the construction market, which is worth noting.
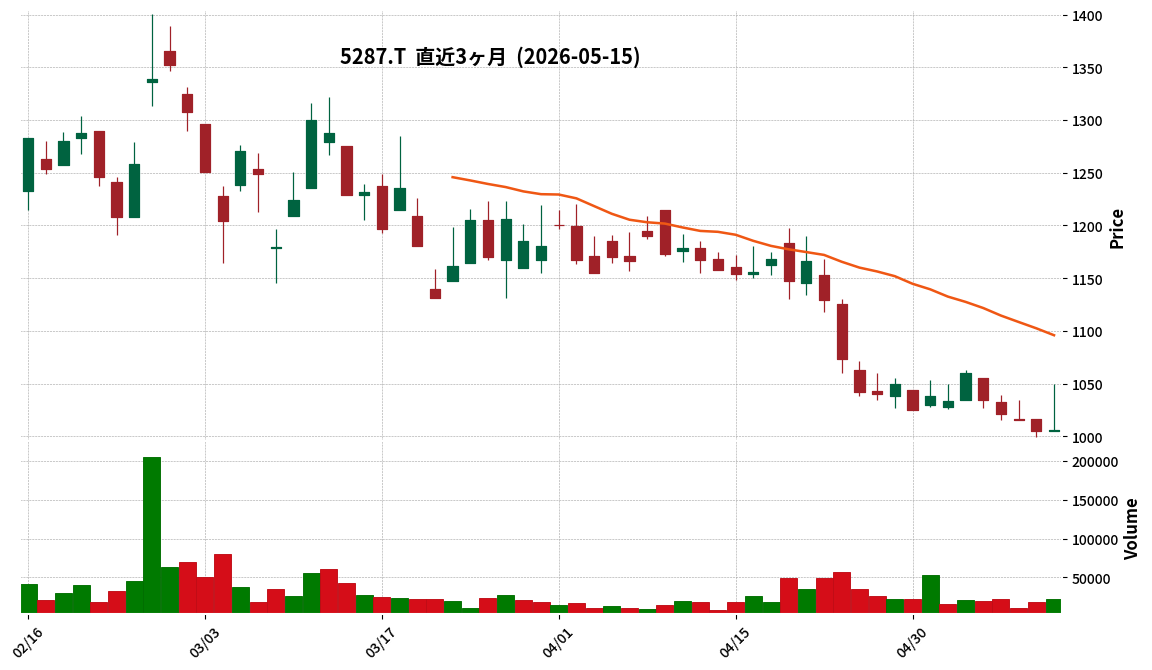
5287|イトーヨーギョー
1006.0
▲ +0.10%
📎 Source:イトーヨーギョー Official IR →
This article is an AI-generated summary and analysis of official IR disclosures.
📄 Announcement (AI-Reviewed)
- ITOYOGYO announced its financial results for the fiscal year ended March 31, 2026.
- Net sales reached ¥3,933 million, representing a 15.6% increase compared to the previous fiscal year.
- Operating profit was ¥336 million (+66.9% year-on-year), and ordinary profit was ¥334 million (+68.9% year-on-year).
- Net income for the period was ¥320 million, marking an 8.1% decrease from the previous fiscal year.
- Earnings per share (EPS) for the fiscal year were ¥108.80.
- The company plans a year-end dividend of ¥22.00, totaling ¥22.00 for the year (compared to ¥20.00 in the previous year).
- For the fiscal year ending March 31, 2027, the company forecasts net sales of ¥4,000 million (+1.7%), operating profit of ¥270 million (-19.8%), ordinary profit of ¥274 million (-18.1%), net income of ¥200 million (-35.8%), and EPS of ¥67.85.
🤖 AI Perspective
ITOYOGYO’s FY2026/3 results show significant growth in sales, operating profit, and ordinary profit, while net income decreased. This could suggest a combination of strong operational performance alongside factors impacting non-operating or extraordinary items. The forecast for FY2027/3 anticipates continued revenue growth but a decline in profits, which might indicate a cautious outlook on future market conditions or increased investments, making it a point for investors to monitor.
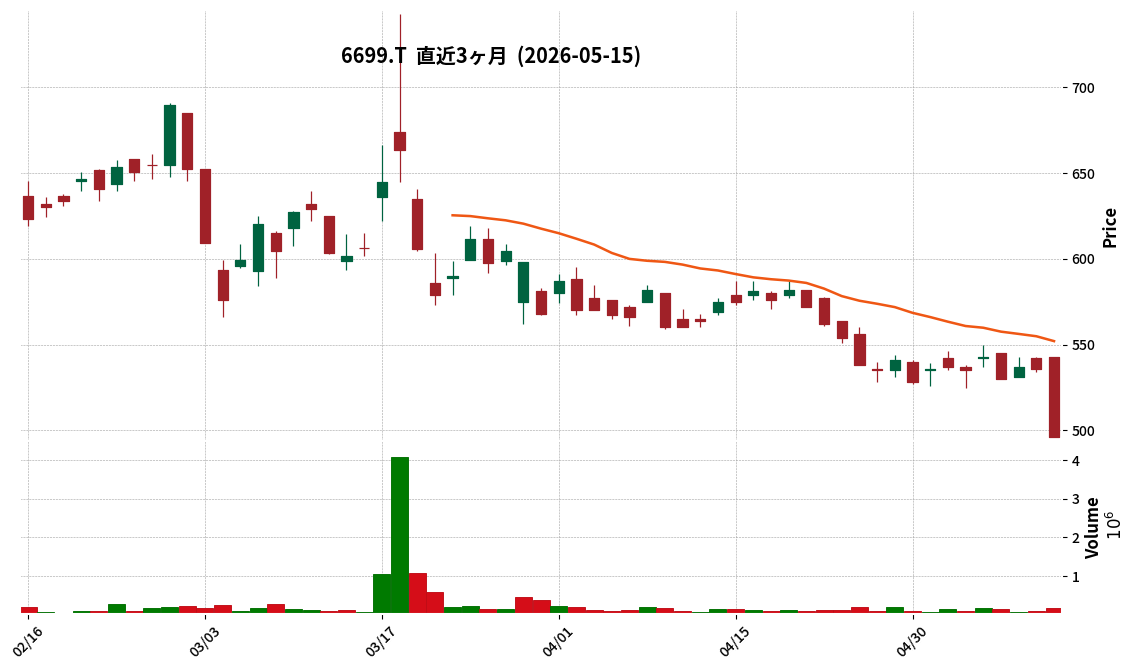
6699|ダイヤHD
496.0
▼ -7.46%
This article is an AI-generated summary and analysis of official IR disclosures.
📄 Announcement (AI-Reviewed)
- Diamond Electric Holdings Co., Ltd. announced its consolidated financial results for the fiscal year ended March 31, 2026 (April 1, 2025 to March 31, 2026).
- Consolidated net sales totaled ¥96,768 million, representing a 5.5% increase compared to the previous fiscal year.
- Consolidated operating profit was ¥2,753 million, up 21.3% year-on-year.
- Consolidated ordinary profit reached ¥2,738 million, marking an 86.6% increase from the prior fiscal year.
- Net income attributable to owners of parent was ¥819 million, a 99.1% increase year-on-year.
- For the fiscal year ending March 31, 2027, the company forecasts consolidated net sales of ¥99,400 million (up 2.7%), operating profit of ¥1,750 million (down 36.4%), ordinary profit of ¥510 million (down 81.4%), and net income attributable to owners of parent of ¥10 million (down 98.8%).
- The annual dividend for the fiscal year ended March 31, 2026, was ¥25.00 per share, consistent with the previous year. The forecast for FY2027/3 is also ¥25.00 per share.
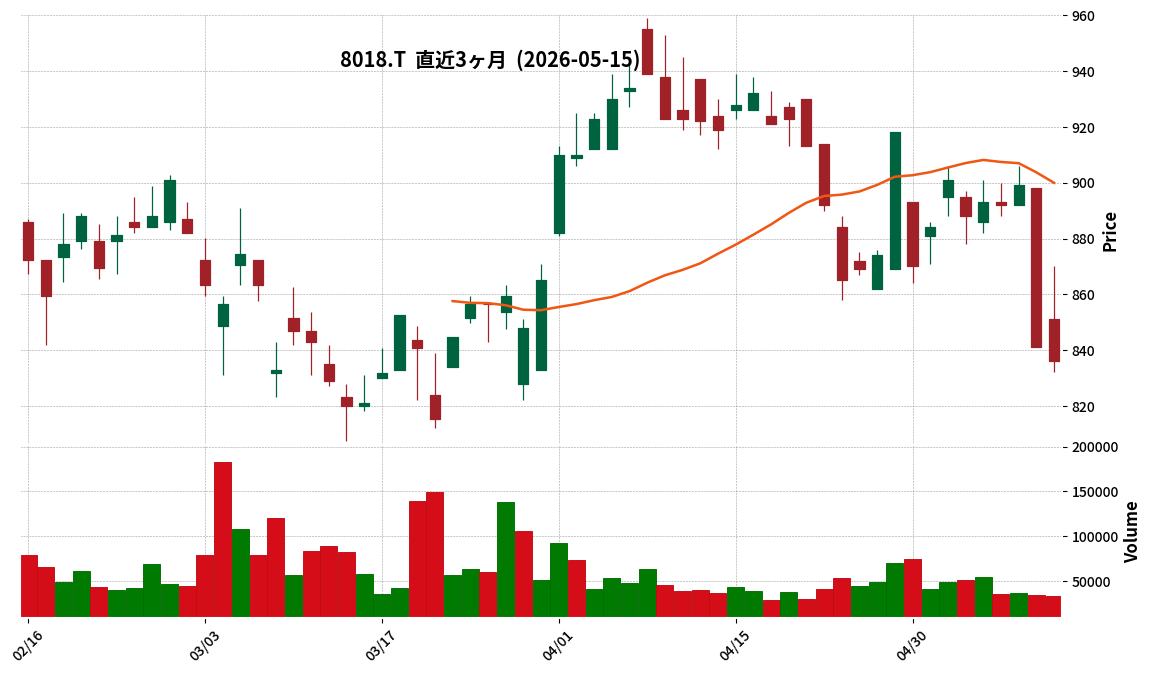
8018|三共生興
836.0
▼ -0.59%
This article is an AI-generated summary and analysis of official IR disclosures.
📄 Announcement (AI-Reviewed)
- Sankyo Seikō announced its consolidated financial results for the fiscal year ended March 31, 2026. Net sales were ¥23,984 million (down 2.5% year-on-year), operating profit was ¥750 million (down 57.5%), ordinary profit was ¥2,085 million (down 21.0%), and net income attributable to owners of parent was ¥2,069 million (down 1.9%).
- The company recorded a loss on valuation of inventories of ¥531 million and impairment losses on trademarks and goodwill of ¥1,526 million for its “DAKS” and “LEONARD” brands to mitigate future loss recognition risks.
- A gain on sale of investment securities of ¥3,162 million was recorded as an extraordinary gain.
- The annual dividend for FY2026 remained unchanged at ¥27.00 per share (interim ¥13.50, year-end ¥13.50).
- For the fiscal year ending March 31, 2027, the consolidated performance forecast projects net sales of ¥24,000 million (up 0.1% year-on-year), operating profit of ¥1,500 million (up 100.0%), ordinary profit of ¥2,600 million (up 24.7%), and net income attributable to owners of parent of ¥2,000 million (down 3.3%).
🤖 AI Perspective
The FY2026 consolidated results indicate that significant valuation and impairment losses on key brands substantially impacted operating and ordinary profits. However, the extraordinary gain from the sale of investment securities appears to have mitigated the decline in net income. The projected substantial recovery in operating profit for FY2027 suggests that investors may focus on the potential for business recovery following the previous year’s special losses.
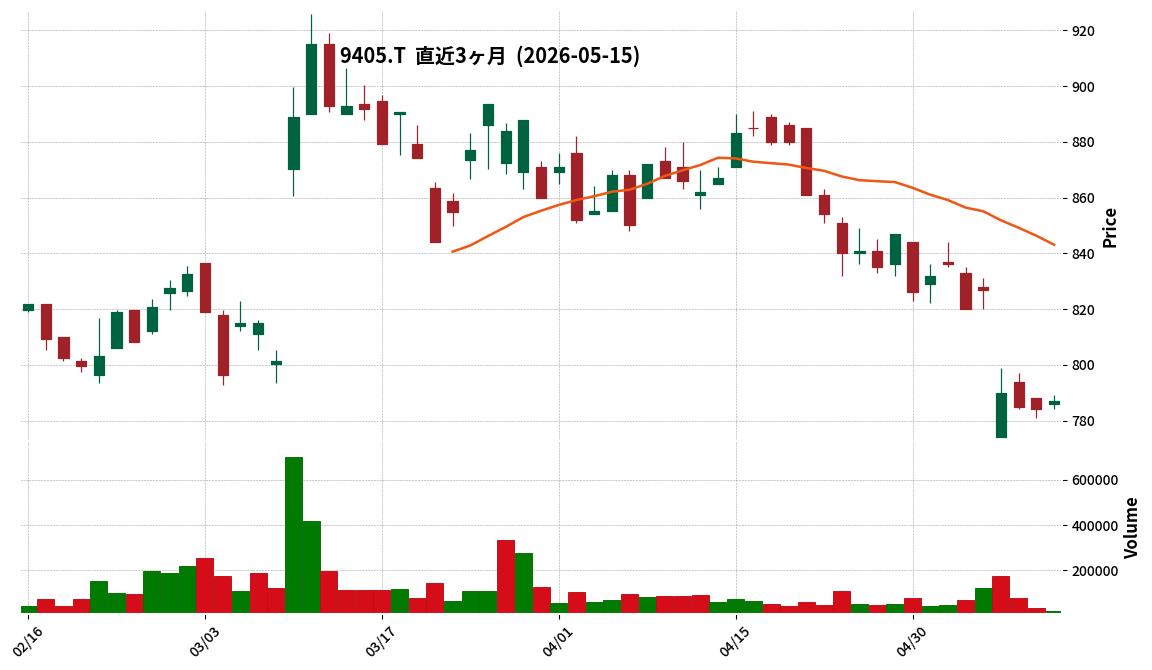
9405|朝日放送グループHD
787.0
▲ +0.38%
📎 Source:朝日放送グループHD Official IR →
This article is an AI-generated summary and analysis of official IR disclosures.
📄 Announcement (AI-Reviewed)
- Asahi Broadcasting Group Holdings Corporation announced a partial correction to its “FY2026/3 Financial Results [Japanese GAAP] (Consolidated)” on May 15, 2026.
- The reason for the correction was an error in the scheduled date for the online briefing for institutional investors and analysts.
- The previously stated date for the briefing was Monday, May 18, 2026.
- The corrected date for the briefing has been changed to Wednesday, May 20, 2026.
- The scheduled time for the release of materials for the briefing, which is 10:00 AM on the day of the event on the company’s website, remains unchanged.
🤖 AI Perspective
This correction pertains to the scheduling of the investor briefing, not to the financial figures themselves. For investors and analysts, accurate scheduling information is crucial for planning their engagement and information gathering. The prompt correction of the date may help ensure that stakeholders can attend the briefing as planned and receive timely information.
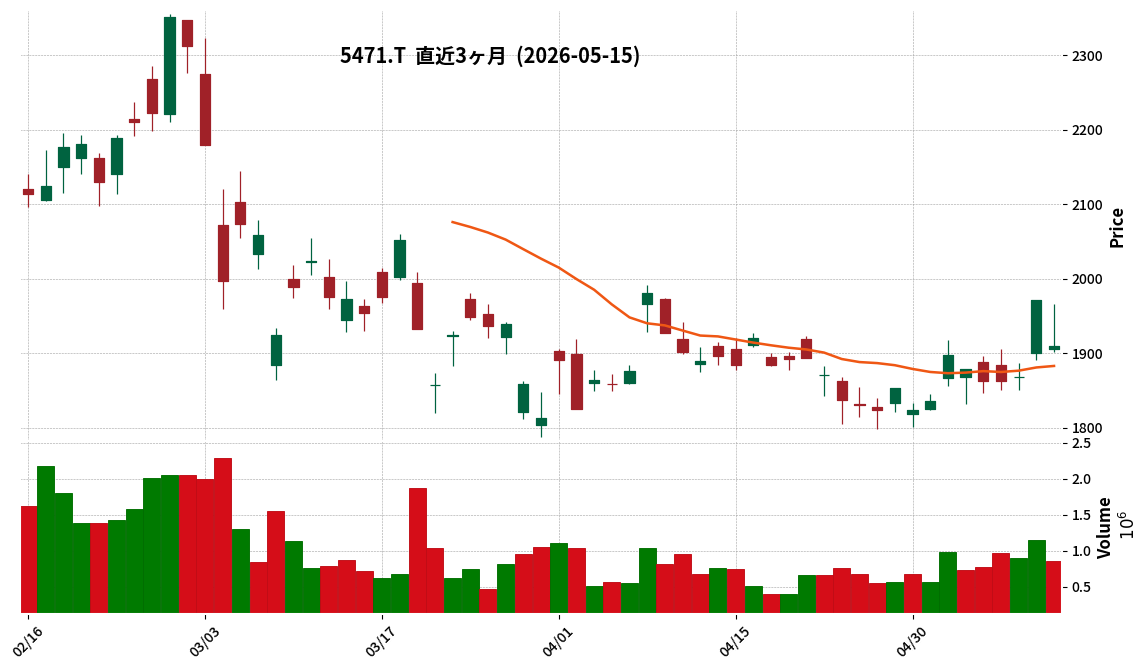
5471|大同特鋼
1910.0
▼ -3.12%
This article is an AI-generated summary and analysis of official IR disclosures.
📄 Announcement (AI-Reviewed)
- Daido Steel Co., Ltd. announced its consolidated financial results for the fiscal year ended March 31, 2026.
- Revenue increased by 0.6% year-on-year to ¥578,129 million.
- Profit attributable to owners of the parent company increased by 15.2% year-on-year to ¥32,605 million.
- Adjusted operating profit was ¥39,920 million, representing a 9.2% decrease from the previous fiscal year.
- The annual dividend per share was set at ¥49 (¥22 interim, ¥27 year-end).
- For the fiscal year ending March 31, 2027, the company forecasts consolidated revenue of ¥630,000 million (up 9.0% year-on-year) and profit attributable to owners of the parent company of ¥27,500 million (down 15.7% year-on-year), with an annual dividend of ¥52.
🤖 AI Perspective
Daido Steel’s FY2026/3 results show an increase in both revenue and profit attributable to owners of the parent, which indicates overall growth. However, the decrease in adjusted operating profit suggests a potential shift in profit structure or impact from cost factors that could be worth further examination. Additionally, the company’s forecast for the next fiscal year anticipates higher revenue but lower profit, which may warrant attention when assessing future business prospects.
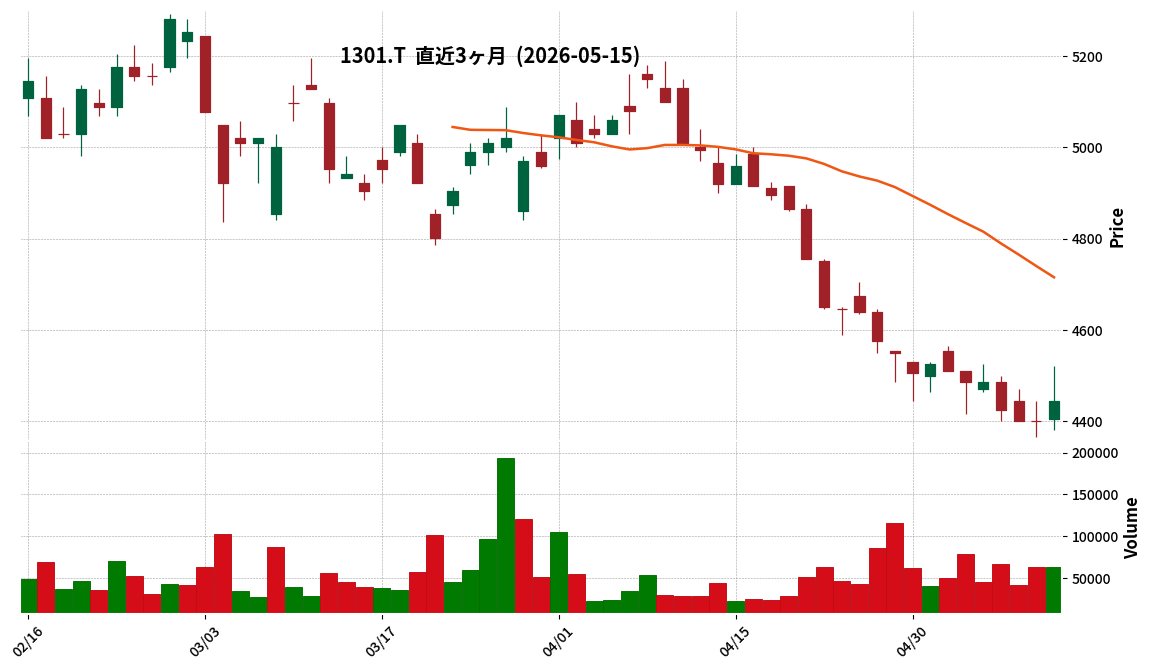
1301|極洋
4445.0
▲ +1.02%
This article is an AI-generated summary and analysis of official IR disclosures.
📄 Announcement (AI-Reviewed)
- Kyokuyo Co., Ltd. announced its consolidated financial results for the fiscal year ended March 31, 2026 (April 1, 2025 – March 31, 2026).
- Consolidated net sales reached ¥334,612 million, representing a 10.5% increase from the previous fiscal year.
- Net profit attributable to owners of parent increased by 1.5% to ¥6,841 million.
- Consolidated operating profit was ¥10,731 million (down 3.1% year-on-year), and consolidated ordinary profit was ¥10,031 million (down 7.6% year-on-year).
- The annual dividend for the fiscal year ended March 31, 2026, is set at ¥150.00 per share (an increase of ¥20 from the previous year).
- For the fiscal year ending March 31, 2027, the company forecasts consolidated net sales of ¥365,000 million (up 9.1%), operating profit of ¥12,000 million (up 11.8%), ordinary profit of ¥11,000 million (up 9.7%), and net profit attributable to owners of parent of ¥7,200 million (up 5.2%).
🤖 AI Perspective
Kyokuyo’s FY2026/3 results show an increase in revenue and net profit, while operating and ordinary profits declined. This suggests that while sales volume grew, factors impacting profit margins may have been present. The increase in the dividend payment and the positive outlook for FY2027/3, forecasting growth across all key metrics, could indicate management’s confidence in future performance and strategic initiatives.
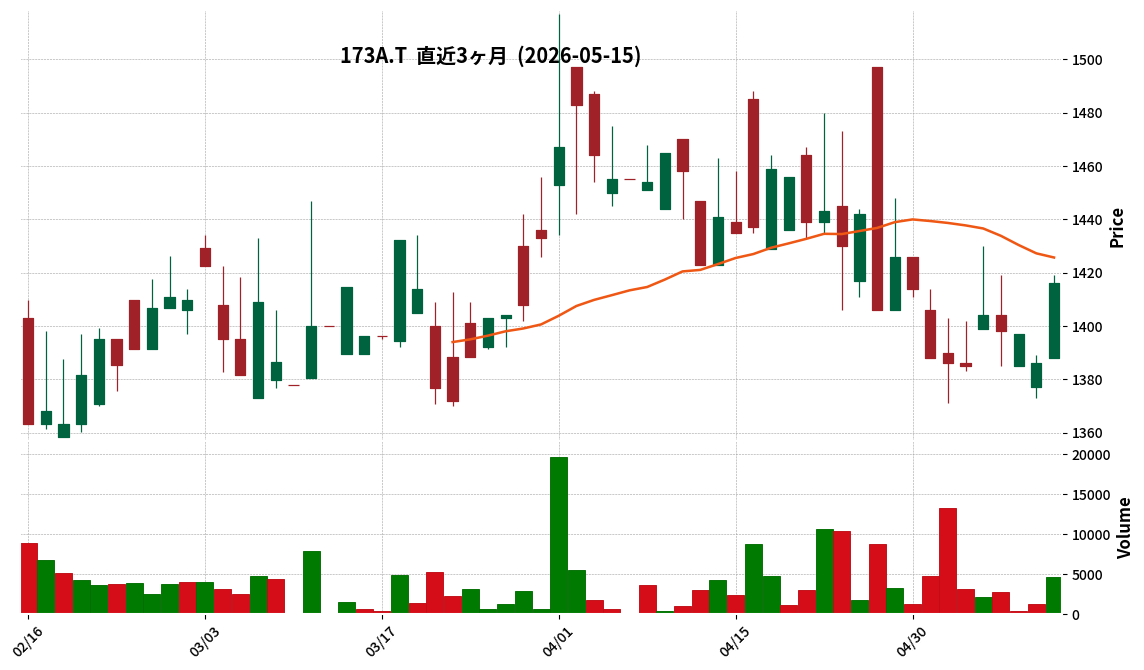
173A|G-ハンモック
1416.0
▲ +2.16%
📎 Source:G-ハンモック Official IR →
This article is an AI-generated summary and analysis of official IR disclosures.
📄 Announcement (AI-Reviewed)
- For the fiscal year ended March 2026, sales were ¥4,889 million (up 3.9% YoY), operating profit was ¥834 million (up 5.5% YoY), ordinary profit was ¥867 million (up 4.7% YoY), and net profit was ¥685 million (up 10.9% YoY).
- Earnings per share for the fiscal year ended March 2026 were ¥162.93, and the equity ratio was 45.2%.
- The annual dividend per share for the fiscal year ended March 2026 increased to ¥40 (from ¥30 in the previous fiscal year).
- For the full-year forecast of the fiscal year ending March 2027, the company expects sales of ¥5,287 million (up 8.1% YoY), net profit of ¥585 million (down 14.6% YoY), and earnings per share of ¥138.98.
- In Network Solutions, a new version of AssetView Cloud+ was released, adding ChatGPT submission log acquisition functionality and strengthening external system integration options.
🤖 AI Perspective
G-HAMMOCK achieved increased revenue and profit for the fiscal year ended March 2026, with all key financial metrics showing year-over-year growth. The 10.9% increase in net profit and the higher dividend per share may indicate a strong financial performance and a commitment to shareholder returns. However, the forecast for the next fiscal year (ending March 2027) projects an increase in sales but a decrease in net profit, which could warrant closer examination by investors regarding the underlying factors.
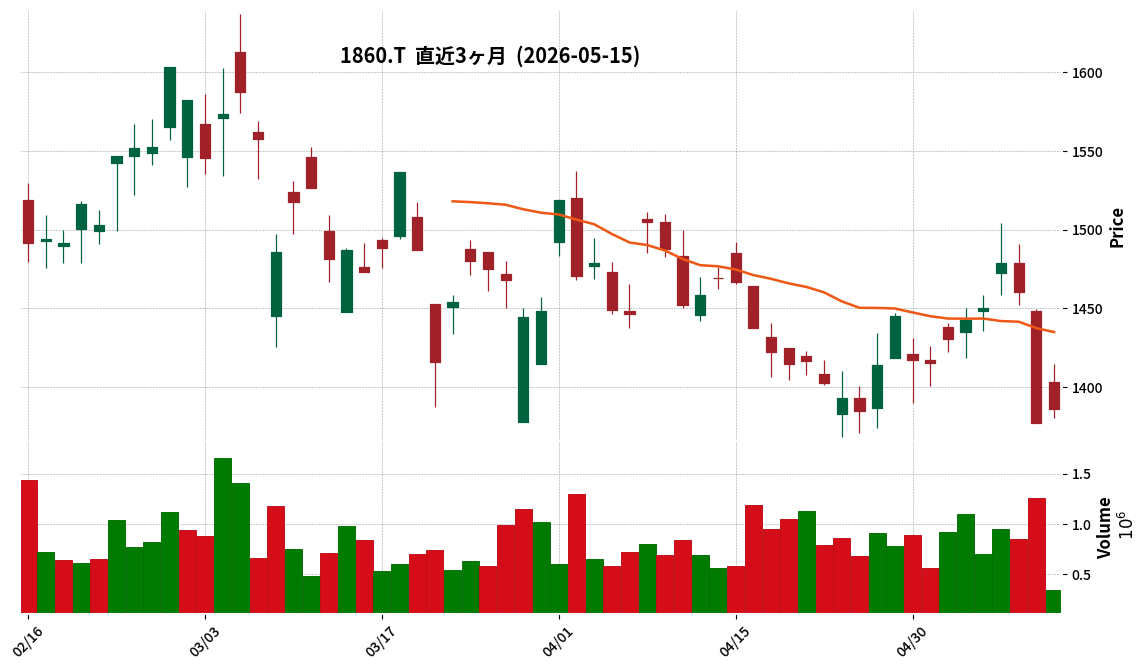
1860|戸田建
1386.0
▲ +0.65%
This article is an AI-generated summary and analysis of official IR disclosures.
📄 Announcement (AI-Reviewed)
- Toda Corporation announced consolidated financial results for the fiscal year ended March 31, 2026, reporting net sales of ¥645,737 million (up 10.1% year-on-year), operating profit of ¥38,215 million (up 43.5%), ordinary profit of ¥43,984 million (up 51.2%), and profit attributable to owners of parent of ¥36,981 million (up 46.8%).
- Diluted earnings per share (EPS) for the fiscal year was ¥123.34, an increase from ¥83.59 in the prior year.
- The annual dividend for FY2026 totaled ¥58.00 per share, consisting of an interim dividend of ¥20.00 and a year-end dividend of ¥38.00.
- For the fiscal year ending March 31, 2027, the company forecasts consolidated net sales of ¥753,000 million (up 16.6% year-on-year), operating profit of ¥39,000 million (up 2.1%), ordinary profit of ¥40,000 million (down 9.1%), and profit attributable to owners of parent of ¥35,000 million (down 5.4%).
- Total assets increased to ¥998,399 million, net assets to ¥403,161 million, and the equity ratio improved to 39.1%.
🤖 AI Perspective
Toda Corporation’s FY2026 results show significant growth across key financial metrics, with operating profit notably increasing by over 40%. The substantial increase in the annual dividend payment may indicate a commitment to shareholder returns. However, while the FY2027 outlook projects continued revenue growth, a forecasted decrease in ordinary and net profit suggests that the company may be factoring in potential impacts from ongoing investments or evolving market conditions.
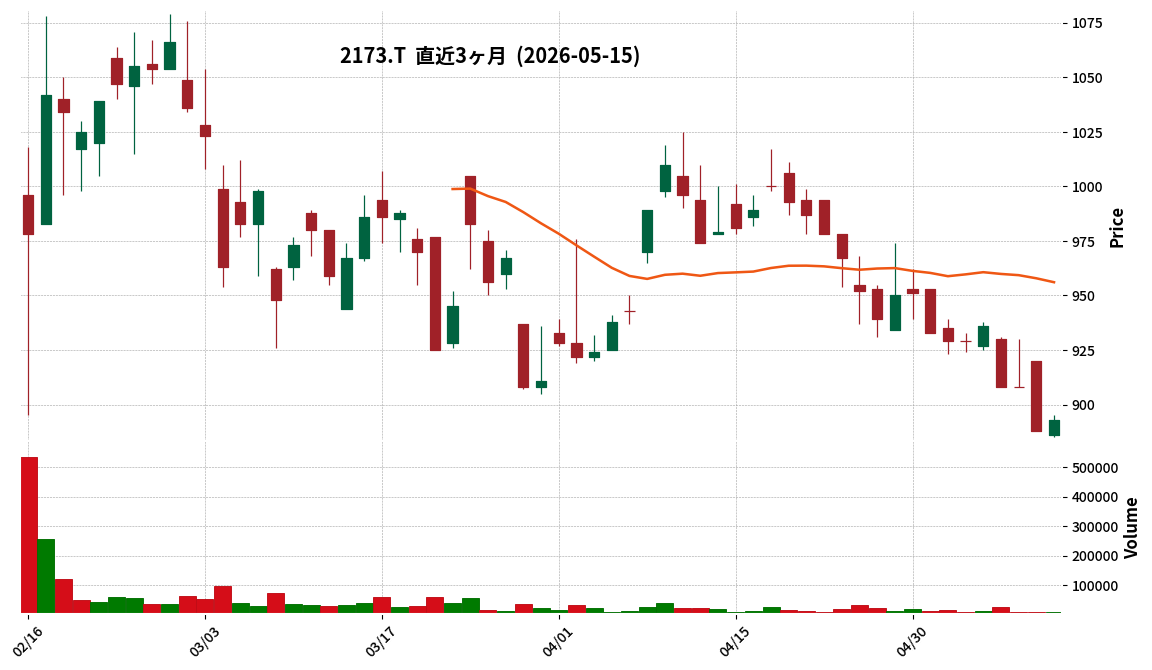
2173|G-博展
893.0
▲ +0.56%
This article is an AI-generated summary and analysis of official IR disclosures.
📄 Announcement (AI-Reviewed)
- For the first quarter of the fiscal year ending December 2026 (January 1, 2026, to March 31, 2026), consolidated net sales increased by 13.5% year-on-year to ¥4,811 million.
- Consolidated operating profit was ¥138 million (down 53.2% year-on-year), ordinary profit was ¥140 million (down 51.9% year-on-year), and net profit attributable to owners of parent was ¥101 million (down 47.3% year-on-year).
- Basic earnings per share for the quarter were ¥6.49.
- As of the end of the quarter, consolidated total assets were ¥8,516 million (down ¥1,666 million from the end of the previous fiscal year), net assets were ¥4,785 million (down ¥217 million), and the equity ratio was 56.1%.
- The full-year consolidated earnings forecast and dividend forecast for the fiscal year ending December 2026 remain unchanged from the most recently announced figures.
🤖 AI Perspective
Hakuten Corp.’s Q1 FY2026 results show a notable increase in sales, while key profit metrics experienced significant declines. This could suggest a compression in profit margins relative to sales. The company has maintained its full-year earnings forecast, which may indicate that the first-quarter performance is largely in line with its internal projections. Investors may monitor future quarters for trends in profitability and margin improvements.
357A|P-エフアンドエフ
6240.0
▲ +0.00%
📎 Source:P-エフアンドエフ Official IR →
This article is an AI-generated summary and analysis of official IR disclosures.
📄 Announcement (AI-Reviewed)
- P-F&F reported consolidated results for the fiscal year ended March 2026: net sales of ¥6,283 million (up 12.1% year-on-year), operating profit of ¥353 million (up 29.6%), ordinary profit of ¥374 million (up 4.1%), and profit attributable to owners of parent of ¥243 million (up 16.9%).
- As of the end of March 2026, consolidated total assets were ¥3,295 million (down 5.1% from the previous fiscal year-end), net assets were ¥815 million (up 33.5%), and the equity ratio was 24.7%.
- Consolidated cash flows showed net cash provided by operating activities of ¥235 million, net cash used in investing activities of ¥41 million, and net cash used in financing activities of ¥356 million. Cash and cash equivalents at the end of the period stood at ¥522 million.
- The annual dividend for the fiscal year ended March 2026 was ¥130.00 per share (year-end), totaling ¥130.00 annually, with a payout ratio of 16.0%.
- For the fiscal year ending March 2027, the company forecasts consolidated net sales of ¥6,291 million (up 0.1% year-on-year), operating profit of ¥300 million (down 15.2%), ordinary profit of ¥304 million (down 18.9%), profit attributable to owners of parent of ¥197 million (down 19.0%), and earnings per share of ¥656.2.
🤖 AI Perspective
While P-F&F achieved increased revenue and profit for the fiscal year ended March 2026, investors may note the forecast for a decrease in profit for the upcoming fiscal year ending March 2027. This could indicate the company’s anticipation of adapting to changes in the pharmacy industry, such as revisions to medical service fees and the promotion of medical DX. The cash flow statement, showing strong cash generation from operating activities but outflows from investing and financing, may suggest ongoing strategic investments and debt management.
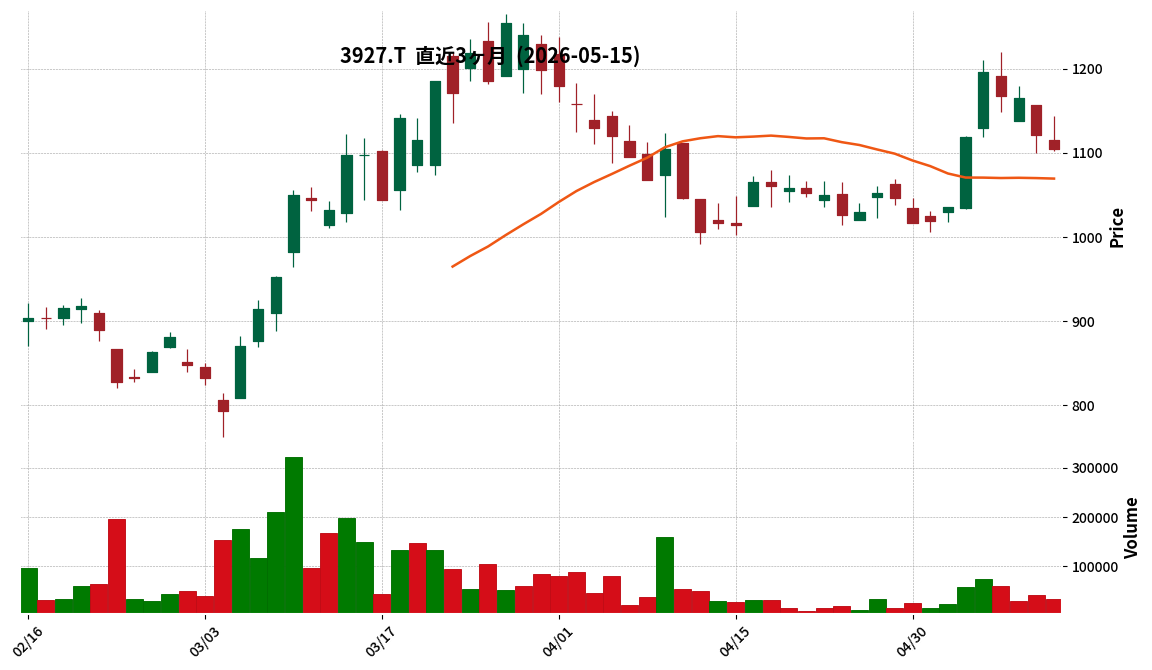
3927|フーバーブレイン
1105.0
▼ -1.43%
📎 Source:フーバーブレイン Official IR →
This article is an AI-generated summary and analysis of official IR disclosures.
📄 Announcement (AI-Reviewed)
- Fuva Brain Co., Ltd. reported consolidated results for the fiscal year ended March 2026: Net sales of JPY 5,641 million (up 29.0% year-on-year), Operating income of JPY 203 million (up 8.7%), Ordinary income of JPY 205 million (up 23.9%), and Net income attributable to owners of parent of JPY 308 million (up 181.9%).
- Adjusted net sales amounted to JPY 6,057 million (up 38.5% year-on-year), adjusted operating income was JPY 734 million (up 152.7%), and adjusted ordinary income was JPY 736 million (up 173.5%).
- The year-end dividend for FY2026/3 was JPY 15 per share, resulting in a total annual dividend of JPY 15 per share and an aggregate dividend of JPY 80 million.
- For the fiscal year ending March 2027, the company forecasts consolidated net sales of JPY 7,915 million (up 40.3% year-on-year), operating income of JPY 449 million (up 120.4%), ordinary income of JPY 420 million (up 104.2%), and net income attributable to owners of parent of JPY 330 million (up 7.0%).
- The company’ transitioned to the Standard Market of the Tokyo Stock Exchange on February 6, 2026.
🤖 AI Perspective
Fuva Brain’s FY2026/3 results show significant growth in both net sales and net income, with a particularly strong increase in adjusted profits. This trend may suggest the effectiveness of its growth strategies, including organic expansion and M&A activities, which appear to have positively impacted sales from investment securities. The initiation of dividends and the forecast for a further increase could indicate a commitment to enhanced shareholder returns.
Disclaimer: This article is for informational purposes only and does not constitute investment advice.
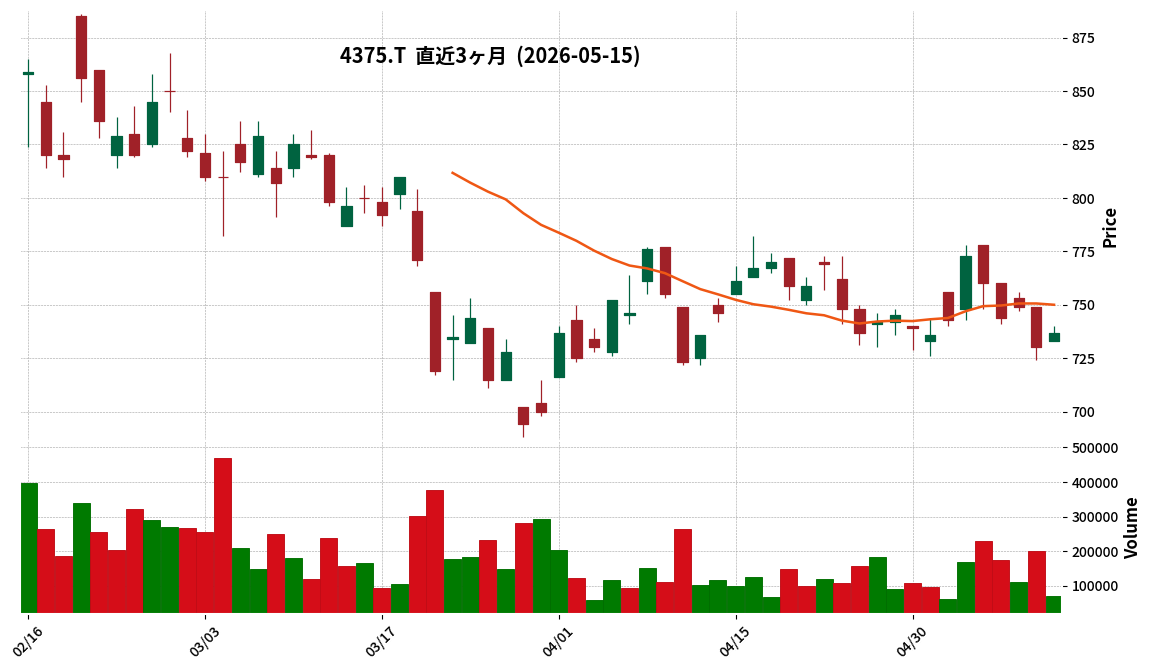
4375|G-セーフィー
737.0
▲ +0.96%
📎 Source:G-セーフィー Official IR →
This article is an AI-generated summary and analysis of official IR disclosures.
📄 Announcement (AI-Reviewed)
- Safie Inc. announced its Q1 FY2026 consolidated financial results for the period from January 1, 2026, to March 31, 2026.
- Consolidated net sales reached 5,107 million JPY, an increase of 20.9% from 4,223 million JPY in the same period last year.
- Consolidated operating income turned positive at 105 million JPY, compared to an operating loss of 20 million JPY in the prior year.
- Consolidated ordinary income also turned positive to 201 million JPY from a loss of 26 million JPY, and profit attributable to owners of parent became 165 million JPY from a loss of 62 million JPY.
- Basic earnings per share for the quarter were 2.97 JPY, a significant improvement from a loss of 1.13 JPY in the previous year.
- As of March 31, 2026, Annual Recurring Revenue (ARR) stood at 14,996 million JPY (up 21.5% YoY), and the number of billed cameras reached 370,000 units (up 20.9% YoY).
- The consolidated full-year forecast for FY2026 remains unchanged, with projected net sales of 23,215 million JPY and adjusted operating income of 450-650 million JPY.
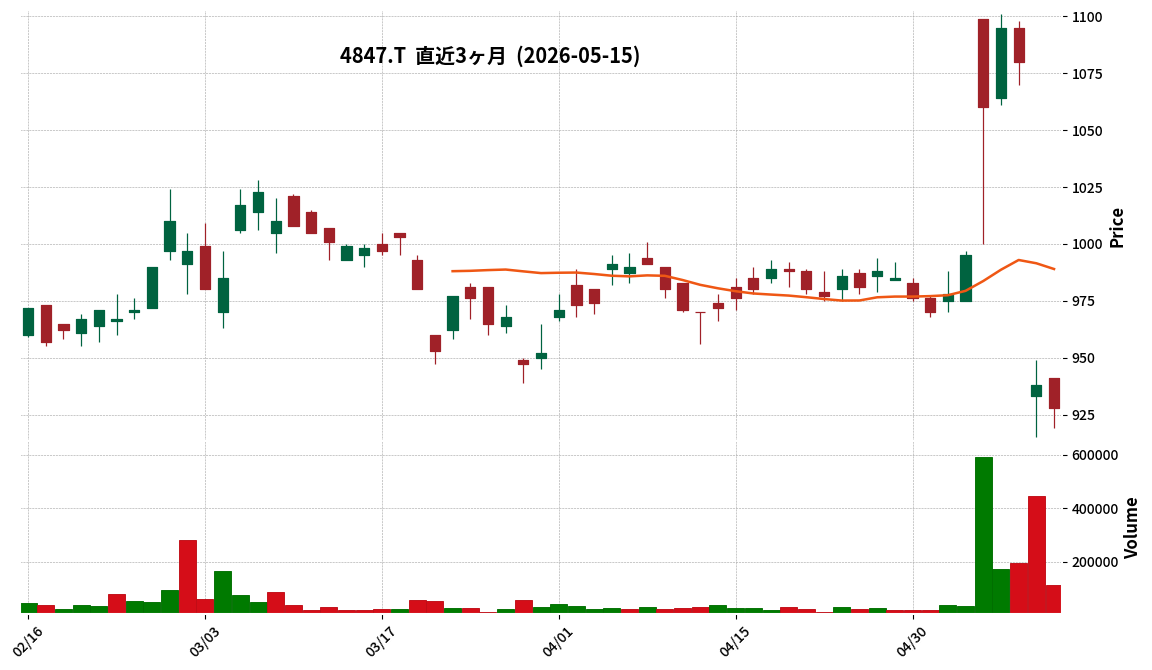
4847|IWI
928.0
▼ -1.07%
This article is an AI-generated summary and analysis of official IR disclosures.
📄 Announcement (AI-Reviewed)
- IWI released its Q3 FY2026 earnings presentation materials on May 15, 2026.
- For the cumulative Q3 FY2026 period, net sales were ¥12,497 million, an increase of 8.4% year-on-year.
- Operating profit for the same period was ¥1,361 million (down 5.8% YoY), ordinary profit was ¥1,391 million (down 4.7% YoY), and net income attributable to owners of parent was ¥951 million (down 7.1% YoY).
- The decrease in profits was attributed to quality control measures and the product mix within the security segment.
- The full-year forecast was revised downwards, with projected net sales of ¥17,200 million (a ¥200 million decrease from the initial forecast) and operating profit of ¥2,000 million (a ¥400 million decrease from the initial forecast).
🤖 AI Perspective
While sales showed robust growth, the company’s profits declined due to quality response measures and changes in product mix, as indicated in the report. The downward revision of the full-year earnings forecast appears to stem from prolonged quality control efforts for specific client projects. Investors may wish to monitor the ongoing IT investment resilience in the payment market and the progress of corrective actions addressing overall company challenges.
Disclaimer: This article is for informational purposes only and does not constitute investment advice.
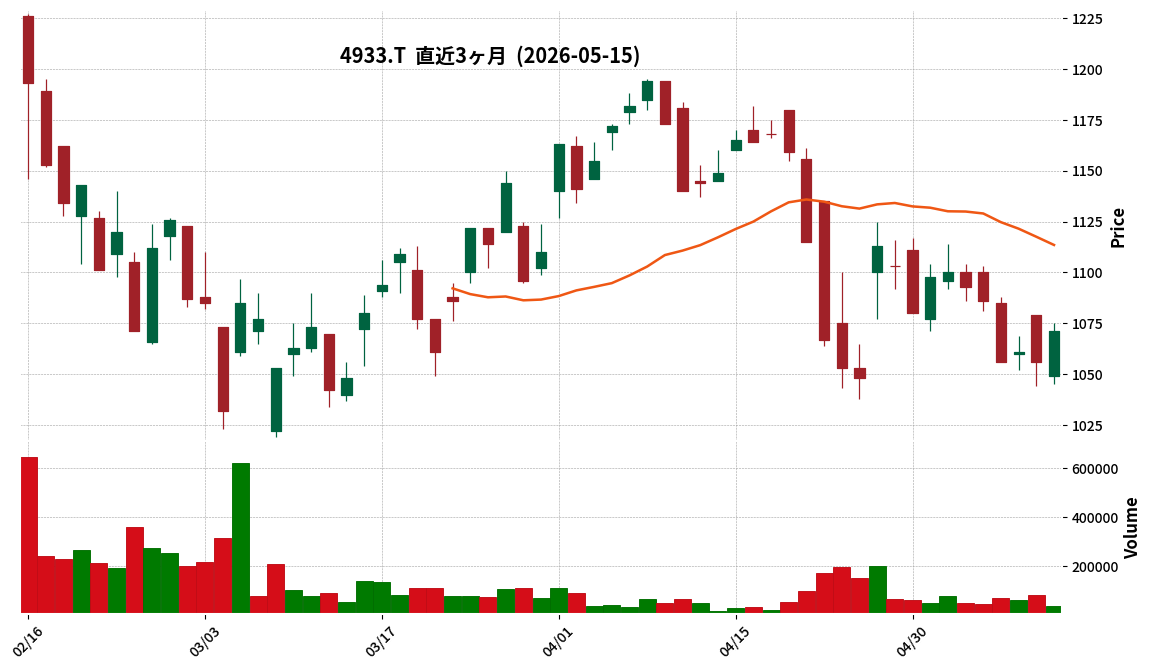
4933|Ine
1071.0
▲ +1.42%
This article is an AI-generated summary and analysis of official IR disclosures.
📄 Announcement (AI-Reviewed)
- I-ne Corporation announced its consolidated financial results for the fiscal year ended December 31, 2025 (January 1, 2025 to December 31, 2025).
- Consolidated net sales reached ¥48,975 million, representing an 8.8% increase compared to the previous fiscal year.
- EBITDA was ¥5,626 million, an 8.3% increase year-over-year.
- Operating profit was ¥3,880 million (a 14.4% decrease year-over-year), and ordinary profit was ¥3,830 million (a 16.2% decrease year-over-year).
- Net income attributable to owners of parent amounted to ¥2,097 million, down 28.9% from the previous fiscal year.
- Basic earnings per share stood at ¥119.64.
- A year-end dividend of ¥15.00 per share is planned for the fiscal year ended December 2025 (total annual dividend of ¥15.00 per share).
- For the fiscal year ending December 2026, the company forecasts consolidated net sales of ¥52,000 million to ¥54,000 million, EBITDA of ¥1,200 million to ¥2,700 million, and operating profit of -¥500 million to ¥1,000 million.
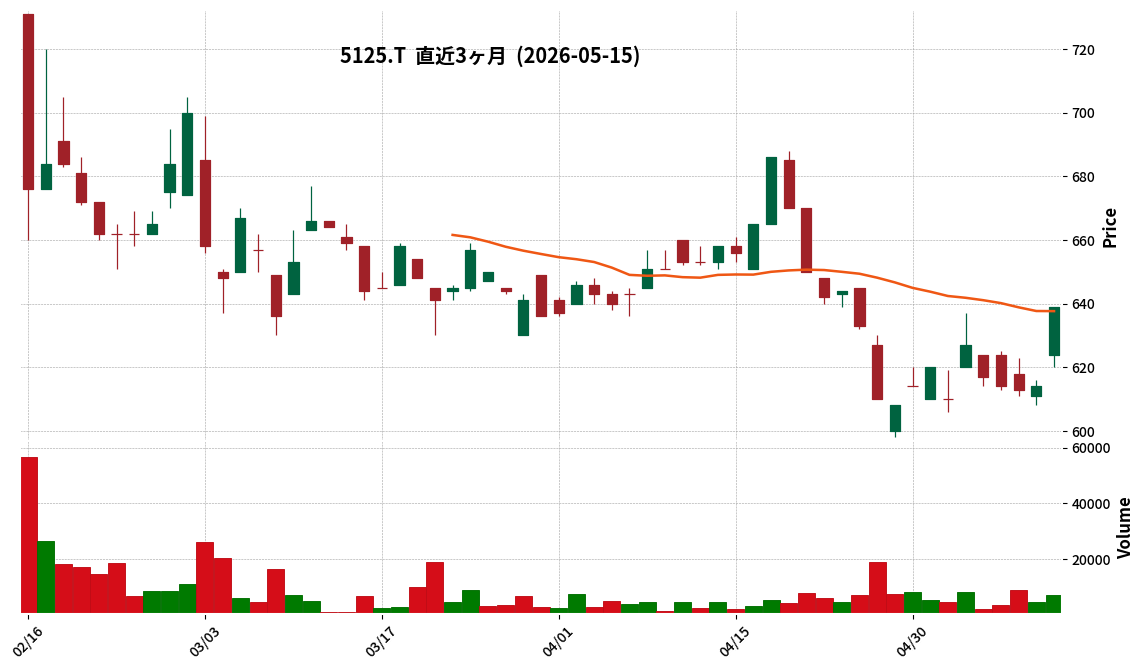
5125|G-ファインズ
639.0
▲ +4.07%
📎 Source:G-ファインズ Official IR →
This article is an AI-generated summary and analysis of official IR disclosures.
📄 Announcement (AI-Reviewed)
- G-FINES announced its Q3 FY2026 financial results for the period from July 1, 2025, to March 31, 2026.
- For the nine months ended March 31, 2026, consolidated net sales were ¥1,843 million, operating profit was ¥61 million, ordinary profit was ¥67 million, and net profit attributable to owners of the parent was ¥43 million.
- Consolidated quarterly financial statements were prepared starting from Q3 FY2026, thus year-on-year percentage changes are not provided.
- The company has included Olupura Co., Ltd. and Nexil Co., Ltd. within its scope of consolidation from this period.
- The full-year consolidated earnings forecast includes net sales of ¥2,747 million, operating profit of ¥131 million, ordinary profit of ¥136 million, net profit attributable to owners of the parent of ¥81 million, and basic earnings per share of ¥18.33.
🤖 AI Perspective
The transition to consolidated financial statements from this period marks a significant change in reporting, making direct comparisons to previous individual results not feasible. The inclusion of Olupura and Nexil in the consolidation scope indicates a strategic shift towards a “talent platform” business model, which may suggest a new direction for the company’s growth. Investors might focus on how the accelerated provision of RPO services, leveraging AI technology, contributes to future performance within the expanding DX market.
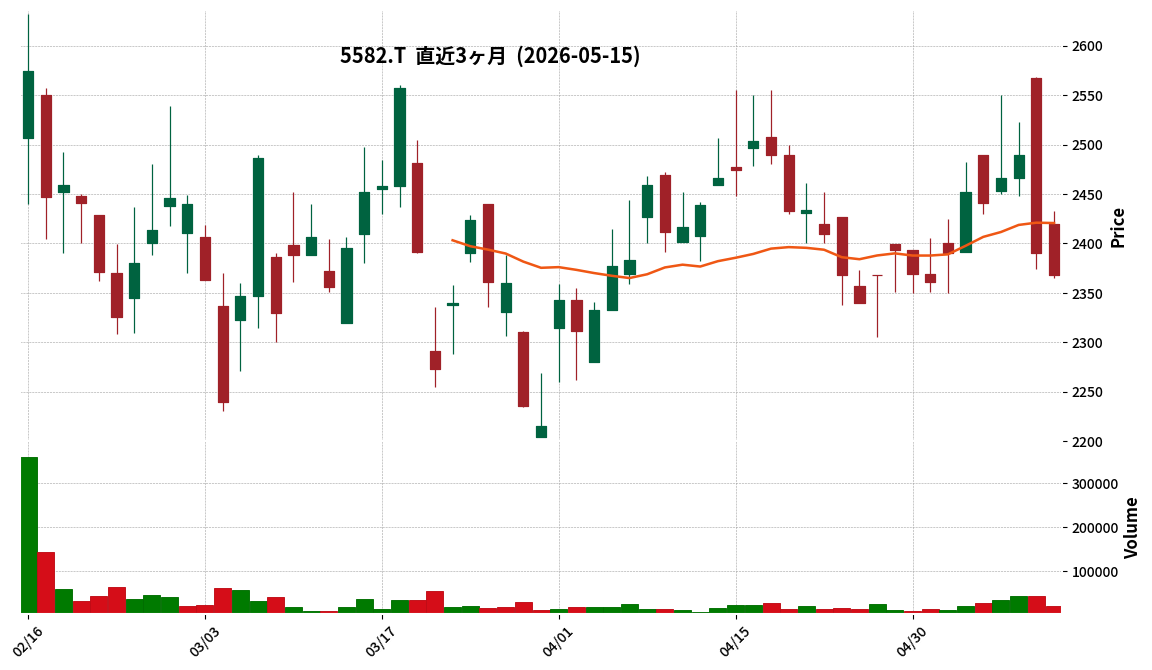
5582|G-グリッド
2368.0
▼ -0.92%
This article is an AI-generated summary and analysis of official IR disclosures.
📄 Announcement (AI-Reviewed)
- GRID Inc. reported ¥1,951 million in revenue for the third quarter of the fiscal year ending June 2026, marking a 28.7% increase year-over-year. Operating profit reached ¥310 million, a 3.5% increase year-over-year.
- Segment-wise, revenue from the Power domain was ¥1,041 million (+14.5% YoY), Urban & Transportation was ¥351 million (+164.1% YoY), and Energy Management was ¥160 million (none in the prior period). Manufacturing & Logistics revenue was ¥340 million (-26.1% YoY).
- As of the end of Q3, the company had 133 employees (86 AI engineers, 3 energy storage engineers, 44 sales/admin staff), achieving its initial hiring plan.
- Third-quarter revenue exceeded the initial plan by 0.3%, and operating profit surpassed the initial plan by 57.5%.
- The company anticipates achieving its full-year performance targets due to steady progress in the AI business and projected revenue contributions from energy storage development starting in Q4.
🤖 AI Perspective
GRID Inc.’s Q3 FY2026 results indicate robust growth in both revenue and operating profit, primarily driven by strong performance in the power and urban & transportation sectors. The ability to increase operating profit despite rising personnel and office relocation costs may suggest effective revenue growth strategies. The commencement of energy storage development in Q4 is projected to be a key factor in achieving full-year targets, making its future contribution worth monitoring.
Disclaimer: This article is for informational purposes only and does not constitute investment advice.
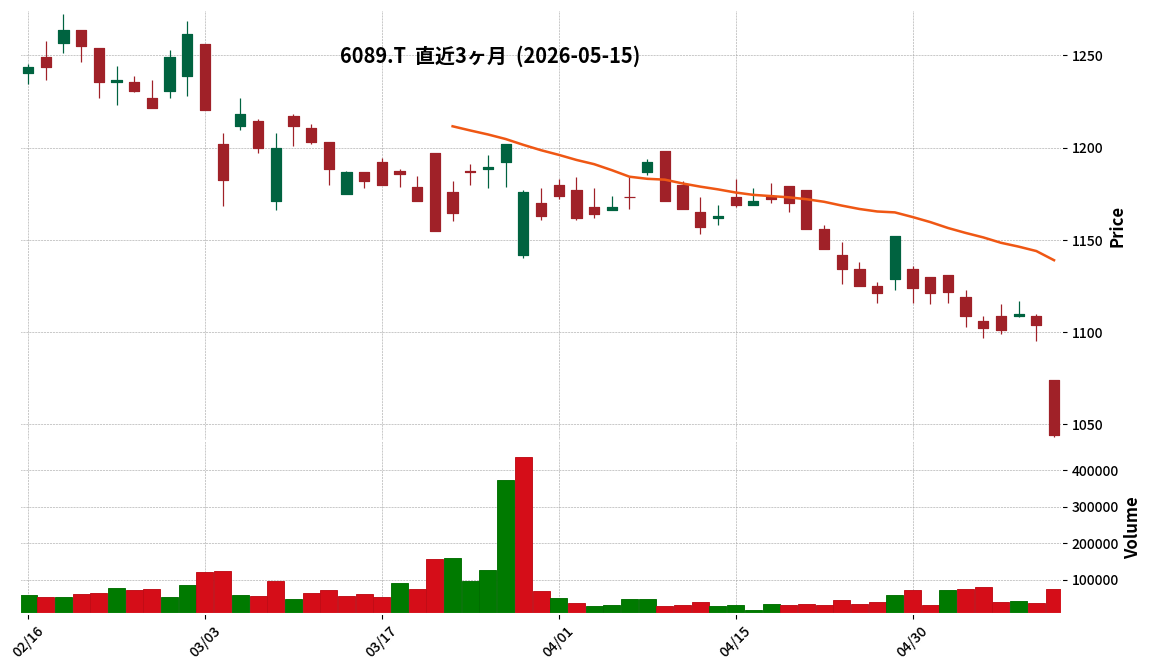
6089|ウィルグループ
1044.0
▼ -5.43%
📎 Source:ウィルグループ Official IR →
This article is an AI-generated summary and analysis of official IR disclosures.
📄 Announcement (AI-Reviewed)
- WILL GROUP reported consolidated results for the fiscal year ended March 2026, with revenue of ¥146.85 billion (+5.1% year-on-year) and operating profit of ¥3.27 billion (+40.2% year-on-year).
- Consolidated revenue achieved a new record high since the fiscal year ended March 2023, and operating profit saw a significant increase.
- Normalized operating profit was ¥3.00 billion (+32.8% year-on-year), and EBITDA was ¥5.63 billion (+15.0% year-on-year).
- The Domestic Working business recorded revenue of ¥88.26 billion (+6.2% year-on-year) and segment profit of ¥3.57 billion (+10.1% year-on-year).
- The Overseas Working business reported revenue of ¥58.50 billion (+3.6% year-on-year) and segment profit of ¥2.42 billion (+69.4% year-on-year). Normalized segment profit increased by 50.8% year-on-year.
- The new medium-term management plan, “WILL-being 2029,” was announced.
🤖 AI Perspective
WILL GROUP’s FY2026/3 results, particularly the record-high revenue and significant increase in operating profit, may suggest strong operational performance. Factors such as the expansion in the construction engineer sector within the Domestic Working business and cost controls in the Overseas Working business appear to have contributed to this growth. The launch of the new medium-term management plan, “WILL-being 2029,” could indicate a clear strategic direction for future growth, which will be worth monitoring.
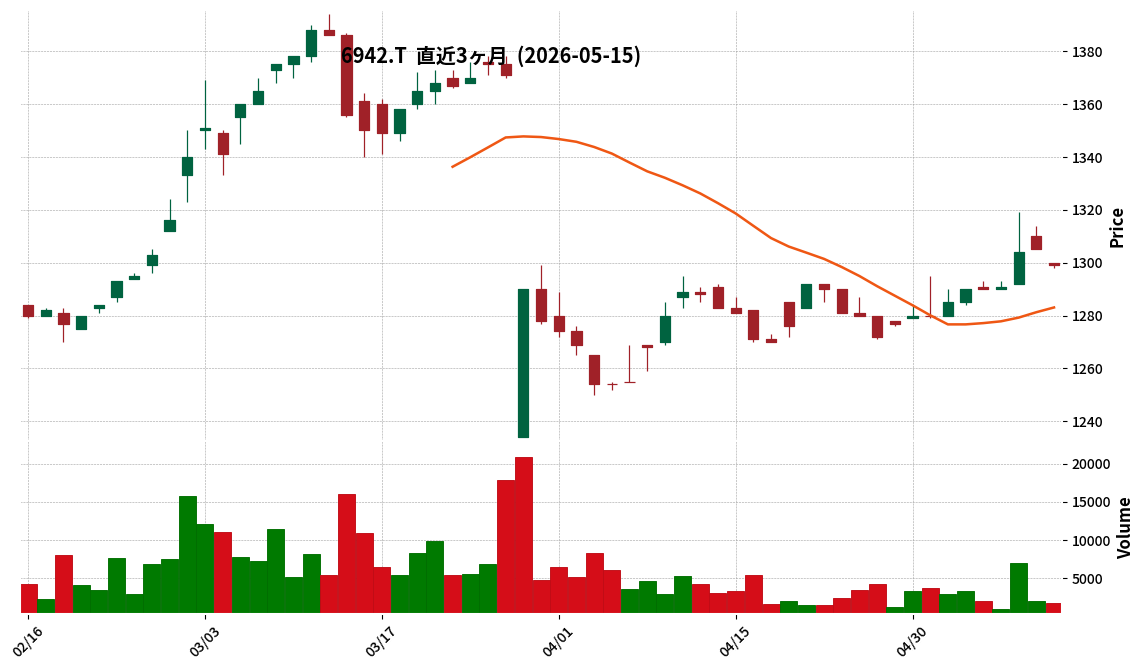
6942|ソフィアHD
1299.0
▼ -0.46%
This article is an AI-generated summary and analysis of official IR disclosures.
📄 Announcement (AI-Reviewed)
- Consolidated revenue for the fiscal year ended March 31, 2026, was ¥8,329 million, a decrease of 0.4% compared to the previous fiscal year.
- The company reported a consolidated operating loss of ¥60 million for the period, a decline from the operating profit of ¥344 million in the prior fiscal year.
- Profit attributable to owners of the parent company resulted in a loss of ¥34 million.
- The equity attributable to owners of the parent ratio was 41.5% as of March 31, 2026, an increase from 40.6% at the end of the previous fiscal year.
- For the fiscal year ending March 31, 2027, the company forecasts consolidated revenue of ¥8,928 million (a 7.2% increase year-on-year) and an operating profit of ¥159 million, marking a return to profitability.
🤖 AI Perspective
Sophia Holdings’ FY2026 results indicate a slight revenue decline and a shift to an operating loss, which may be attributed to factors such as the sale of a subsidiary in the internet-related business and intensified competition in the MVNO sector. However, the company projects a return to revenue growth and operating profitability for FY2027, suggesting potential recovery driven by its telecommunications and pharmacy businesses. Investors may want to monitor the progress of these segments in the upcoming fiscal year.
7371|G-Zenken
676.0
▼ -2.31%
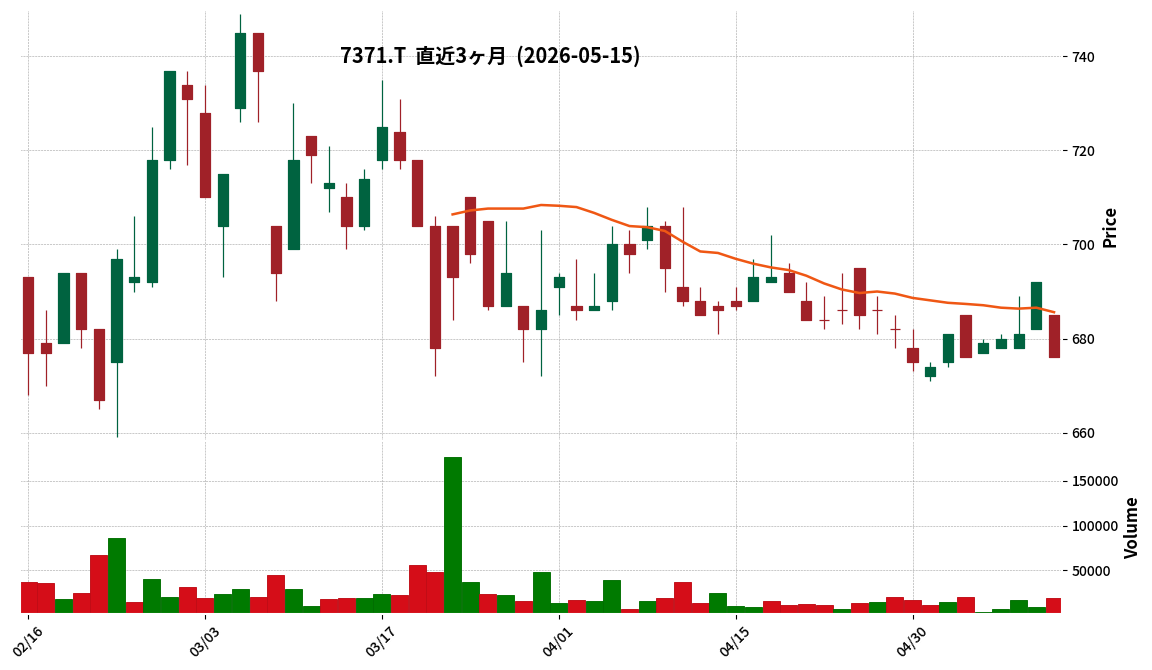
📎 Source:G-Zenken Official IR →
This article is an AI-generated summary and analysis of official IR disclosures.
📄 Announcement (AI-Reviewed)
- G-Zenken announced its consolidated financial results for the third quarter of the fiscal year ending June 2026 (July 1, 2025, to March 31, 2026).
- Cumulative consolidated net sales for the period were ¥4,298 million, representing a 1.9% increase compared to the same period of the previous fiscal year.
- Operating income reached ¥498 million (up 54.9% year-on-year), ordinary income was ¥540 million (up 60.8% year-on-year), and net income attributable to owners of the parent was ¥372 million (up 26.4% year-on-year).
- Basic earnings per share for the quarter were ¥30.63.
- There were no revisions to the full-year consolidated earnings forecast or the annual dividend forecast for the fiscal year ending June 2026 from the most recently published figures.
🤖 AI Perspective
G-Zenken’s Q3 FY2026 results show solid revenue growth and significant improvement in profitability. This performance could indicate effective operational management and cost control initiatives. The reaffirmation of the full-year earnings forecast suggests management’s confidence in achieving its previously announced targets, which may be a point of focus for investors.
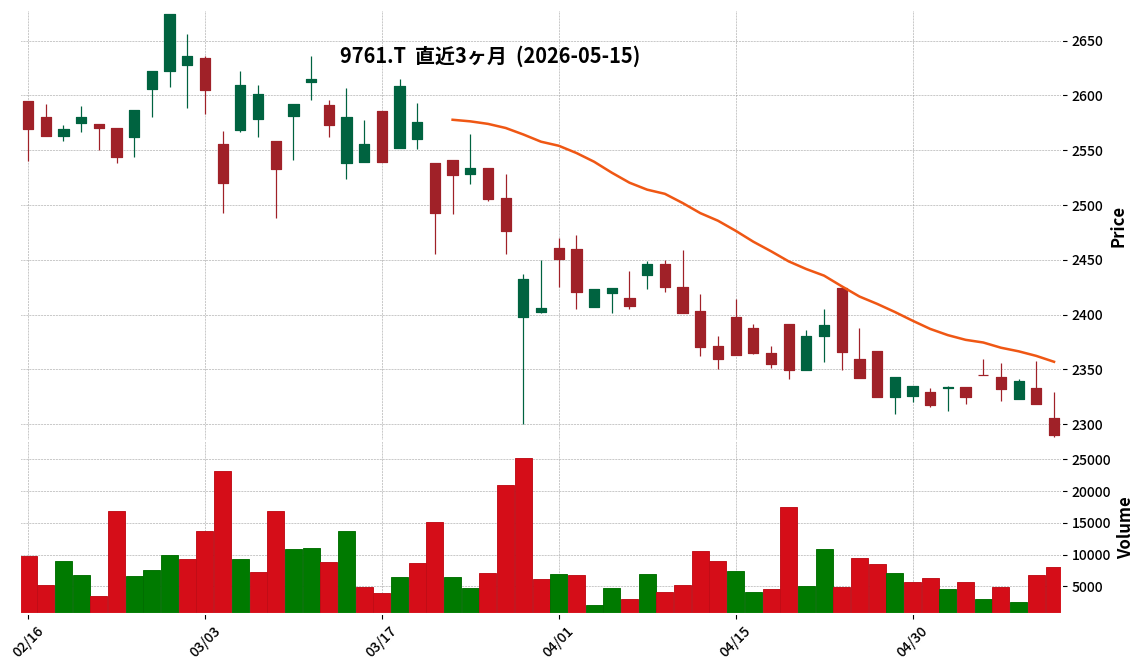
9761|東海リース
2290.0
▼ -1.21%
This article is an AI-generated summary and analysis of official IR disclosures.
📄 Announcement (AI-Reviewed)
- Tokai Lease Co., Ltd. made a partial correction to its “Consolidated Financial Results for the Fiscal Year Ended March 31, 2026 [Japanese GAAP]” disclosed on May 14, 2026.
- The correction pertains to “Attachment Page 3 (4) Future Outlook, Consolidated Business Forecast Period.”
- The original consolidated business forecast period was stated as “April 1, 2024 – March 31, 2025.”
- The corrected consolidated business forecast period is now “April 1, 2026 – March 31, 2027.”
- This correction addresses an error in the content of the financial results brief.
🤖 AI Perspective
The revision of the consolidated business forecast period to a future fiscal year is a key detail for investors to understand which accounting period the company’s future performance outlook pertains to. Such corrections are typically made to ensure the accuracy of disclosed information. It is advisable to review the entire financial results brief to confirm that this correction does not impact other parts of the disclosed information.
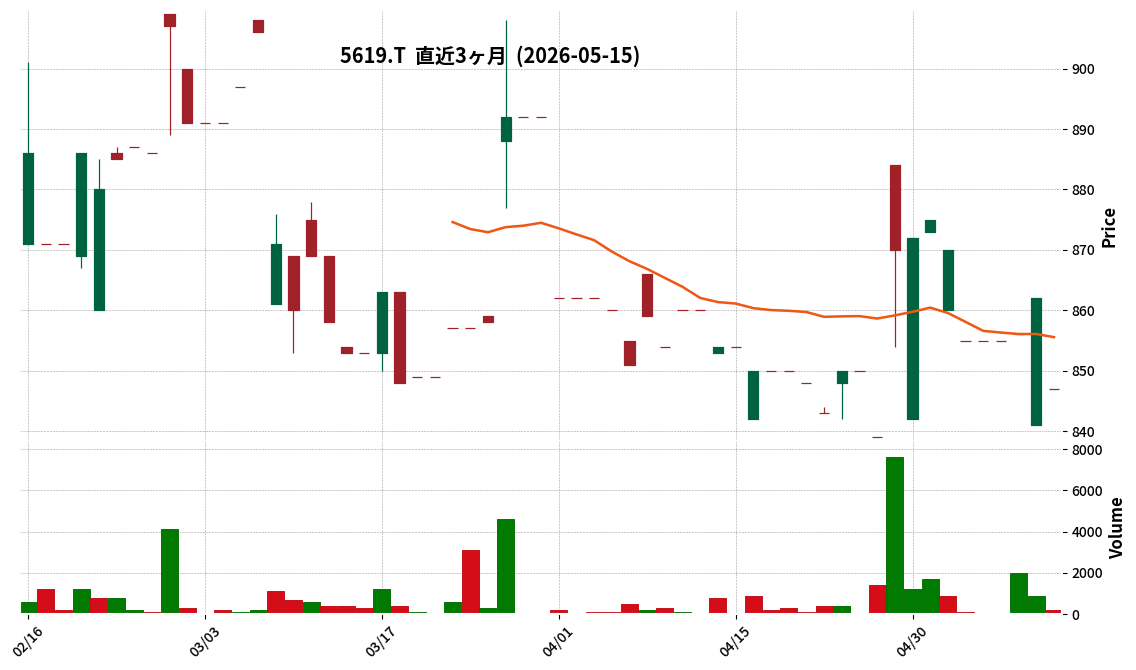
5619|G-マーソ
847.0
▼ -1.74%
This article is an AI-generated summary and analysis of official IR disclosures.
📄 Announcement (AI-Reviewed)
- G-マーソ’s consolidated net sales for Q1 FY2026 (January 1, 2026 to March 31, 2026) increased by 3.6% year-over-year to ¥291 million.
- During the same period, the consolidated operating loss was △¥10 million (compared to △¥12 million in the prior-year quarter), consolidated ordinary loss was △¥8 million (compared to △¥12 million), and net loss attributable to owners of the parent was △¥5 million (compared to △¥10 million).
- Loss per share for the quarter was △¥1.45 (compared to △¥2.95 in the prior-year quarter).
- As of the end of the first consolidated fiscal quarter, total assets stood at ¥2,157 million, net assets at ¥1,944 million, and the equity ratio was 90.1%.
- The full-year consolidated earnings forecast for FY2026 (net sales ¥1,262 million, operating loss △¥76 million, ordinary loss △¥75 million, and net loss attributable to owners of the parent △¥76 million) remains unchanged.
🤖 AI Perspective
G-Marso’s Q1 results indicate a year-over-year revenue increase and a narrowing of losses across all reporting levels, which may suggest improving operational performance. This performance is likely driven by sustained growth in both “reservation sales” and “advertising sales” within its HealthTech business. The reaffirmation of the full-year forecast could indicate that the company perceives its progress to be generally on track with initial plans.
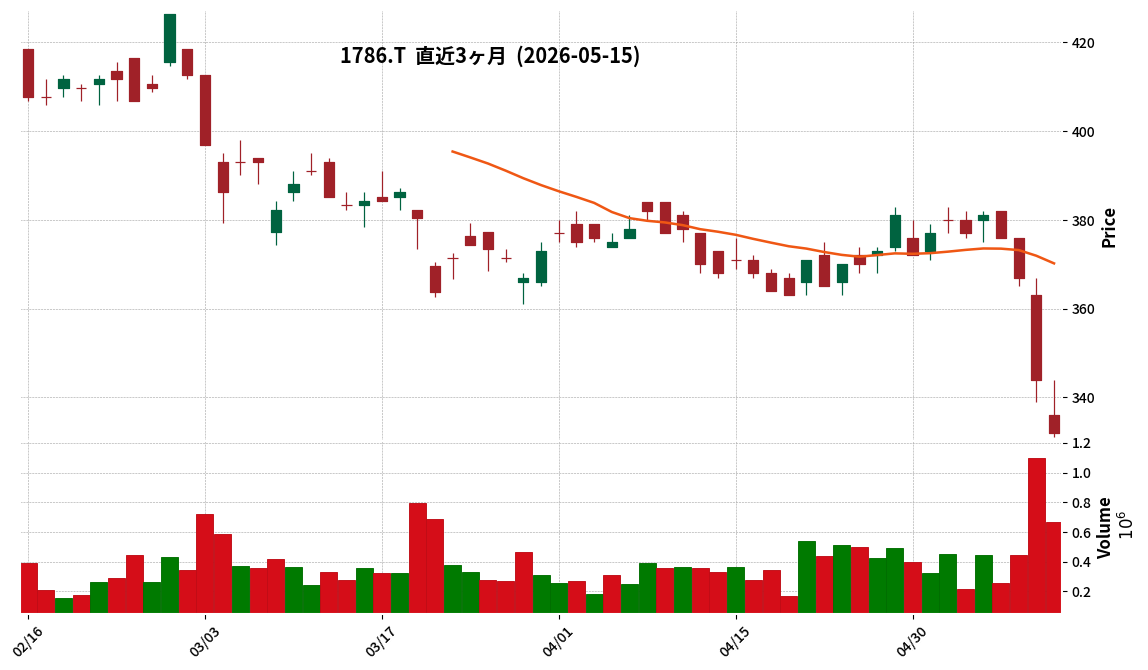
1786|オリエンタル白石
332.0
▼ -3.49%
📎 Source:オリエンタル白石 Official IR →
This article is an AI-generated summary and analysis of official IR disclosures.
📄 Announcement (AI-Reviewed)
- Oriental Shiraishi announced a partial correction to its “Consolidated Financial Results for the Fiscal Year Ended March 2026 [Japanese Standards]” published on May 14, 2026.
- The correction pertains to the consolidated financial forecast for the fiscal year ending March 2027.
- The original consolidated financial forecast for the fiscal year ending March 2027 was sales of ¥75 billion, operating income of ¥4.3 billion, ordinary income of ¥4.9 billion, and profit attributable to owners of parent of ¥3.0 billion.
- The revised consolidated financial forecast for the fiscal year ending March 2027 is sales of ¥75 billion, operating income of ¥4.0 billion, ordinary income of ¥4.5 billion, and profit attributable to owners of parent of ¥2.75 billion.
- While the sales forecast remains unchanged, operating income has decreased by ¥0.3 billion, ordinary income by ¥0.4 billion, and profit attributable to owners of parent by ¥0.25 billion.
🤖 AI Perspective
This correction to the recently announced consolidated earnings forecast for the fiscal year ending March 2027, specifically regarding profit figures, warrants attention from investors to understand its implications compared to the initial projections. The downward adjustment of profit metrics while the sales forecast remains constant may suggest a revised outlook on profitability. This information is crucial for investors to assess the company’s perspective on its future performance, based on the officially released facts.
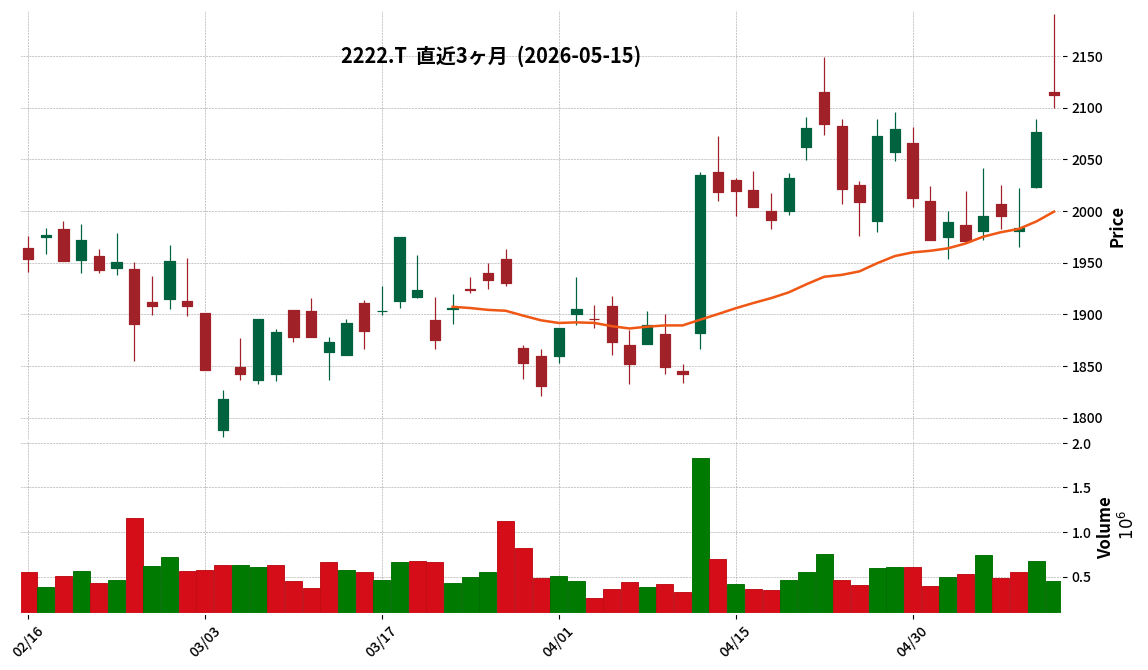
2222|寿スピリッツ
2112.0
▲ +1.71%
This article is an AI-generated summary and analysis of official IR disclosures.
📄 Announcement (AI-Reviewed)
- Kotobuki Spirits reported record-high full-year financial results for the fiscal year ended March 2026, with net sales of ¥78,781 million, operating income of ¥18,598 million, ordinary income of ¥18,733 million, and net income of ¥12,557 million. All figures represent the fourth consecutive year of record highs.
- Inbound sales (international terminal sales) increased by 6.8% year-on-year to ¥10,701 million, despite impacts from Japan-China relations.
- The company opened 11 new stores, including new brands such as “SALTRA” at Hanshin Umeda Main Store in November 2025, “VANISTA” at Seibu Ikebukuro Main Store in November 2025, and “HELLO MAPLI” at JR Nagoya Takashimaya in February 2026. Concurrently, 9 stores were closed, including 3 stores in Tokyo Station due to renovation.
- Kotobuki Spirits is strengthening its Okinawa operations, with sales to Okinawa reaching ¥1,977 million. A new factory in Miyakojima, Okinawa, with an investment of ¥2.9 billion and a production capacity of ¥5.0 billion in sales, is under preparation for operation in June 2027.
- The actual full-year results for FY2026 achieved 98.9% of the initial forecast for net sales and 95.0% for ordinary income.
🤖 AI Perspective
The announced financial results, featuring record-high sales and profits for the fourth consecutive year, may suggest a sustained growth trajectory for the company. The continued increase in inbound sales despite external factors, coupled with aggressive new brand rollouts and strategic investments like the Okinawa factory, could indicate robust future business development. However, it is worth monitoring that the company did not fully meet its initial forecasts for both net sales and ordinary income, suggesting that execution against plans could be a point of focus for investors.
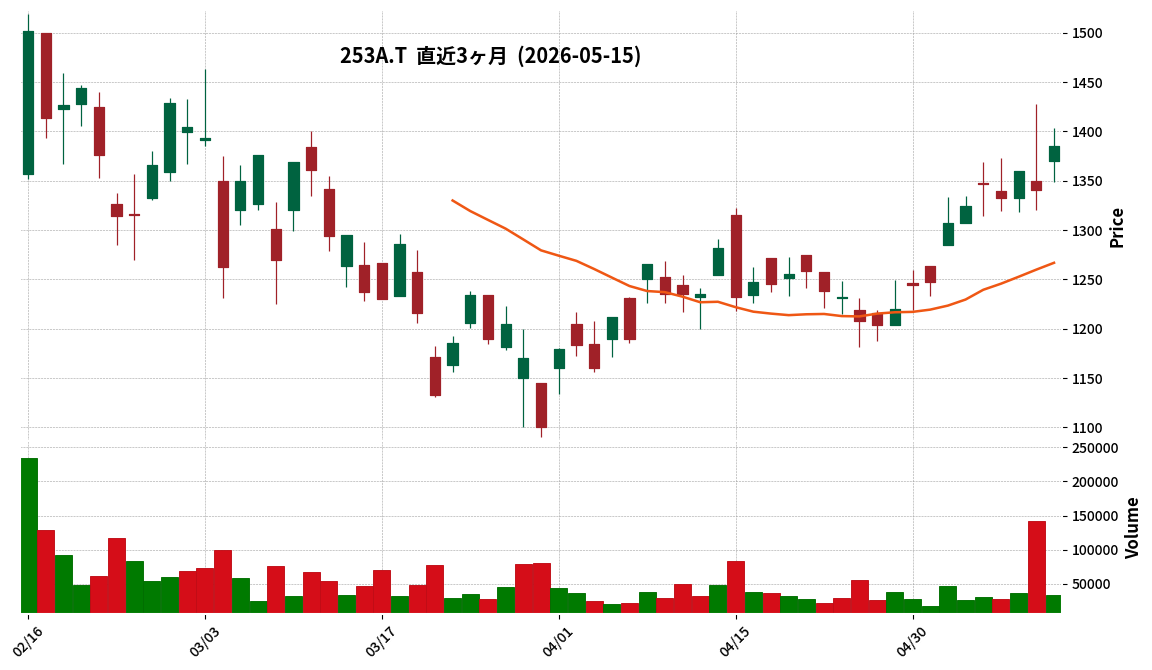
253A|ETSグループ
1385.0
▲ +3.28%
📎 Source:ETSグループ Official IR →
This article is an AI-generated summary and analysis of official IR disclosures.
📄 Announcement (AI-Reviewed)
- ETS Group announced its consolidated financial results for the second quarter (interim period) of the fiscal year ending September 2026.
- Consolidated net sales for the cumulative period reached 5,687 million yen, marking a 12.2% increase compared to the previous interim period.
- Operating profit grew to 722 million yen (up 88.8%), ordinary profit to 709 million yen (up 90.6%), and profit attributable to owners of parent to 433 million yen (up 89.9%).
- By segment, the Electrical Engineering business reported sales of 4,845 million yen (up 13.7%) and segment profit of 637 million yen (up 123.7%). The Real Estate-related business recorded sales of 835 million yen (up 4.1%) and segment profit of 76 million yen (up 1.2%).
- The full-year consolidated performance forecast remains unchanged from the most recently announced figures, projecting net sales of 11,850 million yen and operating profit of 777 million yen.
🤖 AI Perspective
This earnings report indicates a significant increase in both revenue and profit for ETS Group compared to the previous interim period. The substantial growth in profit, particularly within the Electrical Engineering segment, may suggest positive developments in project profitability in the power business. With the full-year forecast remaining unrevised, the company’s future performance and project execution will be worth monitoring.
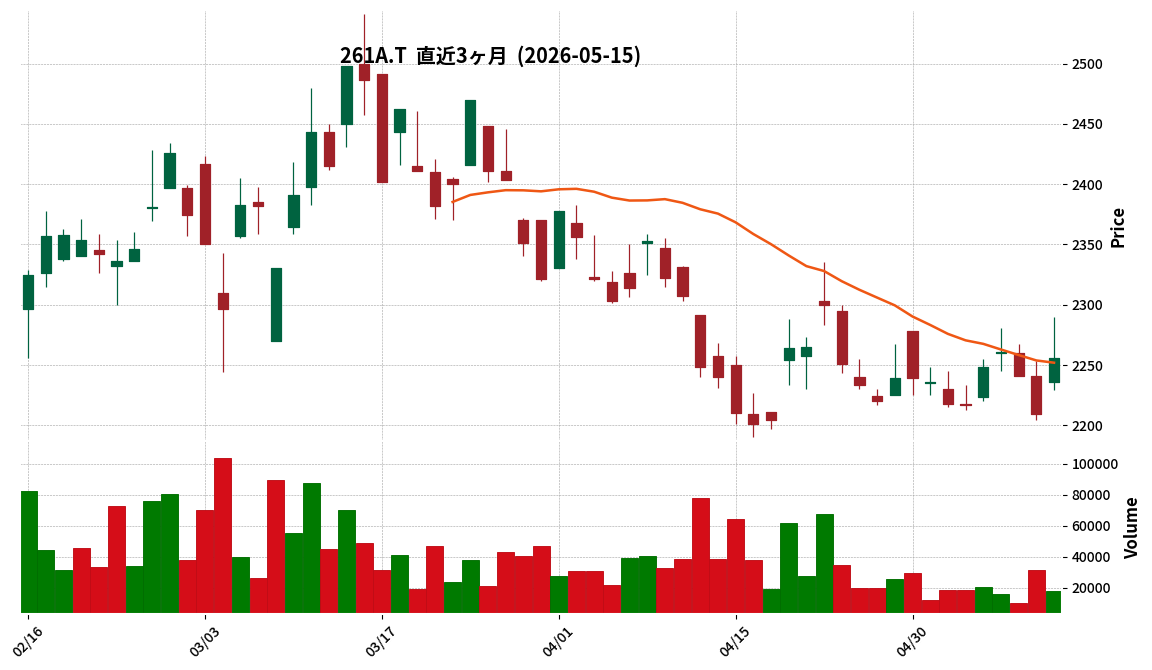
261A|日水コン
2256.0
▲ +2.13%
This article is an AI-generated summary and analysis of official IR disclosures.
📄 Announcement (AI-Reviewed)
- Nippon Suiko Consultants reported Q1 FY2026 results with orders received at ¥2.813 billion (down 55.5% year-on-year) and net sales at ¥7.409 billion (up 4.0% year-on-year).
- Operating profit was ¥1.234 billion (down 8.7% year-on-year), and net income attributable to owners of the parent was ¥843 million (down 8.5% year-on-year).
- The decline in orders received is attributed to the booking of a large 10-year contract (¥3.120 billion) in Q1 FY2025; excluding this, orders received were down 12.0% year-on-year.
- The decrease in operating profit is explained by an increase in the provision for business compensation (¥129 million increase), and excluding this special factor, the underlying operating profit was ¥1.364 billion, comparable to the previous year.
- The company announced the signing of a capital and business alliance agreement with Liberaware Inc. on May 15, 2026, involving an investment of approximately ¥500 million.
🤖 AI Perspective
While Q1 sales increased, operating profit declined. This was primarily due to an increase in the provision for business compensation, calculated based on the average of the past three years, rather than new defects in current business activities. The decrease in orders received was a reactionary effect from a large contract in the previous year, but sufficient order backlog remains, suggesting a progress towards full-year order and sales targets when accounting for seasonal variations. The capital and business alliance with Liberaware Inc. may indicate a strategic investment towards strengthening DX solutions in the water infrastructure sector.
279A|P-インターグ
1550.0
▲ +0.00%
📎 Source:P-インターグ Official IR →
This article is an AI-generated summary and analysis of official IR disclosures.
📄 Announcement (AI-Reviewed)
- P-Interg announced its non-consolidated financial results for the fiscal year ended March 2026.
- Net sales reached 8,706 million yen, marking a 47.5% increase compared to the previous fiscal year.
- Operating profit was 222 million yen (+22.4% YoY), ordinary profit was 249 million yen (+29.4% YoY), and net profit was 165 million yen (+23.5% YoY).
- Diluted earnings per share were 82.60 yen (adjusted for a 1-for-10,000 stock split on June 28, 2024).
- For the fiscal year ending March 2027, the company forecasts consolidated net sales of 9,894 million yen, operating profit of 85 million yen, ordinary profit of 118 million yen, and net profit attributable to parent company shareholders of 76 million yen, as it transitions to consolidated financial statements.
🤖 AI Perspective
P-Interg’s strong performance in FY2026, with significant growth across all key profit metrics, suggests robust demand within its media business. The planned transition to consolidated financial statements from FY2027 could indicate an expansion of its business scope and potentially a more comprehensive view of its overall financial health for investors. The notable increase in cash outflow from investing activities may suggest a strategic focus on future growth initiatives, which is worth monitoring in subsequent reports.
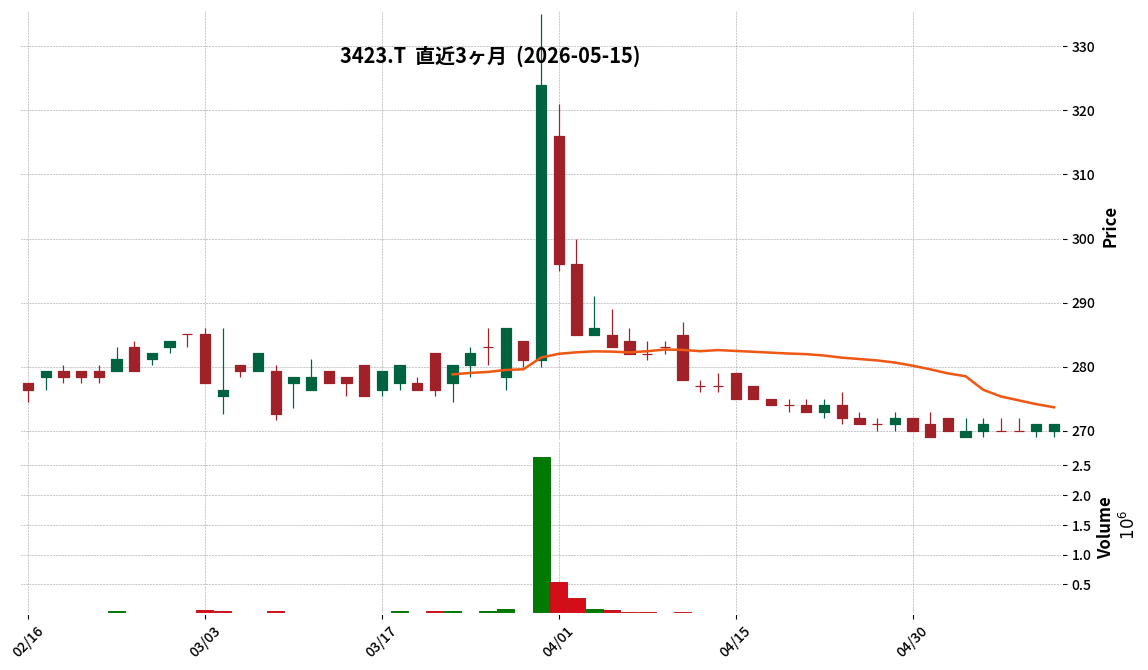
3423|エスイー
271.0
▲ +0.00%
This article is an AI-generated summary and analysis of official IR disclosures.
📄 Announcement (AI-Reviewed)
- SE Corporation announced its consolidated financial results for the fiscal year ended March 2026.
- Consolidated net sales were ¥25,401 million (down 1.9% year-on-year), operating income was ¥599 million (down 29.5% year-on-year), and ordinary income was ¥591 million (down 33.2% year-on-year).
- Net loss attributable to owners of the parent company was ¥(434) million, a significant decline from the ¥543 million net income recorded in the previous fiscal year.
- Basic earnings per share stood at ¥(14.40).
- For the fiscal year ending March 2027, the company projects consolidated net sales of ¥25,000 million (down 1.6% year-on-year), operating income of ¥603 million (up 0.7%), ordinary income of ¥600 million (up 1.4%), and net income attributable to owners of the parent company of ¥159 million (no percentage change due to prior year loss), with basic EPS of ¥5.29.
- The annual dividend per share for FY2026/3 was ¥13.00 (year-end), and the forecast for FY2027/3 is ¥12.00 (year-end).
🤖 AI Perspective
The FY2026/3 consolidated results show a slight decline in sales, coupled with significant decreases in operating and ordinary income, culminating in a net loss attributable to parent company shareholders. This shift to a loss position, particularly from the previous year’s profit, warrants attention from investors. While the company forecasts a return to profitability for the upcoming fiscal year, the impact of the stated reasons for the current year’s individual performance, such as increased selling, general and administrative expenses due to R&D reinforcement and deferred tax asset derecognition, on future performance remains a factor to monitor.
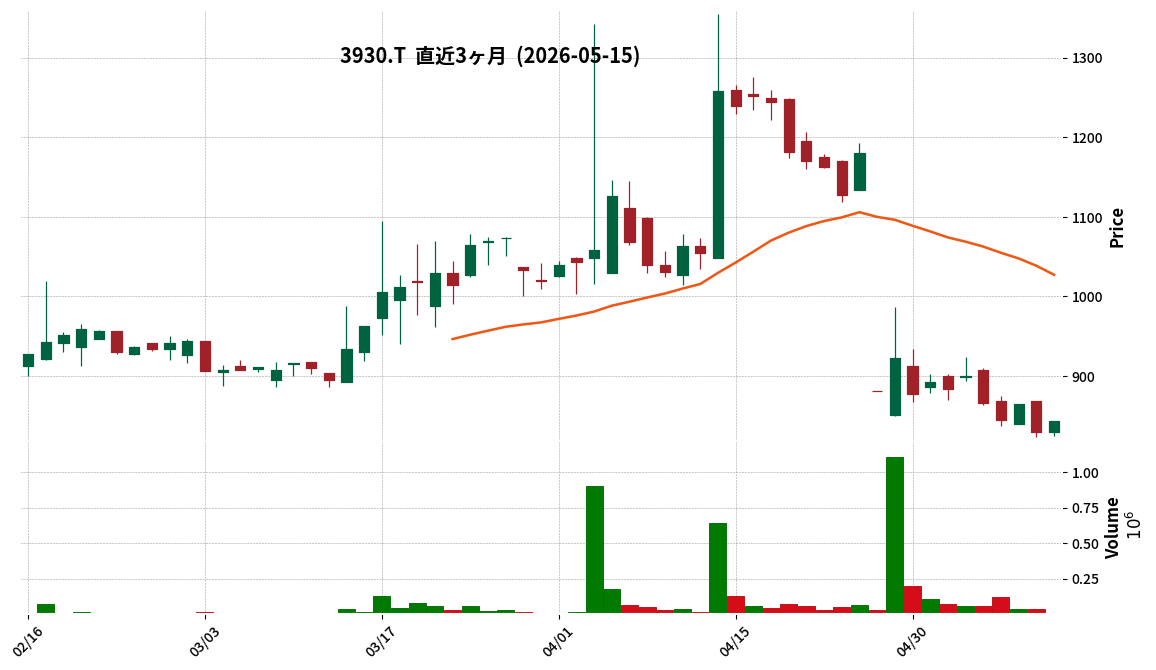
3930|G-はてな
843.0
▲ +1.57%
This article is an AI-generated summary and analysis of official IR disclosures.
📄 Announcement (AI-Reviewed)
- Hatena Co., Ltd. announced on May 15, 2026, the “Notice Regarding Commemorative Shareholder Benefit.”
- This announcement confirms that the “10th Anniversary Shareholder Special Benefit,” initially announced on April 14, 2026, will proceed as originally planned, despite the “Notice Regarding the Occurrence of a Fund Outflow Incident” published on April 24, 2026.
- The benefit targets shareholders holding 3 units (300 shares) or more of the company’s stock as recorded in the shareholder register as of July 31, 2026. They will receive a Digital Gift® worth ¥25,000 provided by Digital Plus Co., Ltd.
- For this specific benefit, all shareholders holding 3 units or more are eligible, regardless of their continuous holding period.
- The gifts are scheduled to be sent in October 2026, enclosed with the notice of the General Meeting of Shareholders.
- The company is currently reviewing the impact of this matter, including its effect on the company’s financial results for the fiscal year ending July 2026, and will promptly disclose any material developments.
🤖 AI Perspective
- This announcement may be seen by investors as a reaffirmation of the company’s commitment to shareholder returns, even after the recent fund outflow incident.
- The clarity regarding the eligibility (no continuous holding period requirement) and the specific value of the digital gift could be a point of interest for current and potential shareholders.
- Investors might continue to monitor for further updates on the financial impact of both the fund outflow incident and this shareholder benefit on the company’s performance.
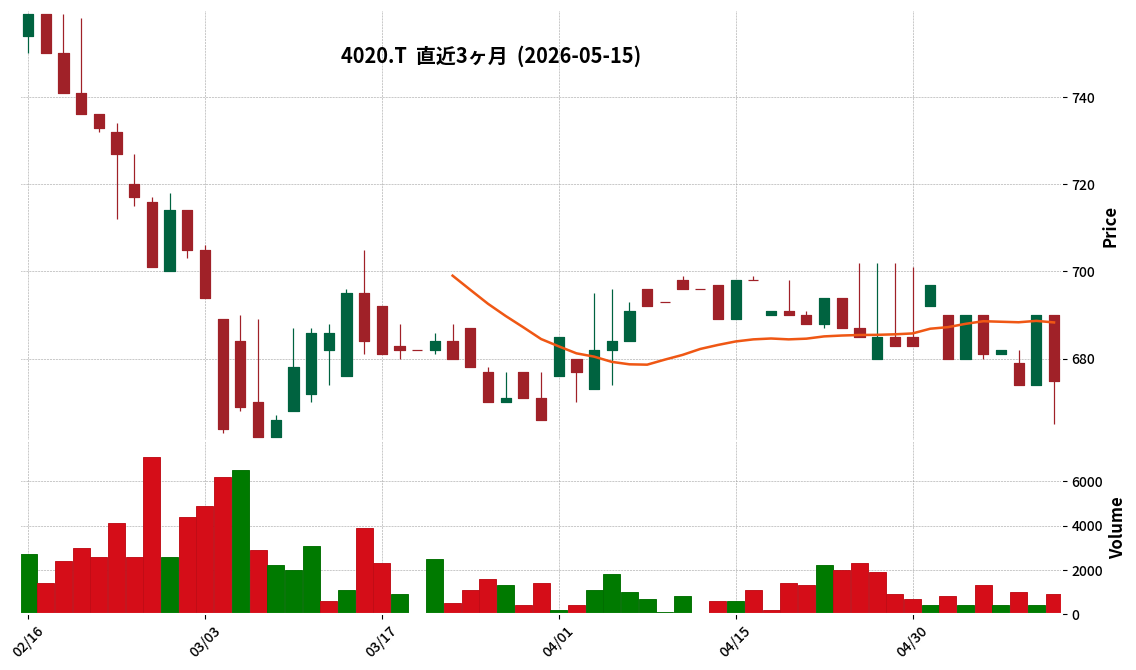
4020|G-ビートレンド
675.0
▼ -2.17%
📎 Source:G-ビートレンド Official IR →
This article is an AI-generated summary and analysis of official IR disclosures.
📄 Announcement (AI-Reviewed)
- Betrend Corporation announced its unaudited financial results for the first quarter of the fiscal year ending December 2026 (January 1, 2026 – March 31, 2026).
- Consolidated net sales for the quarter totaled ¥264 million, representing a 7.1% decrease compared to the same period last year.
- The company reported an operating loss of ¥62 million (compared to an operating income of ¥4 million in the prior year), an ordinary loss of ¥62 million (compared to an ordinary income of ¥5 million), and a net loss of ¥62 million (compared to a net income of ¥2 million).
- Total CRM service ARR was ¥955,208 thousand (down 1.5% year-on-year). Smart CRM service contracts increased by 4 companies to 185, while email marketing service contracts decreased by 53 companies to 353.
- The full-year earnings forecast and dividend forecast for the fiscal year ending December 2026 remain unchanged from the most recently announced figures.
🤖 AI Perspective
Betrend’s Q1 FY2026 results show a decline in revenue and reported losses, which appears to be attributed to strategic investments in infrastructure and increased personnel costs as part of its ongoing mid-term management plan. While the smart CRM service saw an increase in client contracts, a notable decrease in email marketing service contracts could suggest a shift in business focus or market dynamics. Investors may find it worthwhile to monitor the company’s progress in its investment phase and the evolution of its service offerings.
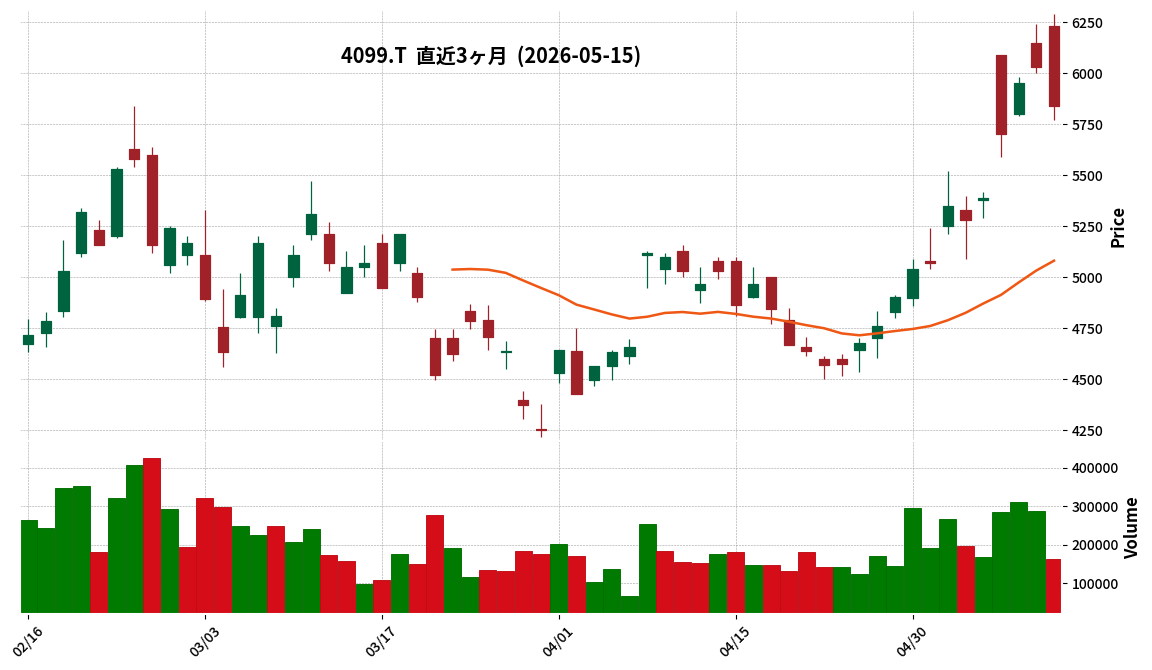
4099|四国化成HD
5840.0
▼ -3.15%
This article is an AI-generated summary and analysis of official IR disclosures.
📄 Announcement (AI-Reviewed)
- For the first quarter of the fiscal year ending December 2026 (January 1, 2026 – March 31, 2026), consolidated results were: net sales of JPY 19,868 million (up 18.2% year-on-year), operating income of JPY 4,240 million (up 39.6%), ordinary income of JPY 4,520 million (up 60.8%), and net income attributable to owners of parent of JPY 3,041 million (up 58.0%).
- Net sales, operating income, ordinary income, and net income attributable to owners of parent all reached record highs for a first quarter.
- The Chemicals business reported net sales of JPY 14,611 million (up 26.2% year-on-year) and segment income of JPY 3,756 million (up 39.0%), driven by strong performance in fine chemicals.
- The Building Materials business recorded net sales of JPY 4,997 million (up 1.7% year-on-year) and segment income of JPY 359 million (up 31.0%).
- The consolidated full-year forecast for the fiscal year ending December 2026 has been revised: net sales of JPY 88,000 million (up 24.5% from previous year), operating income of JPY 14,400 million (up 32.5%), ordinary income of JPY 14,500 million (up 21.6%), and net income attributable to owners of parent of JPY 10,000 million (up 18.2%).
🤖 AI Perspective
Shikoku Chemicals HD’s Q1 results indicate a very strong start to the fiscal year, with record-high sales and profits across key metrics. The significant contribution from the fine chemicals segment within the Chemicals business, driven by expanded sales both domestically and internationally, appears to be a primary growth driver. The upward revision of the full-year forecast could suggest management’s increased confidence in continued positive performance.
Disclaimer: This article is for informational purposes only and does not constitute investment advice.
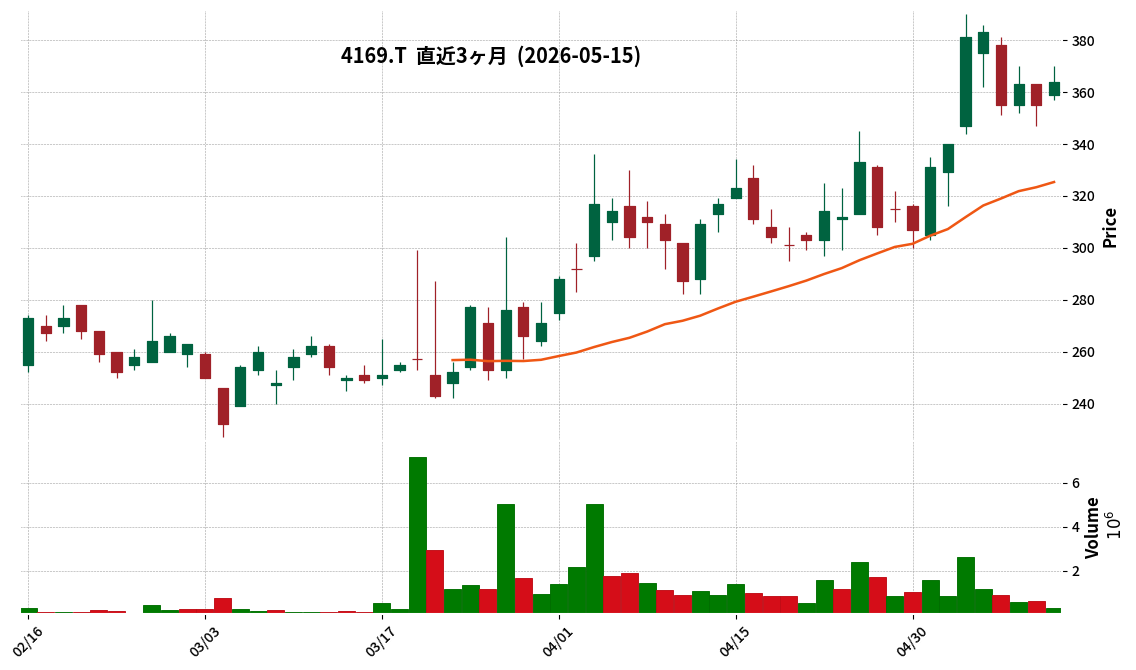
4169|G-エネチェンジ
364.0
▲ +2.54%
📎 Source:G-エネチェンジ Official IR →
This article is an AI-generated summary and analysis of official IR disclosures.
📄 Announcement (AI-Reviewed)
- G-ENECHANGE reported consolidated net sales of ¥6,697 million for the fiscal year ended March 2026.
- The consolidated operating profit for the same period was ¥592 million, with a net profit attributable to owners of parent of ¥130 million.
- This marks a return to profitability, as the previous fiscal year (ended March 2025) reported an operating loss of ¥3,630 million and a net loss attributable to owners of parent of ¥1,273 million.
- Adjusted EBITDA for the fiscal year ended March 2026 stood at ¥653 million.
- For the fiscal year ending March 2027, the company forecasts consolidated net sales of ¥6,800 million (1.5% increase year-on-year), operating profit of ¥600 million (1.2% increase), and net profit attributable to owners of parent of ¥550 million (320.1% increase).
- Dividends for both the fiscal years ended March 2025 and March 2026 were ¥0.00 per share, and the forecast for March 2027 remains undecided.
🤖 AI Perspective
G-ENECHANGE’s FY2026/3 results show a notable shift from a net loss in the previous period to profitability in operating income and net profit attributable to owners of parent, which may suggest a transition to a more profitable operational phase. The robust forecast for net profit attributable to owners of parent in FY2027/3, despite a modest increase in sales, could indicate an expectation of improved profitability and operational efficiency in the coming year.
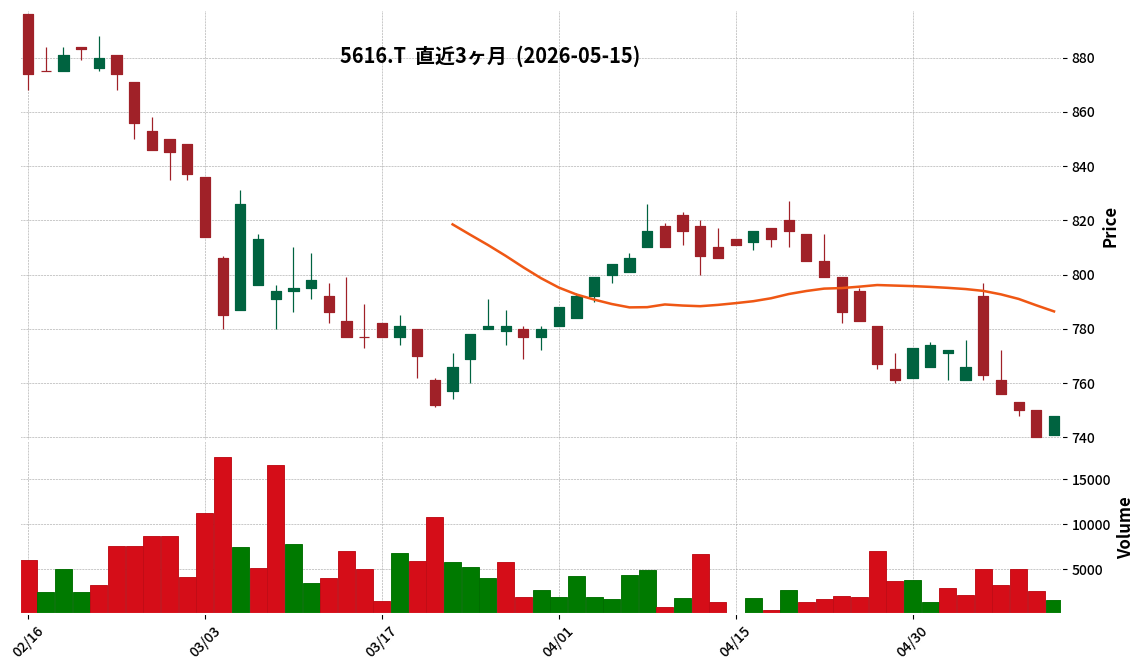
5616|G-雨風太陽
748.0
▲ +1.08%
This article is an AI-generated summary and analysis of official IR disclosures.
📄 Announcement (AI-Reviewed)
- G-Amekazetaiyo announced its financial results for the first quarter of the fiscal year ending December 2026 (January 1, 2026 – March 31, 2026).
- The non-consolidated financial performance shows sales of ¥232 million (down 1.1% year-on-year), an operating loss of ¥17 million (compared to an operating loss of ¥19 million in the prior year quarter), an ordinary loss of ¥17 million (compared to an ordinary loss of ¥17 million), and a net loss for the quarter of ¥17 million (compared to a net loss of ¥17 million).
- By segment, personal services recorded sales of ¥135 million (down 17.9% year-on-year) and an operating profit of ¥27 million (down 22.3% year-on-year). Corporate services achieved sales of ¥97 million (up 38.5% year-on-year) and an operating profit of ¥15 million (up 93.4% year-on-year).
- As of the end of the quarter, total assets stood at ¥830 million (down ¥176 million from the end of the previous fiscal year), and net assets at ¥327 million (down ¥17 million from the end of the previous fiscal year), with an equity ratio of 39.5% (compared to 34.3% at the end of the previous fiscal year).
- The full-year forecast for the fiscal year ending December 2026 remains unchanged from the forecast published on February 13, 2026.
🤖 AI Perspective
G-Amekazetaiyo’s Q1 results indicate a mixed performance, with overall revenue decline and continued losses. However, the strong growth in both revenue and profit for the corporate services segment suggests a potential area of strength for future development. Investors may consider monitoring the company’s strategies to address the declining revenue in personal services, which could be crucial for achieving the unchanged full-year targets.
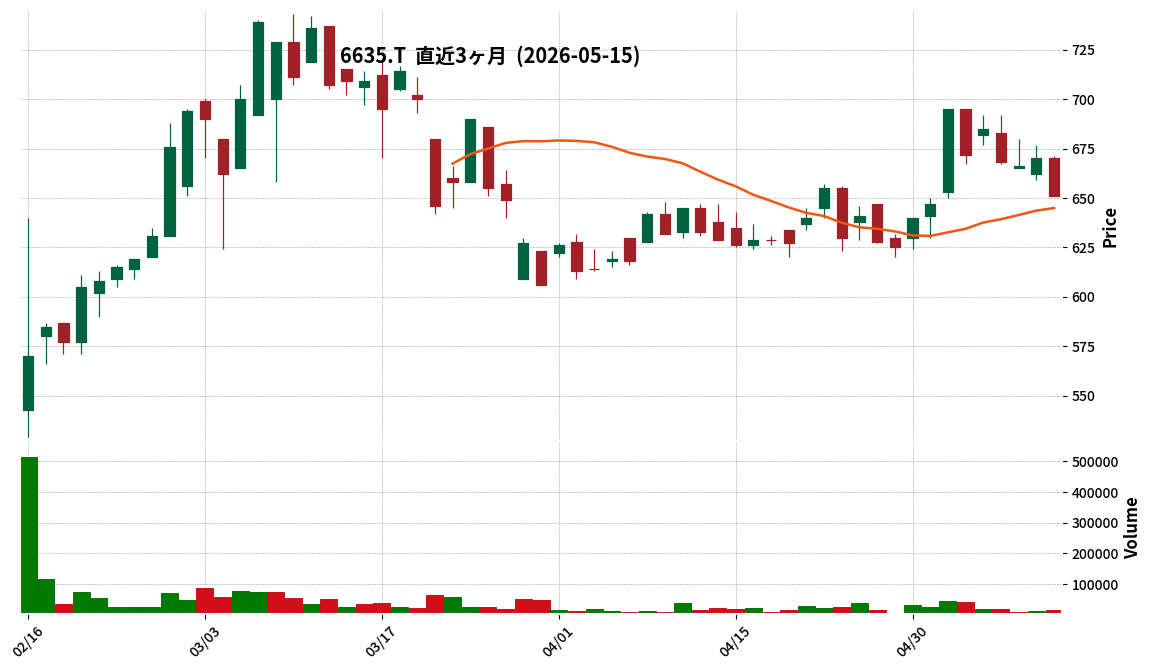
6635|大日光
651.0
▼ -2.84%
This article is an AI-generated summary and analysis of official IR disclosures.
📄 Announcement (AI-Reviewed)
- Dainippon Light (6635) announced its consolidated financial results for the first quarter of the fiscal year ending December 2026 (January 1, 2026 – March 31, 2026).
- Net sales reached ¥9,557 million, representing a 7.6% increase compared to the same quarter of the previous year.
- Operating profit was ¥58 million, a decrease of 68.7% from the prior year’s first quarter.
- Ordinary profit stood at ¥80 million, down 62.0% year-on-year.
- Net income attributable to parent company shareholders increased by 34.4% to ¥262 million.
- A significant change in the scope of consolidation includes the addition of TROIS TAKAYA ELECTRONICS (THAILAND) Co.,Ltd.
🤖 AI Perspective
While sales increased, the substantial decline in operating and ordinary profit suggests potential impacts from rising costs or changes in product mix with lower profit margins. The increase in net income attributable to parent shareholders, driven by special gains, indicates that investors may want to monitor the nature and sustainability of these gains. The contribution of the newly consolidated subsidiary to future performance is also worth monitoring.
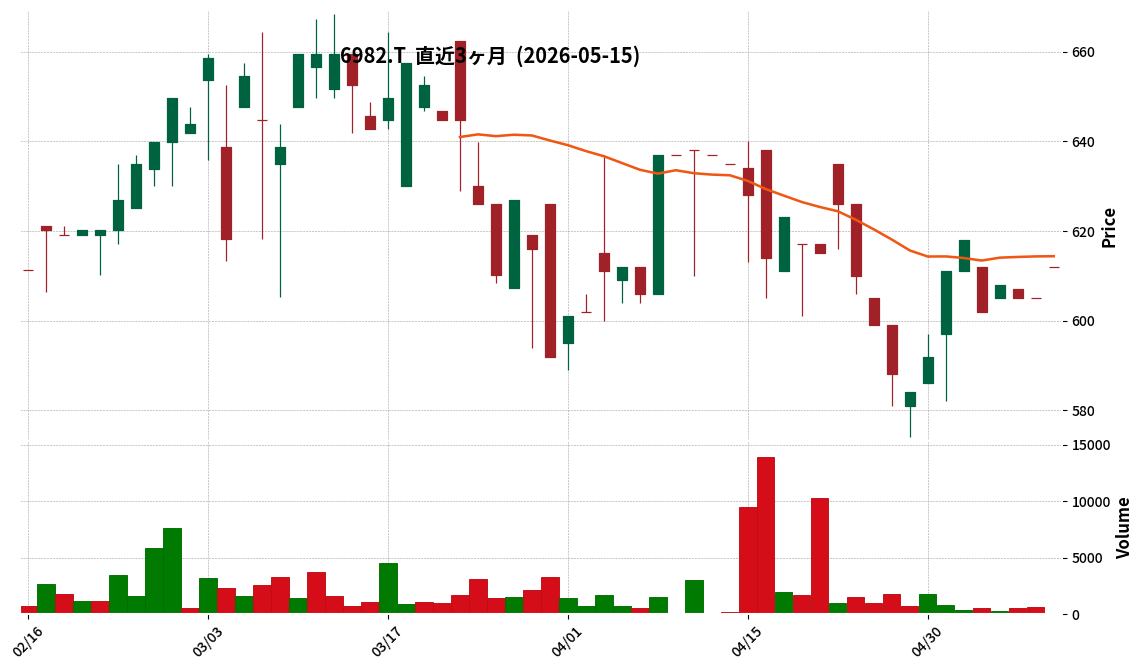
6982|リード
612.0
▲ +1.16%
This article is an AI-generated summary and analysis of official IR disclosures.
📄 Announcement (AI-Reviewed)
- Lead Co., Ltd. has released its financial results for the fiscal year ended March 31, 2026 (April 1, 2025 – March 31, 2026).
- For FY2026/3, net sales were ¥5,141 million (up 22.8% year-on-year), operating loss was ¥111 million, ordinary loss was ¥79 million, and net loss was ¥69 million.
- Sales in the Automotive Parts division were ¥4,619 million (up 19.9% year-on-year), and sales in the Company Products division were ¥494 million (up 125.9% year-on-year).
- As of March 31, 2026, total assets were ¥8,705 million, net assets were ¥2,545 million, and the equity ratio was 29.2%.
- For the fiscal year ending March 31, 2027 (April 1, 2026 – March 31, 2027), the company forecasts full-year net sales of ¥6,660 million (up 29.5% year-on-year), operating income of ¥80 million, ordinary income of ¥80 million, and net income of ¥60 million.
- The company forecasts a year-end dividend of ¥12.00 per share for FY2027/3 (compared to ¥10.00 per share for FY2026/3).
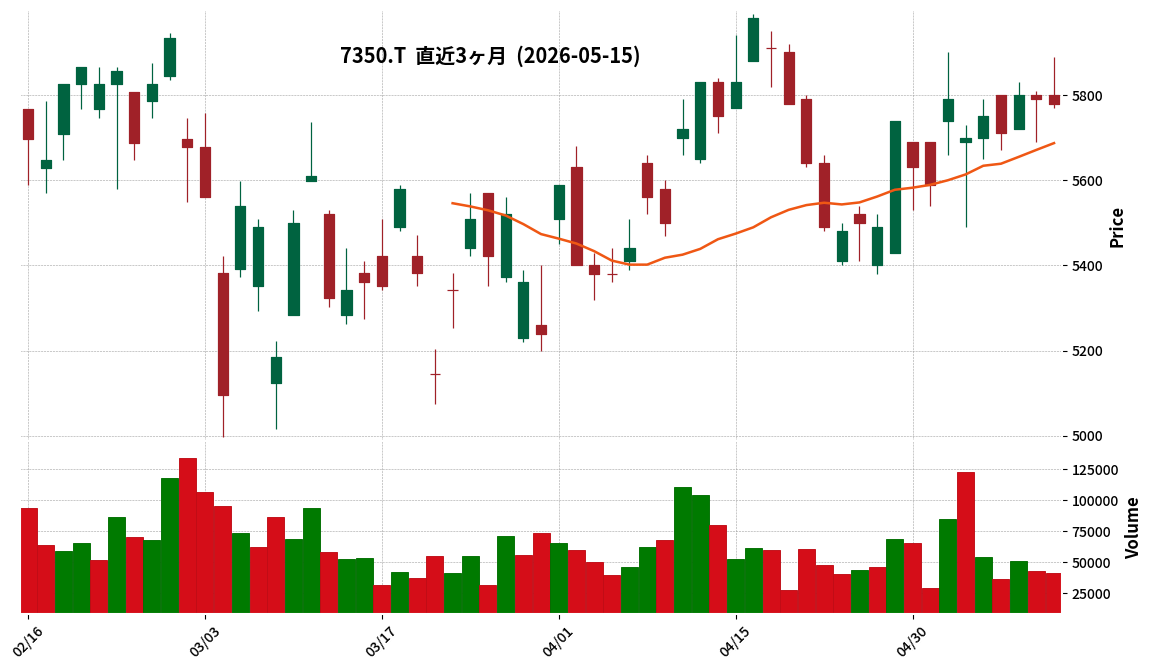
7350|おきなわFG
5780.0
▼ -0.17%
This article is an AI-generated summary and analysis of official IR disclosures.
📄 Announcement (AI-Reviewed)
- Okinawa Financial Group Inc. announced an upward revision to its final year targets (FY2027/3) for the 2nd Mid-Term Business Plan (April 2024 – March 2027).
- The consolidated ordinary revenue target has been raised from ¥71,000 million to ¥80,000 million, and the consolidated net income target from ¥11,000 million to ¥12,000 million.
- The consolidated ROE target has been revised from approximately 6.20% to approximately 6.70%, while the consolidated Common Equity Tier 1 ratio target remains unchanged at approximately 11%.
- The year-end dividend for the fiscal year ending March 31, 2026, has been increased from the most recent forecast of ¥70.00 per share to ¥100.00 per share.
- This results in an annual dividend per share of ¥170 for the fiscal year ending March 2026, with a forecasted annual dividend of ¥200 for the fiscal year ending March 2027.
- The reasons for the upward revision include solid performance, driven by increased average loan balances and service revenue at Okinawa Bank, coupled with market interest rates trending higher than at the time of the previous revision.
🤖 AI Perspective
Okinawa FG’s simultaneous announcement of revised upward business targets and a significant dividend increase is noteworthy for investors. This move suggests confidence in achieving management goals, supported by strong core business performance and a favorable market interest rate environment. The continuation of a progressive dividend policy, alongside explicit annual dividend forecasts, could further enhance investor expectations regarding future shareholder returns.
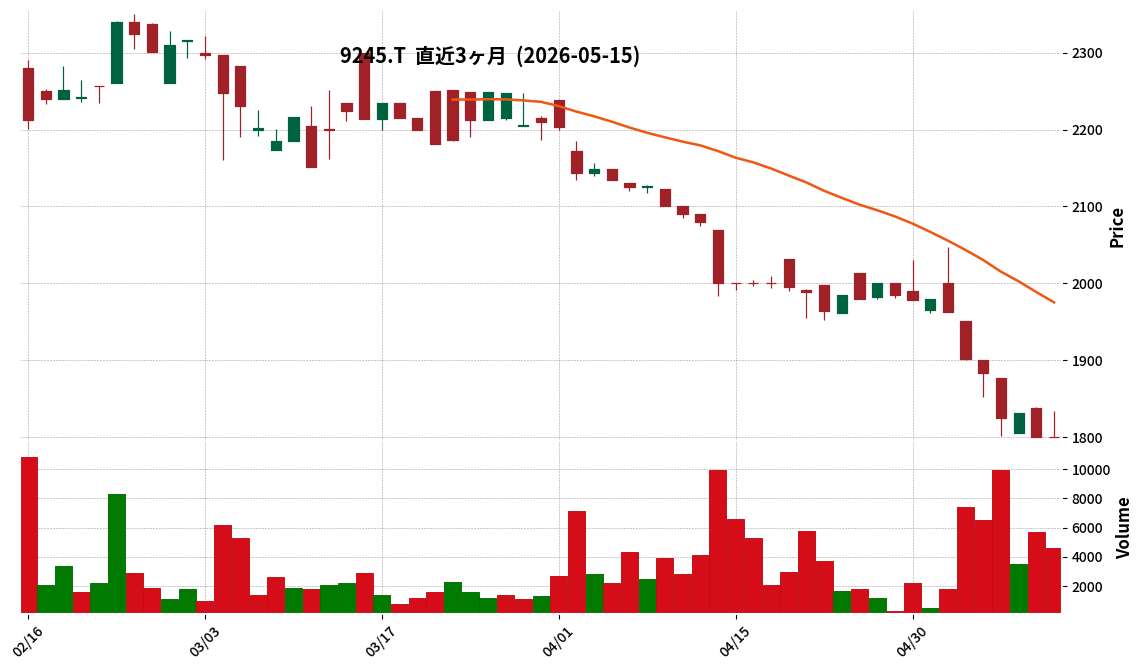
9245|G-リベロ
1800.0
▲ +0.00%
This article is an AI-generated summary and analysis of official IR disclosures.
📄 Announcement (AI-Reviewed)
- G-Libero announced its Q1 FY2026 consolidated financial results for the period from January 1, 2026, to March 31, 2026.
- Consolidated net sales reached ¥1,544 million, representing a 23.8% increase compared to the same period of the previous year.
- Consolidated operating profit was ¥535 million and ordinary profit was ¥538 million, marking increases of 90.3% and 90.9% respectively year-over-year.
- Net income attributable to owners of the parent recorded ¥369 million, an increase of 101.1% from the prior year’s first quarter.
- Basic earnings per share for the quarter were ¥69.72, and diluted earnings per share were ¥62.75.
🤖 AI Perspective
G-Libero’s Q1 FY2026 results show significant year-over-year growth across all key financial metrics, suggesting robust operational performance. The substantial increase in net income attributable to owners of the parent, up by 101.1%, could indicate improved profitability. The expansion of current assets and total assets in the consolidated financial position may reflect the company’s ongoing business expansion efforts.
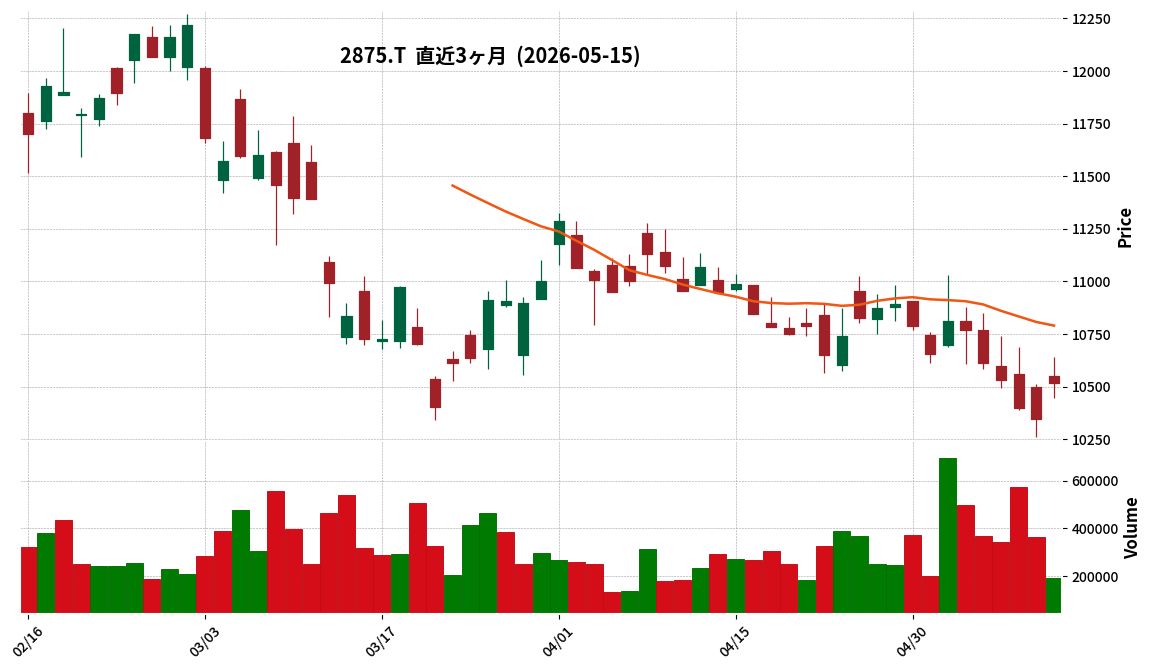
2875|東洋水産
10520.0
▲ +1.69%
This article is an AI-generated summary and analysis of official IR disclosures.
📄 Announcement (AI-Reviewed)
- Toyo Suisan Kaisha, Ltd. announced on May 15, 2026, that its Board of Directors resolved to increase the year-end dividend for shareholders of record as of March 31, 2026.
- The per-share dividend for the year-end will be JPY 140.00, an increase of JPY 20.00 from the latest dividend forecast of JPY 120.00 announced on January 30, 2026.
- The total dividend amount will be JPY 13,635 million.
- The effective date for the dividend payment is June 26, 2026, with the source of funds being retained earnings.
- This revision means the total annual dividend per share for the fiscal year ending March 2026 is projected to be JPY 220.00 (interim JPY 80.00, year-end JPY 140.00), compared to JPY 200.00 for the previous fiscal year (March 2025).
🤖 AI Perspective
This dividend increase is consistent with the company’s stated policy of prioritizing sustainable corporate value enhancement and shareholder returns through dividends and share buybacks. The upward revision from the previous forecast may be viewed favorably by investors, signaling robust financial performance or a strong commitment to shareholder distribution. This development could prompt further investor scrutiny into the company’s future capital allocation strategies.
5869|早稲田学習研究会
1331.0
▲ +0.30%
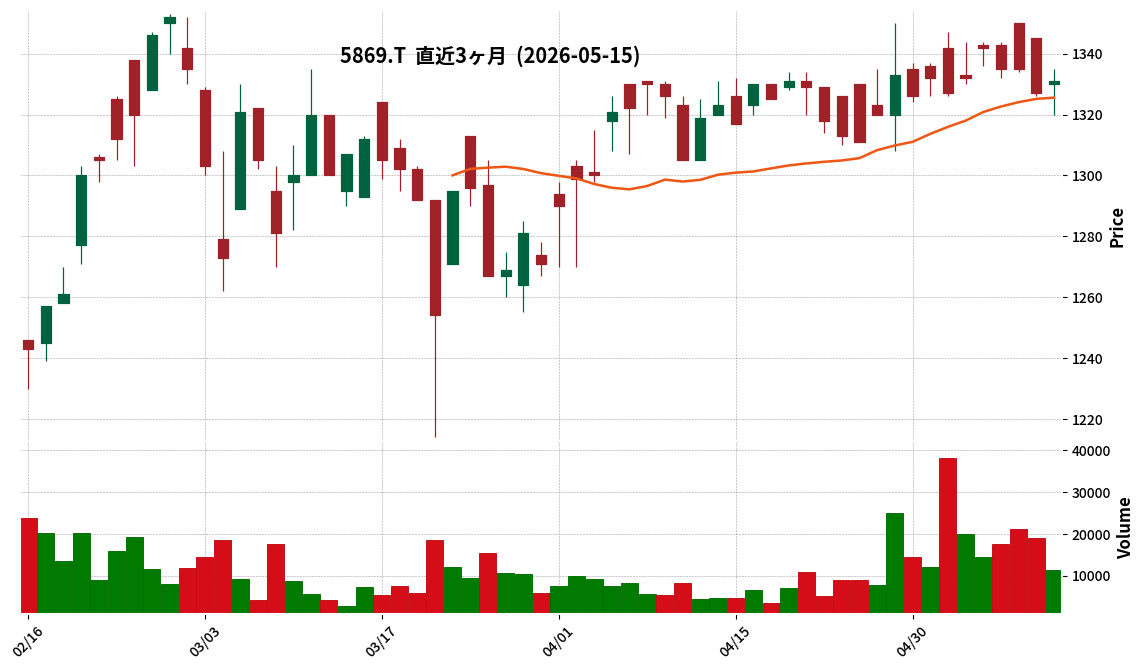
📎 Source:早稲田学習研究会 Official IR →
This article is an AI-generated summary and analysis of official IR disclosures.
📄 Announcement (AI-Reviewed)
- Waseda Gakushu Kenkyukai Co., Ltd. announced its financial results for the fourth quarter of the fiscal year ending May 2026 (April 1, 2025 – March 31, 2026).
- For the cumulative period of the fourth quarter, net sales were ¥7,113 million, operating profit was ¥1,410 million, ordinary profit was ¥1,413 million, and quarterly net profit was ¥969 million.
- Due to a change in the fiscal year end (from March to May), the current fiscal year spans 14 months (April 1, 2025 – May 31, 2026), thus year-on-year growth rates are not provided.
- As for financial position, total assets at the end of the fourth quarter were ¥9,633 million (an increase of ¥319 million from the previous fiscal year end), and net assets were ¥7,282 million (an increase of ¥268 million), with an equity ratio of 75.6%.
- The full-year earnings forecast for the fiscal year ending May 2026 (April 1, 2025 – May 31, 2026) remains unchanged at net sales of ¥8,072 million, operating profit of ¥1,450 million, ordinary profit of ¥1,470 million, and net profit of ¥1,010 million.
🤖 AI Perspective
Investors should note that the company’s fiscal year change results in a 14-month irregular reporting period, precluding direct year-on-year comparisons. The consistency of the full-year earnings and dividend forecasts suggests that the company is progressing according to its plans. The growth in total assets and net assets, coupled with a high equity ratio, generally indicates a solid financial position for the company.
3909|ショーケース
223.0
▼ -1.33%
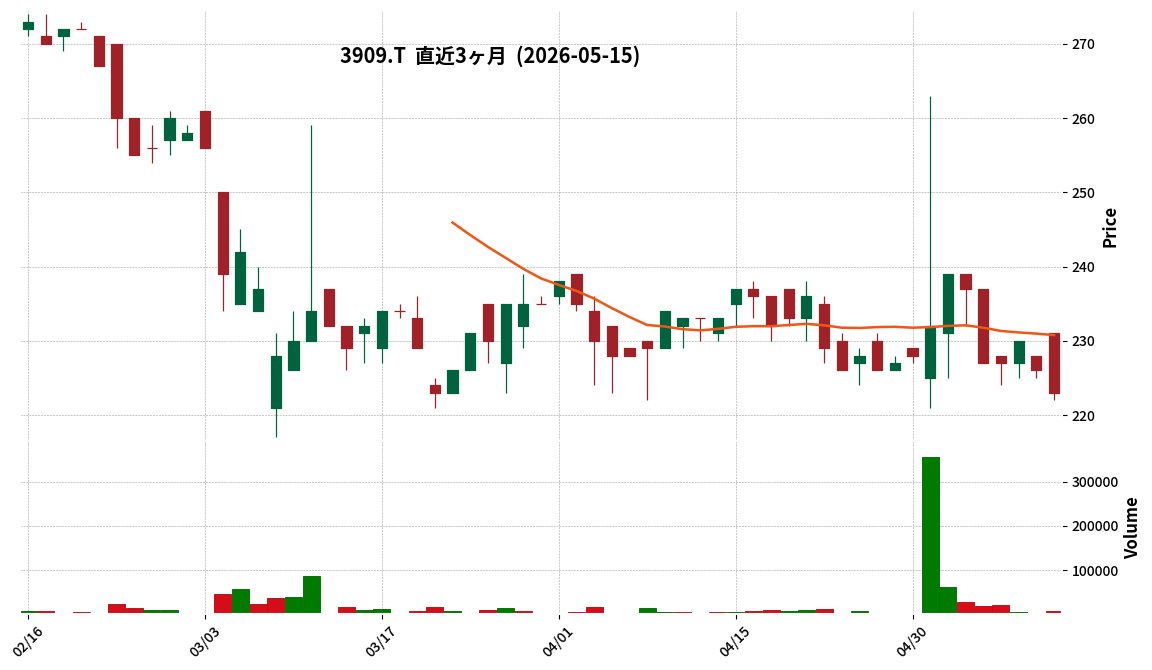
This article is an AI-generated summary and analysis of official IR disclosures.
📄 Announcement (AI-Reviewed)
- Showcase announced its full-year financial results for the fiscal period ending March 2026.
- The fiscal year ending March 2026 represents an irregular 15-month transitional period from January 1, 2025, to March 31, 2026, due to a change in fiscal year end.
- Consolidated results for this period show net sales of ¥3,261 million, operating income of ¥126 million, ordinary income of ¥120 million, and net income attributable to owners of the parent of ¥850 million.
- For the fiscal year ending March 2027, the company forecasts consolidated net sales of ¥1,460 million, operating income of ¥150 million, ordinary income of ¥150 million, and net income attributable to owners of the parent of ¥110 million.
- Dividends for both the fiscal year ended December 2024 and March 2026 are undecided.
🤖 AI Perspective
The irregular 15-month fiscal period for March 2026 makes direct year-over-year comparisons challenging. While the company reported a profit for this extended period, the fiscal year ending March 2027 will revert to a standard 12-month period, which suggests a different scale for net sales and profit figures compared to the March 2026 results. Investors may want to monitor future business strategies and shifts in the revenue structure.
147A|G-ソラコム
1009.0
▲ +2.96%
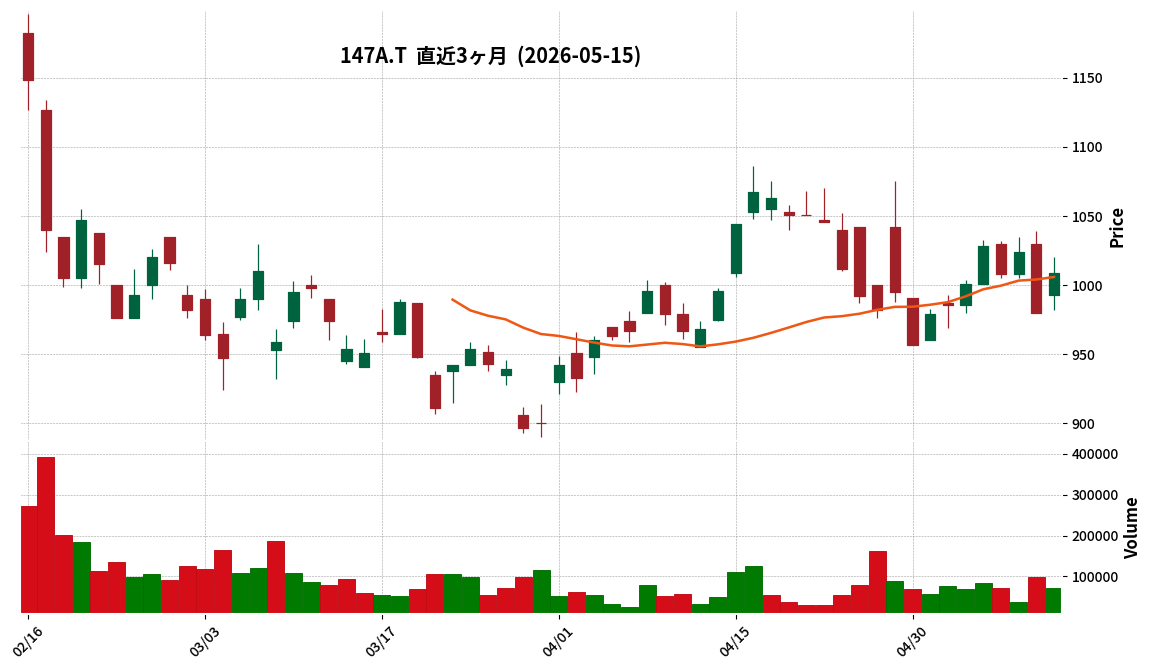
This article is an AI-generated summary and analysis of official IR disclosures.
📄 Announcement (AI-Reviewed)
- G-SORACOM announced its consolidated financial results for the full year ended March 2026.
- Revenue reached ¥12,423 million, marking a 38.1% increase year-over-year.
- Recurring revenue totaled ¥9,296 million, an increase of 41.7% compared to the previous fiscal year.
- Net profit attributable to owners of the parent company was ¥631 million, a significant rise of 79.0% year-over-year.
- For the full year ending March 2027, the company forecasts consolidated revenue of ¥15,124 million (+21.7% YoY) and net profit attributable to owners of the parent of ¥706 million (+11.8% YoY).
🤖 AI Perspective
G-SORACOM’s fiscal year 2026 results highlight substantial growth in both revenue and net profit, with particular strength in recurring revenue. This performance may indicate the success of its AI/IoT connectivity platform business in meeting market demand. The positive outlook for the upcoming fiscal year, with projected increases in both revenue and profit, suggests continued momentum, though the realization of these forecasts will be worth monitoring.
7037|テノ.
914.0
▲ +2.70%
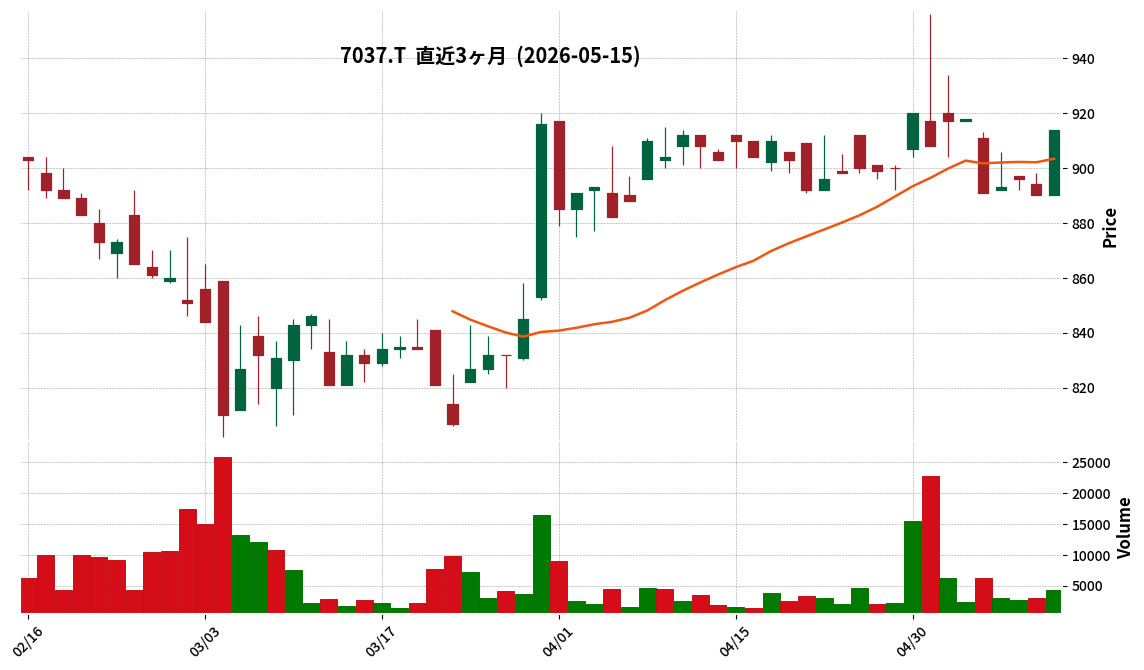
This article is an AI-generated summary and analysis of official IR disclosures.
📄 Announcement (AI-Reviewed)
- Teno. Holdings Co., Ltd. released its supplemental financial results for the first quarter of the fiscal year ending December 2026.
- Company-wide net sales reached ¥4,584 million (104.5% year-on-year), and operating profit was ¥225 million (180.4% year-on-year), marking the highest first-quarter performance on record.
- Increased sales from new childcare facilities, after-school care, and elderly care facilities contracted since April 2025 contributed to the revenue growth.
- The high rate of increase in public childcare fees in fiscal year 2025 also contributed to the sales increase.
- Labor costs in the first quarter decreased year-on-year, and profit margins improved, partly due to the brought-forward settlement of public childcare fees from March to December.
🤖 AI Perspective
Teno.’s Q1 FY2026 results show robust sales growth driven by new facility contracts and rising public fees, alongside a significant improvement in profit margins attributed to changes in the timing of labor cost recognition. The increasing proportion of the elderly care business within the company’s portfolio may suggest a strategic shift, and its future impact on overall performance will be worth monitoring for investors.
Disclaimer: This article is for informational purposes only and does not constitute investment advice.
8157|都築電気
3840.0
▲ +6.67%
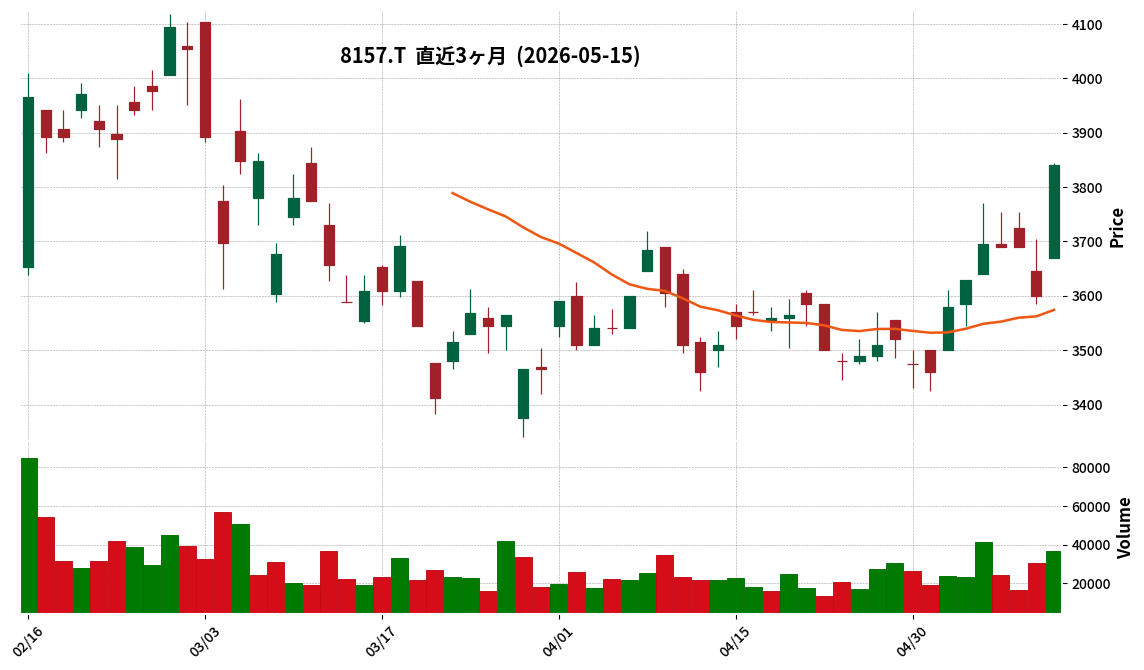
This article is an AI-generated summary and analysis of official IR disclosures.
📄 Announcement (AI-Reviewed)
- Tsukiden has formulated a new three-year Mid-Term Management Plan, “Trust & Challenge 2029,” starting from the fiscal year ending March 2027.
- The consolidated performance targets for the final year of the new plan, FY2029, are JPY 120.0 billion for net sales, JPY 12.0 billion for operating profit, and ROE of 14.5% or higher.
- The long-term vision’s challenge targets for FY2033 have been revised upwards, with operating profit increasing from the initial target of JPY 10.0 billion to JPY 18.0 billion, and ROE from 15% to 17% (net sales target of JPY 150.0 billion remains unchanged).
- The company’s shareholder return policy has been revised, raising the target consolidated dividend payout ratio from 40% to 60%, and the DOE (Dividend on Equity) target from 3.5% to 6.0%.
- The Mid-Term Management Plan outlines “Transformation into a Professional Service Company,” “Enhancing Corporate Value through a Virtuous Cycle of Growth and Returns,” and “Transition to a Human Capital Portfolio Accelerating Value Creation” as challenges for improving corporate value.
🤖 AI Perspective
Tsukiden attributes the upward revision of its long-term vision and the setting of ambitious targets in its new mid-term plan to the successful execution of its previous plan, “Transformation 2026,” which led to a significant shift of resources to growth areas and a transition to a high-profitability structure. The substantial increase in operating profit targets suggests strong management confidence in future earnings improvements. Furthermore, the significant increase in the dividend payout ratio could indicate a strengthened commitment to shareholder returns, which may attract investor interest.
9244|G-デジタリフト
1000.0
▼ -3.19%
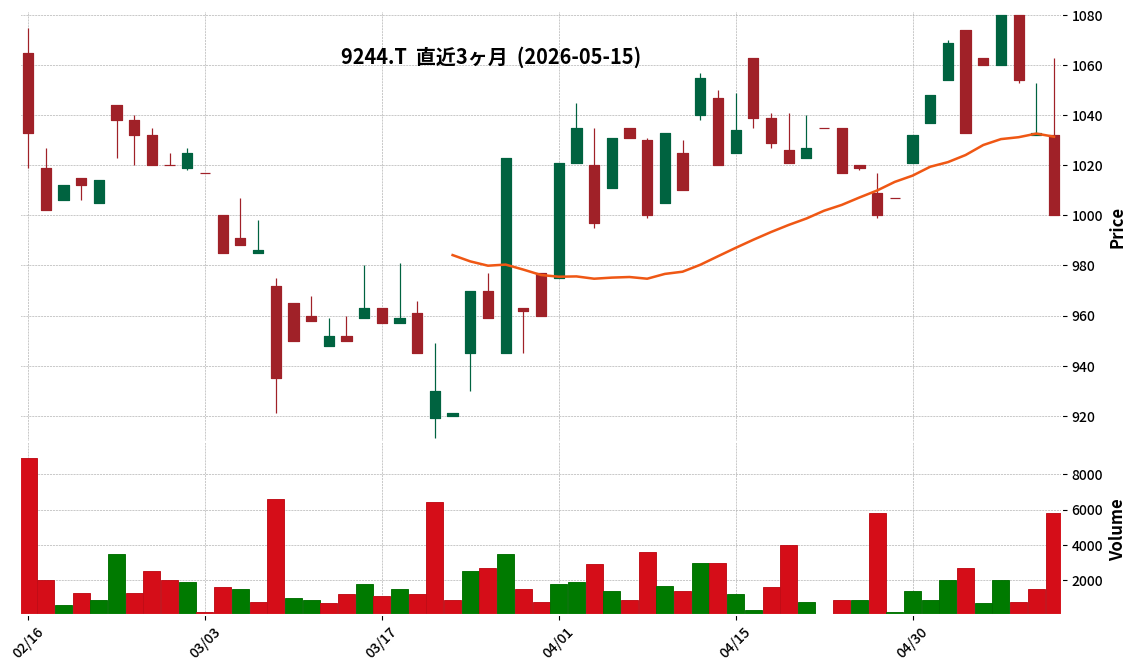
📎 Source:G-デジタリフト Official IR →
This article is an AI-generated summary and analysis of official IR disclosures.
📄 Announcement (AI-Reviewed)
- G-Digitalift Inc. announced its Q2 FY2026 (interim period) consolidated financial results on May 15, 2026.
- For the interim period of FY2026, consolidated net sales were ¥1,763 million, marking a 3.0% increase compared to the same period of the previous year.
- Operating profit reached ¥119 million (+2,531.0% YoY), ordinary profit was ¥115 million (+1,446.0% YoY), and net profit attributable to parent company shareholders was ¥70 million (+3,294.5% YoY).
- Diluted EPS for the interim period stood at ¥49.35, with diluted EPS (adjusted for potential shares) at ¥49.17.
- The full-year consolidated earnings forecast for FY2026 remains unchanged from the most recently published forecast, projecting net sales of ¥4,321 million (+23.8% YoY), operating profit of ¥210 million (+12.0% YoY), ordinary profit of ¥196 million (+5.9% YoY), and net profit attributable to parent company shareholders of ¥111 million (+2.8% YoY).
1822|大豊建
750.0
▲ +0.94%
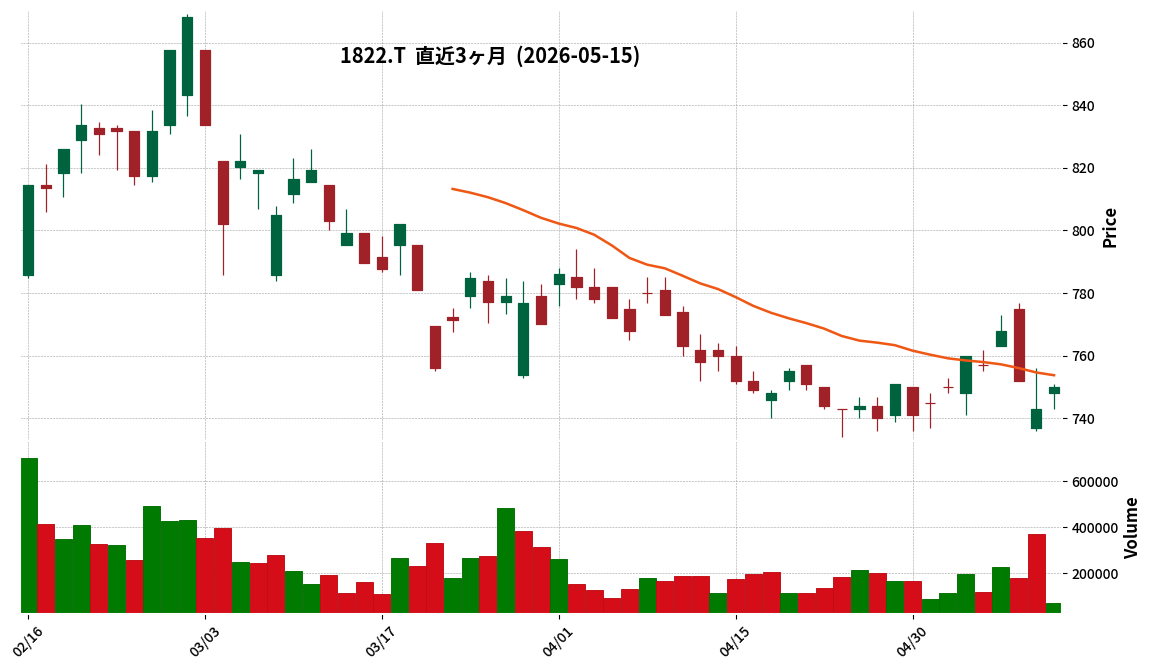
This article is an AI-generated summary and analysis of official IR disclosures.
📄 Announcement (AI-Reviewed)
- Daiho Construction Co., Ltd. announced a partial correction to its “Consolidated Financial Results for the Fiscal Year Ended March 31, 2026 (Japanese GAAP)” on May 15, 2026.
- The correction stems from an error in the description within “1. Overview of Operating Results (4) Future Outlook” of the financial results released on May 13, 2026.
- The consolidated forecast for net profit attributable to owners of parent for the fiscal year ending March 31, 2027 (FY2026) was revised from ¥4,800 million to ¥4,700 million.
- Consequently, the year-over-year growth rate for this figure was also adjusted from a 5.3% increase to a 3.1% increase.
- There were no changes to the forecasts for consolidated net sales, consolidated ordinary profit, or the company’s (non-consolidated) completed construction revenue, ordinary profit, and net profit.
🤖 AI Perspective
This correction is confined to the consolidated net profit attributable to owners of parent and its year-over-year growth rate for FY2027/3, with no impact on consolidated net sales, consolidated ordinary profit, or the non-consolidated performance forecasts. The magnitude of the adjustment to the consolidated net profit appears relatively small in relation to the overall profit scale. Investors may want to monitor any further communications from the company regarding the implications of this revision on its business strategy and future profitability.
2806|ユタカフーズ
2069.0
▲ +1.17%
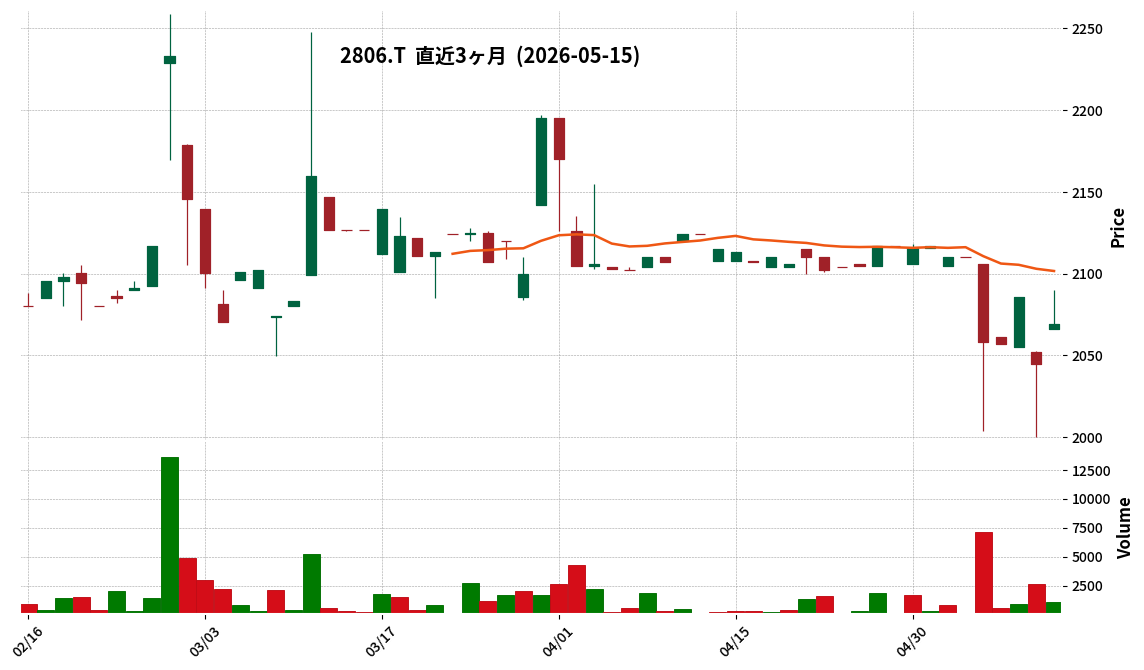
This article is an AI-generated summary and analysis of official IR disclosures.
📄 Announcement (AI-Reviewed)
- Yutaka Foods announced its non-consolidated financial results for the fiscal year ended March 2026 (April 1, 2025 – March 31, 2026).
- Net sales increased by 3.7% year-on-year to ¥14,988 million.
- Operating profit decreased by 79.0% to ¥143 million, ordinary profit by 63.6% to ¥291 million, and net profit by 63.1% to ¥204 million.
- By segment, the Chilled Foods segment recorded a segment loss of ¥457 million due to increased depreciation and expenses related to the new plant’s operation. The Powder Products segment saw a 93.1% increase in segment profit to ¥398 million due to increased commissioned granulation products.
- For the fiscal year ending March 2027, the company forecasts net sales of ¥15,900 million (up 6.1% year-on-year), operating profit of ¥10 million (down 93.0%), and net profit of ¥107 million (down 47.6%).
🤖 AI Perspective
While net sales increased, a significant decrease in profit appears to be attributable to increased depreciation and other expenses related to the operation of the new chilled food plant. The segment breakdown suggests that strong performance in the powder products segment drove overall sales growth, but the investment phase in the chilled foods segment, with its associated cost burden, impacted overall profitability. The future profitability improvement and contribution of the chilled foods segment to overall earnings will be worth monitoring.
2874|ヨコレイ
1696.0
▼ -1.62%
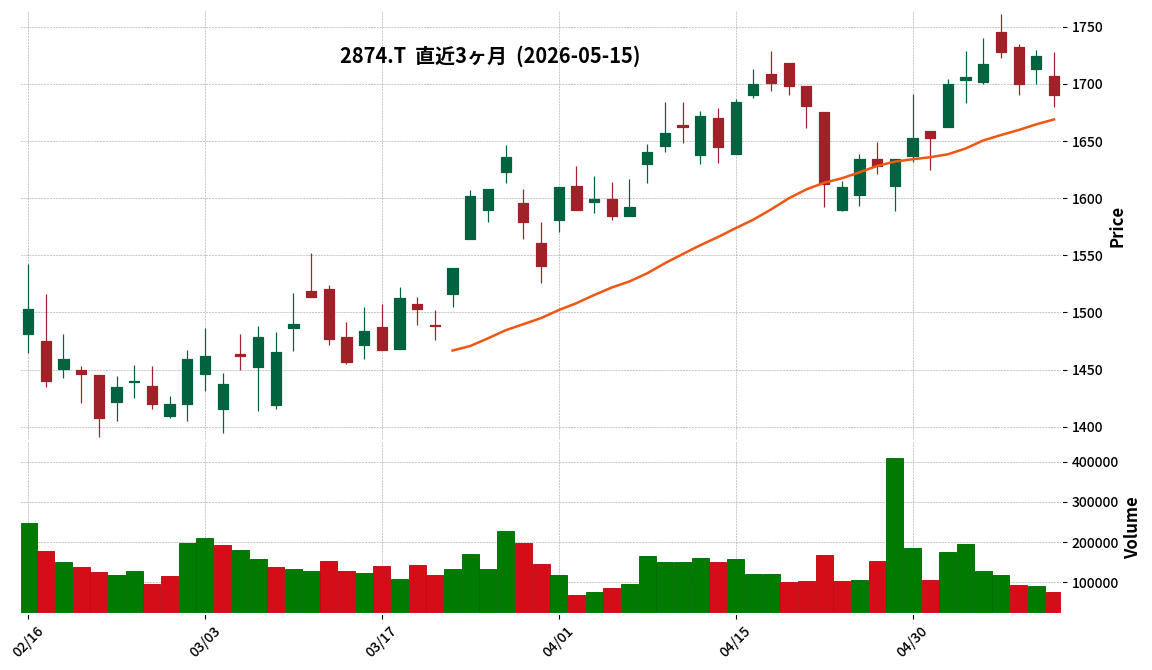
This article is an AI-generated summary and analysis of official IR disclosures.
📄 Announcement (AI-Reviewed)
- Yokohama Reito Co., Ltd. announced its consolidated financial results for the second quarter (interim period) of the fiscal year ending September 2026.
- Consolidated results show net sales of ¥64,228 million (up 1.3% year-on-year), operating profit of ¥4,106 million (up 35.0%), ordinary profit of ¥4,304 million (up 65.3%), and profit attributable to owners of parent of ¥2,849 million (up 70.5%).
- The Cold Storage business segment reported net sales of ¥20,359 million (up 10.3%) and operating profit of ¥4,793 million (up 10.7%), achieving its highest interim operating profit to date.
- The Food Sales business segment recorded net sales of ¥43,853 million (down 2.5%) and operating profit of ¥1,450 million (up 107.3%), also marking its highest interim operating profit to date.
- The full-year consolidated earnings forecast has been revised upwards: net sales remain at ¥125,000 million, operating profit to ¥7,000 million (up ¥2,000 million from previous forecast), ordinary profit to ¥6,400 million (up ¥2,000 million), and profit attributable to owners of parent to ¥4,800 million (up ¥1,900 million).
- The year-end dividend forecast for the fiscal year ending September 2026 has been revised to ¥14.00 per share, with an annual dividend forecast of ¥27.00 per share.
🤖 AI Perspective
The strong performance across both the cold storage and food sales segments, with both achieving record-high interim profits, suggests effective strategic execution. The significant increase in operating profit for the food sales business, despite a slight decrease in sales, may indicate success in its shift towards a profit-margin-focused business structure. The upward revision of the full-year earnings and dividend forecasts could signal management’s confidence in sustained positive momentum.
2876|デルソーレ
439.0
▼ -1.35%
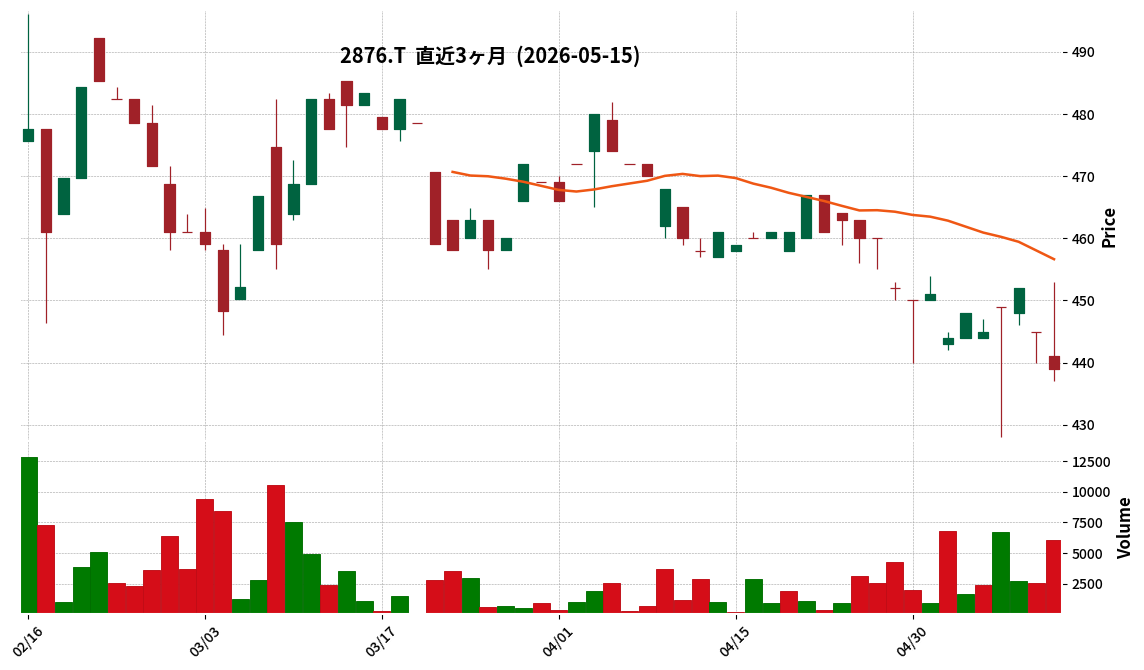
This article is an AI-generated summary and analysis of official IR disclosures.
📄 Announcement (AI-Reviewed)
- Delsole Co., Ltd. announced its non-consolidated financial results for the fiscal year ended March 31, 2026.
- For FY2026, net sales were ¥14,620 million (down 5.1% year-on-year), operating profit was ¥430 million (down 23.3% year-on-year), and ordinary profit was ¥375 million (down 30.4% year-on-year).
- Net income for the period was ¥212 million, representing a return to profitability from a net loss of ¥422 million in the previous fiscal year.
- Earnings per share (EPS) for FY2026 were ¥23.82.
- The year-end dividend for FY2026 was set at ¥12.00 per share (total annual dividend of ¥12.00), a decrease from ¥15.00 in FY2025.
- For the fiscal year ending March 31, 2027, the company forecasts net sales of ¥16,000 million (up 9.4% year-on-year), operating profit of ¥700 million (up 62.7% year-on-year), ordinary profit of ¥700 million (up 86.6% year-on-year), and net income of ¥400 million (up 88.6% year-on-year).
🤖 AI Perspective
Delsole’s FY2026 results show a decrease in net sales and operating profit, but a significant turnaround to net income profitability from a loss in the previous year. This suggests a potential improvement in the company’s underlying financial health. The robust forecast for FY2027, projecting substantial increases across all key financial metrics, indicates the company anticipates a strong recovery and growth trajectory in the upcoming period.
3047|Q-トラックワン
—
▲ +0.00%
📎 Source:Q-トラックワン Official IR →
This article is an AI-generated summary and analysis of official IR disclosures.
📄 Announcement (AI-Reviewed)
- TRUCK-ONE announced its consolidated financial results for the first quarter of the fiscal year ending December 2026 (January 1, 2026 – March 31, 2026).
- Net sales amounted to ¥1,893 million, representing a 9.0% increase compared to the same period of the previous year.
- Operating profit reached ¥167 million (up 57.0% year-on-year), ordinary profit ¥177 million (up 60.5% year-on-year), and net income attributable to owners of parent ¥111 million (up 63.3% year-on-year).
- By segment, the commercial vehicle related business reported net sales of ¥1,683 million (up 10.3% year-on-year) and segment profit of ¥138 million (up 71.7% year-on-year).
- The transportation related business recorded net sales of ¥209 million (down 0.4% year-on-year), while its segment profit was ¥29 million (up 22.6% year-on-year).
- The consolidated full-year earnings forecast for the fiscal year ending December 2026 remains unchanged from the forecast announced on February 13, 2026.
🤖 AI Perspective
TRUCK-ONE’s Q1 FY2026 results show significant year-over-year growth across net sales and all profit metrics, with the commercial vehicle business notably driving performance. The strong sales of large cargo vehicles in the domestic market appear to have contributed to the overall revenue and profit increases. While the transportation business saw flat sales, its improved profitability might indicate ongoing operational efficiencies within the segment.
3397|トリドールHD
3954.0
▲ +1.75%
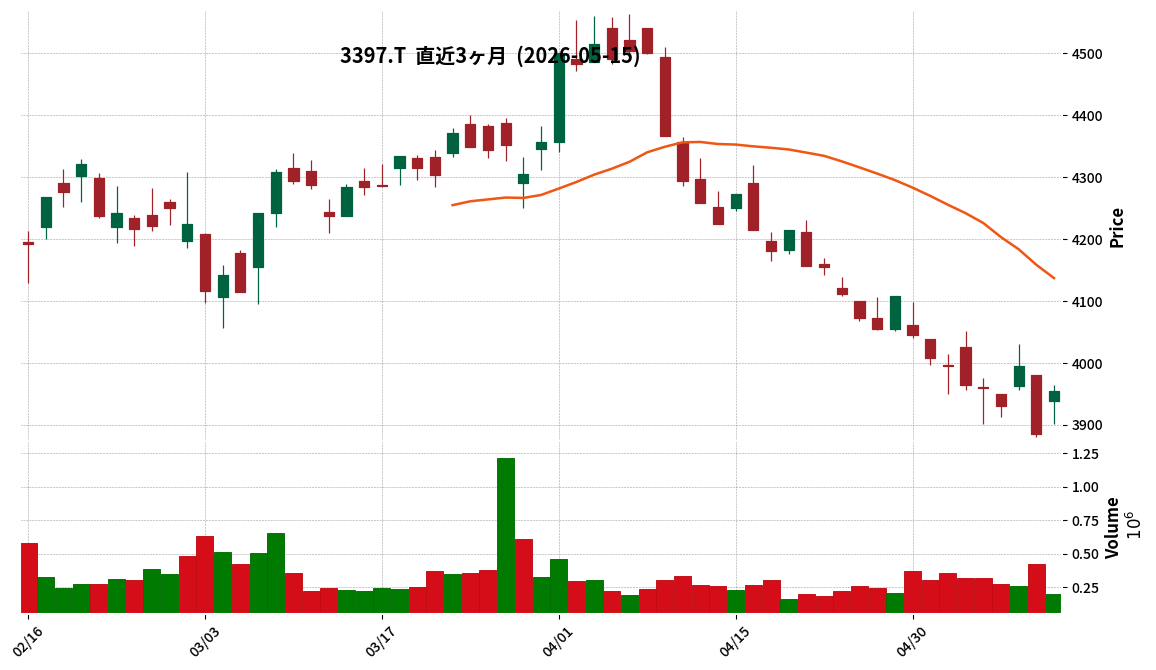
📎 Source:トリドールHD Official IR →
This article is an AI-generated summary and analysis of official IR disclosures.
📄 Announcement (AI-Reviewed)
- Toridoll Holdings reported consolidated revenue of ¥278,715 million for the fiscal year ended March 2026, marking a 3.9% increase year-on-year.
- Business profit reached ¥21,460 million (+17.9% YoY), and operating profit was ¥10,578 million (+21.9% YoY).
- Profit attributable to owners of the parent increased by 23.3% year-on-year to ¥2,311 million.
- The annual dividend for the fiscal year ended March 2026 was ¥11.00 per share (including a year-end dividend of ¥11.00), an increase from ¥10.00 in the previous year.
- For the fiscal year ending March 2027, the company forecasts consolidated revenue of ¥287,000 million (+3.0% YoY) and profit attributable to owners of the parent of ¥7,000 million (+202.9% YoY).
3845|アイフリーク
250.0
▼ -1.19%
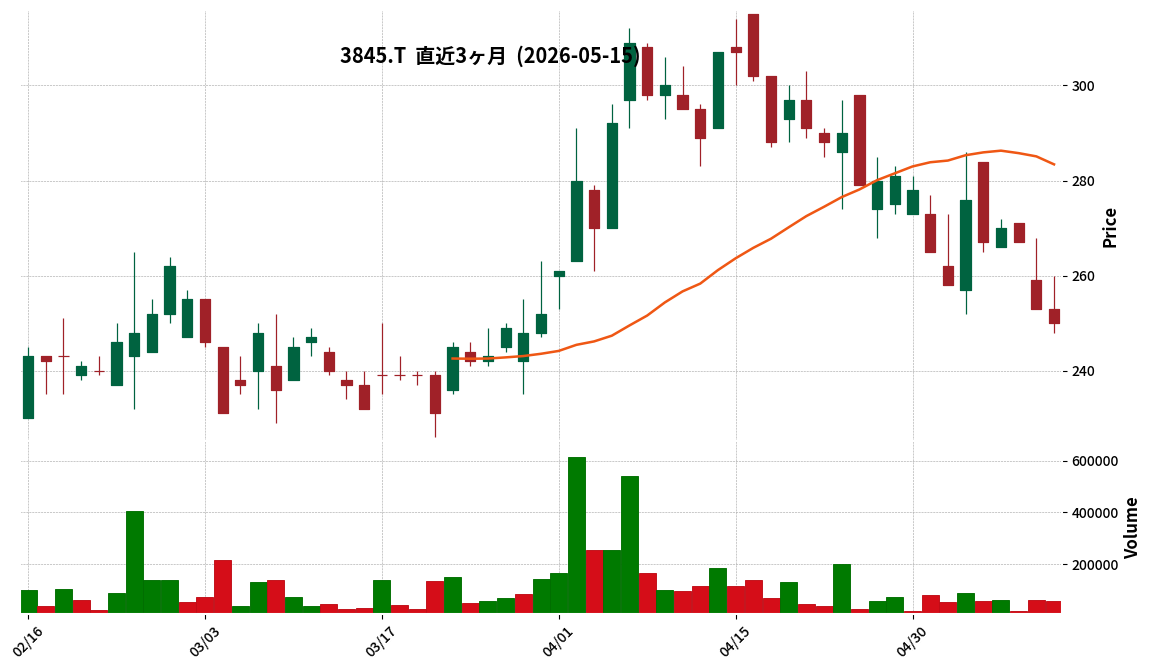
This article is an AI-generated summary and analysis of official IR disclosures.
📄 Announcement (AI-Reviewed)
- i-Freek Mobile Co., Ltd. announced its non-consolidated financial results for the fiscal year ended March 31, 2026.
- Net sales for the fiscal year 2026/3 were ¥1,865 million, representing a 6.9% decrease from the previous fiscal year.
- The company reported an operating income of ¥29 million (compared to an operating loss of ¥61 million in the prior year), an ordinary income of ¥32 million (compared to an ordinary loss of ¥50 million in the prior year), and a net income of ¥43 million (compared to a net loss of ¥110 million in the prior year), marking a return to profitability.
- Diluted earnings per share for the fiscal year were ¥1.97.
- For the fiscal year ending March 31, 2027, the company forecasts net sales of ¥1,670 million (a 10.5% decrease year-on-year), an operating loss of ¥11 million, an ordinary loss of ¥13 million, and a net income of ¥1 million.
- Effective from the fiscal year 2027/3, the Content Business and DX Business will be integrated into a single “DX Business” reporting segment.
🤖 AI Perspective
The shift to profitability in operating income, ordinary income, and net income for FY2026/3, despite a decline in net sales, is a significant development for i-Freek. This suggests that the company’s efforts in portfolio restructuring, structural reforms, and securing higher-value projects may be yielding positive results in terms of efficiency and profitability. However, the projected decrease in revenue and a return to minor profitability for FY2027/3 indicate potential ongoing challenges or strategic investments, making the impact of the planned business integration a key factor for investors to monitor.
4074|G-ラキール
680.0
▼ -0.73%
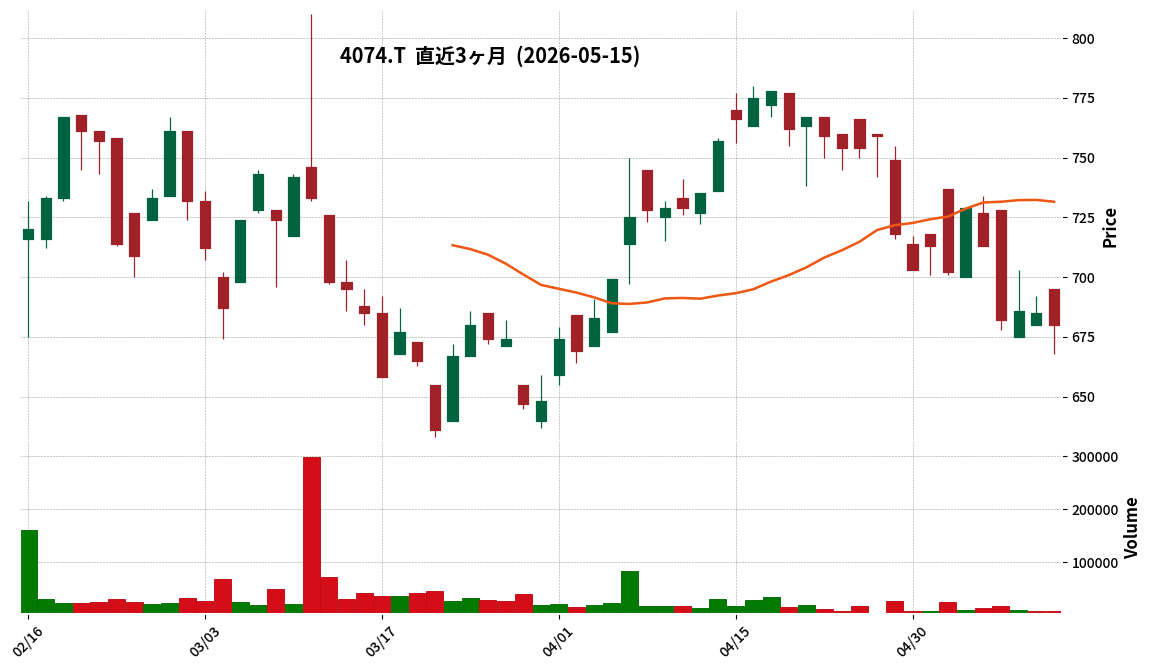
This article is an AI-generated summary and analysis of official IR disclosures.
📄 Announcement (AI-Reviewed)
- Lakeel Inc. announced its consolidated financial results for the first quarter of the fiscal year ending December 2026 (January 1, 2026, to March 31, 2026).
- Consolidated net sales reached ¥1,999 million, representing an 8.3% decrease compared to the same period in the previous year.
- Consolidated operating profit was ¥10 million, a significant decrease of 97.4% year-over-year.
- Net loss attributable to owners of the parent was ¥5 million, a shift from a net profit of ¥282 million in the prior-year period.
- By service segment, Product Services revenue was ¥1,178 million (down 20.1% YoY), while Professional Services revenue was ¥821 million (up 16.1% YoY).
- The consolidated full-year earnings forecast for the fiscal year ending December 2026 remains unchanged from the announcement made on February 13, 2026.
🤖 AI Perspective
G-Lakeel’s Q1 FY2026 results show a notable decline in overall revenue and profit, primarily attributed to a decrease in new license sales for Product Services. However, the growth in Professional Services and the robust performance of subscription revenue in Product Services suggest a potential shift in revenue composition. The unchanged full-year forecast could indicate management’s expectation of a recovery in subsequent quarters, making the balance between different service lines a key factor for future performance.
4165|G-プレイド
509.0
▲ +1.39%
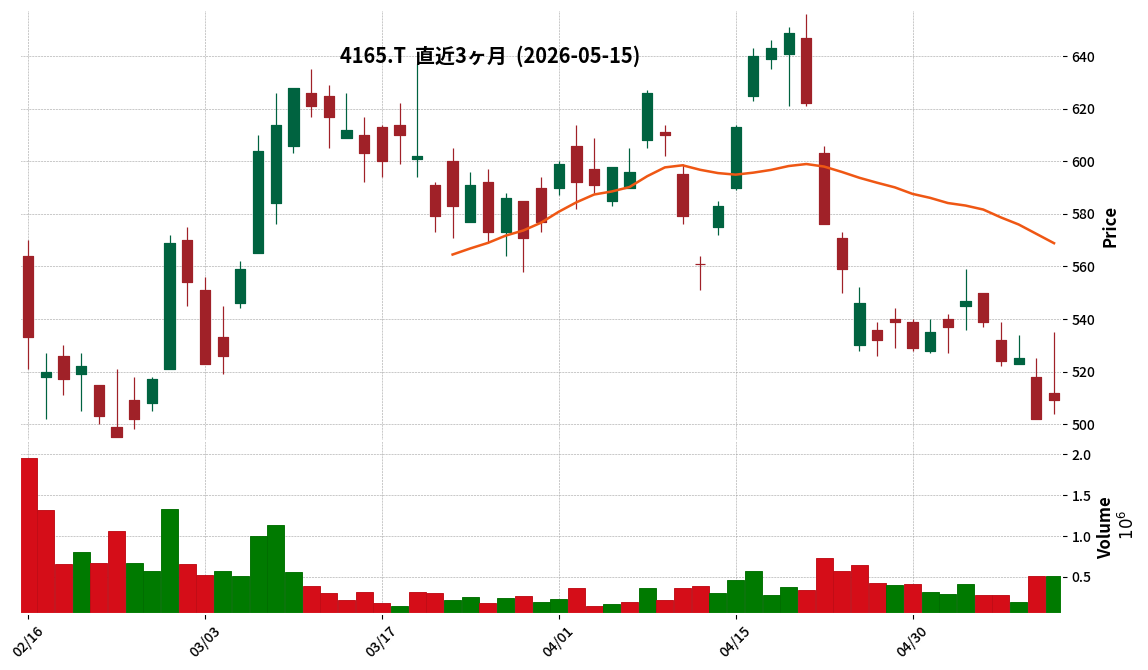
This article is an AI-generated summary and analysis of official IR disclosures.
📄 Announcement (AI-Reviewed)
- PLAID Inc. announced on May 15, 2026, a partial correction to its “Consolidated Financial Results for the Second Quarter of the Fiscal Year Ending December 2026 (Japanese GAAP)” initially published on May 14, 2026.
- The reason for the correction was the discovery of errors in the calculation of the year-on-year change rates for both the full fiscal year and the quarterly period.
- In addition to the relevant textual corrections, updated numerical data has also been submitted.
- Corrected sections are indicated with an underline in the revised document.
🤖 AI Perspective
This correction addresses errors in previously released financial results, specifically concerning growth rate calculations. Investors may find it important to refer to the corrected figures for an accurate assessment of the company’s performance. Such revisions underscore the importance of accurate reporting in financial disclosures, which is a key element for investor confidence.
4754|トスネット
1500.0
▲ +2.88%
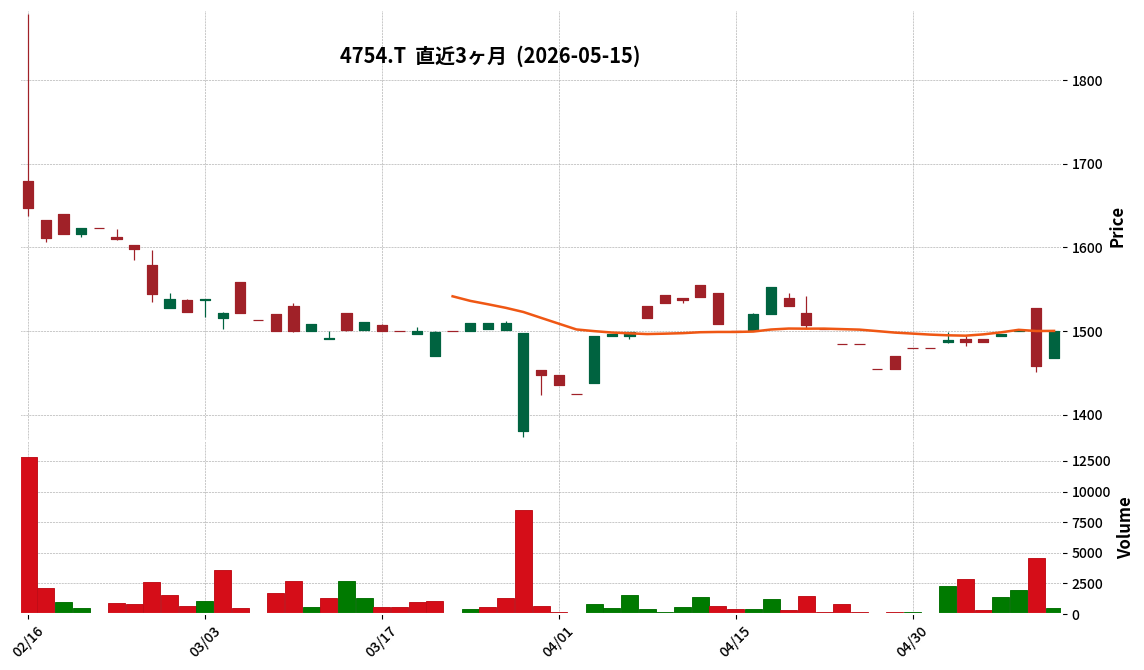
This article is an AI-generated summary and analysis of official IR disclosures.
📄 Announcement (AI-Reviewed)
- Tosnet Co., Ltd. has announced its consolidated financial results for the second quarter of the fiscal year ending September 2026.
- Net sales for the interim period were ¥5,613 million, representing a 6.0% decrease compared to the same period in the previous year.
- Operating profit was ¥232 million (down 42.8% year-on-year), ordinary profit was ¥329 million (down 27.3% year-on-year), and net profit attributable to owners of the parent was ¥52 million (down 80.8% year-on-year).
- Basic earnings per share for the interim period stood at ¥11.23.
- The full-year consolidated earnings forecast and the annual dividend forecast (¥37.00 per share for the fiscal year-end) remain unchanged from the most recently announced figures.
🤖 AI Perspective
Tosnet’s Q2 FY2026 results show a decline across all key financial indicators compared to the previous year, with a significant drop in net profit attributable to owners of the parent. Investors may focus on identifying the factors contributing to this performance deterioration. While the full-year forecast remains unchanged, suggesting an anticipated recovery in the second half, the company’s progress during the remainder of the fiscal year could be worth monitoring.
4767|TOW
372.0
▲ +0.54%
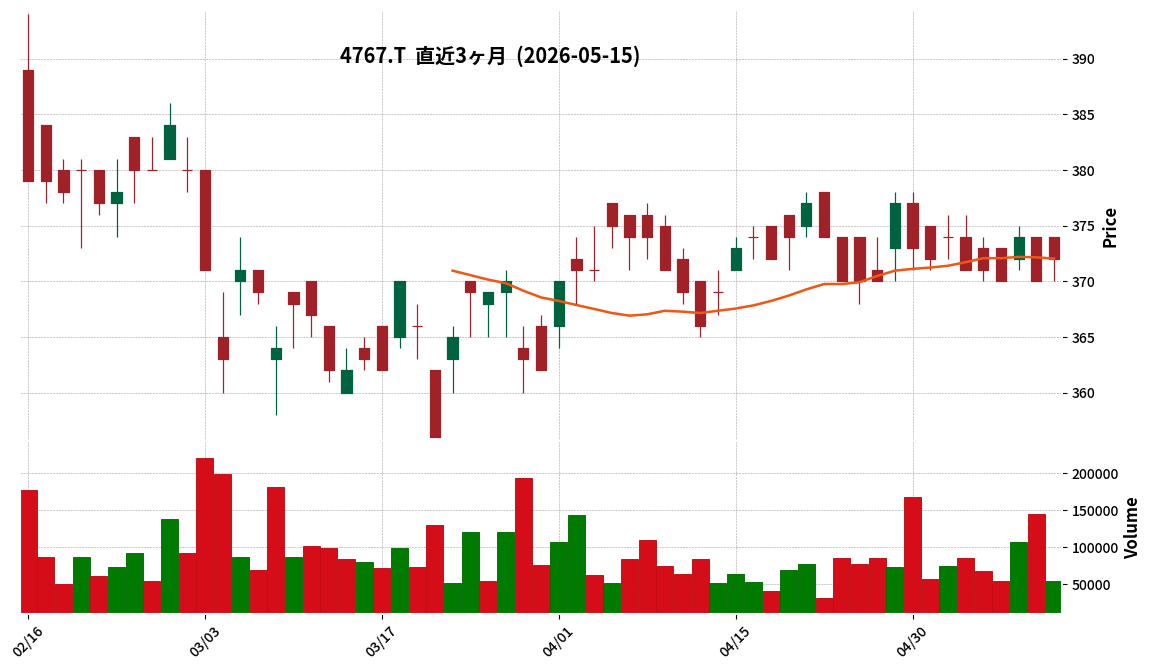
This article is an AI-generated summary and analysis of official IR disclosures.
📄 Announcement (AI-Reviewed)
- TOW Inc. announced its consolidated financial results for the third quarter of the fiscal year ending June 2026 (July 1, 2025 – March 31, 2026).
- During this nine-month period, net sales were ¥13,793 million (up 10.1% year-on-year), operating profit was ¥1,385 million (up 2.7%), and ordinary profit was ¥1,399 million (up 1.2%).
- Net profit attributable to owners of the parent company amounted to ¥910 million (down 0.6% year-on-year).
- By business category, real events recorded sales of ¥9,410 million (up 27.0% year-on-year), while hybrid events decreased to ¥1,309 million (down 17.7%) and integrated promotions to ¥3,059 million (down 11.4%).
- The full-year consolidated earnings forecast and dividend forecast (¥18.30 per share annually) remain unchanged from the most recently published figures.
🤖 AI Perspective
TOW’s Q3 FY2026 results show double-digit sales growth, primarily driven by a strong recovery in real events, indicating a shift in market demand. However, profit growth lagged behind sales growth, attributed to investments in corporate governance and management infrastructure, as well as M&A-related expenses. The continued recovery of demand for real events and the resulting evolution in business structure could be a key factor to monitor for future performance.
5923|高田機工
1220.0
▲ +2.09%
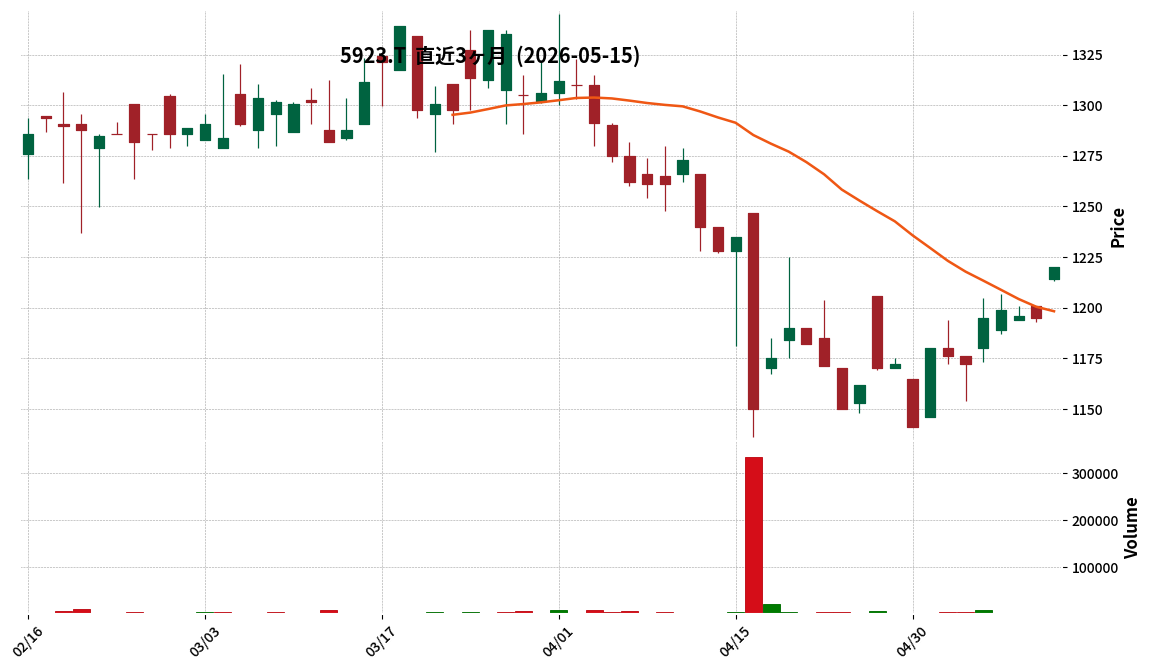
This article is an AI-generated summary and analysis of official IR disclosures.
📄 Announcement (AI-Reviewed)
- Takada Kiko reported consolidated net sales of ¥14,306 million for the fiscal year ended March 31, 2026, marking a 22.5% decrease year-on-year.
- The company posted an operating loss of ¥440 million (compared to an operating profit of ¥235 million in the prior year) and an ordinary loss of ¥301 million (compared to an ordinary profit of ¥360 million in the prior year).
- A net loss attributable to owners of parent of ¥535 million was recorded (compared to a net profit of ¥343 million in the prior year), resulting in a basic earnings per share of -¥92.47.
- For the fiscal year ending March 31, 2027, the company forecasts net sales of ¥14,500 million (a 1.4% increase YoY), operating profit of ¥220 million, ordinary profit of ¥320 million, and net profit of ¥220 million.
- The annual dividend per share for FY2026 was ¥50.00 (year-end: ¥25.00), and the forecast for FY2027 is also ¥50.00 (interim: ¥25.00, year-end: ¥25.00).
🤖 AI Perspective
The FY2026 results show a significant downturn across all key financial metrics, with the company falling into a net loss, which could be a key point of interest for investors. This appears to be primarily driven by a challenging order environment in both the bridge and steel structure segments. However, the positive profit forecast for FY2027 suggests an expected recovery, and the strategies to achieve this turnaround may be worth monitoring.
7270|SUBARU
2580.5
▲ +7.43%
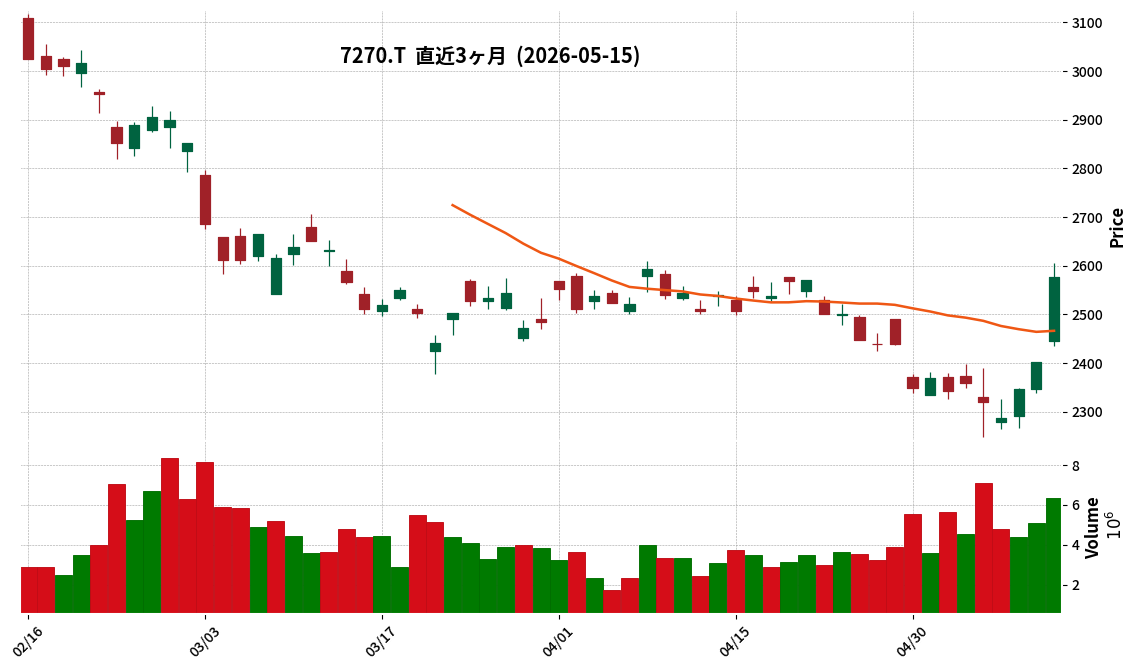
This article is an AI-generated summary and analysis of official IR disclosures.
📄 Announcement (AI-Reviewed)
- SUBARU has released its Consolidated Financial Results for the fiscal year ending March 2026 (IFRS).
- The announcement includes consolidated financial statements prepared in accordance with International Financial Reporting Standards (IFRS).
- This financial report was submitted to the Tokyo Stock Exchange.
🤖 AI Perspective
This announcement provides foundational information for investors to assess SUBARU’s future financial health. The use of IFRS standards may enhance the comparability of the company’s financial performance internationally. The early release of the financial report for the fiscal year ending March 2026 could indicate the company’s commitment to transparency regarding its future outlook.
7327|第四北越FG
2000.0
▼ -0.55%
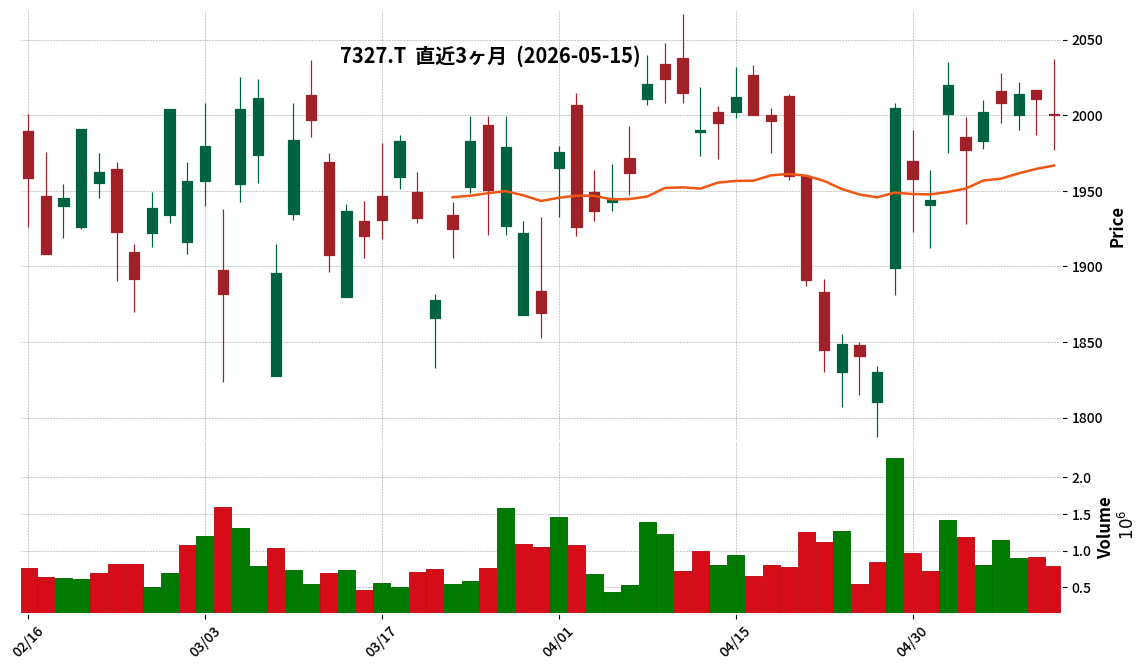
This article is an AI-generated summary and analysis of official IR disclosures.
📄 Announcement (AI-Reviewed)
- Fourth Hokuetsu Financial Group has announced its consolidated financial results for the fiscal year ended March 31, 2026.
- Consolidated ordinary revenue reached ¥260,253 million, marking a 33.7% increase year-over-year.
- Consolidated ordinary profit was ¥61,115 million, a 48.6% increase compared to the previous fiscal year.
- Profit attributable to owners of parent increased by 43.4% year-over-year, totaling ¥42,103 million.
- For the fiscal year ending March 31, 2027, the company forecasts consolidated ordinary profit of ¥73,600 million (+20.4% YoY) and profit attributable to owners of parent of ¥50,000 million (+18.7% YoY).
🤖 AI Perspective
Fourth Hokuetsu FG’s FY2026/3 consolidated results show substantial double-digit growth across key revenue and profit metrics compared to the previous year. The significant increases in ordinary profit and net profit suggest a robust underlying business performance. Furthermore, the positive outlook for FY2027/3, projecting continued profit growth, may indicate management’s confidence in the company’s ongoing operational momentum.
7369|G-メイホーHD
520.0
▲ +4.00%
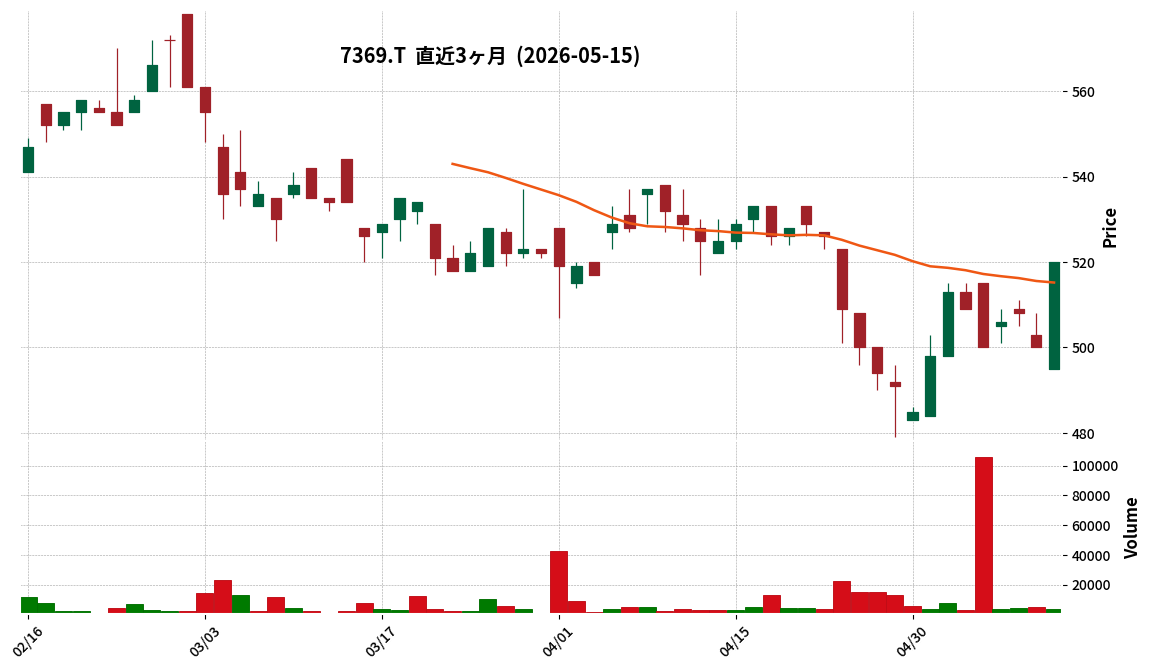
📎 Source:G-メイホーHD Official IR →
This article is an AI-generated summary and analysis of official IR disclosures.
📄 Announcement (AI-Reviewed)
- For the cumulative third quarter of the fiscal year ending June 2026, consolidated net sales were ¥9,923 million (down 2.2% year-on-year).
- Operating income for the same period was ¥460 million (down 27.1% year-on-year), ordinary income was ¥473 million (down 22.7%), and net income attributable to owners of parent was ¥245 million (down 19.0%).
- EBITDA for the period was ¥883 million (down 14.8% year-on-year).
- During this cumulative quarter, three new companies—Mirai Seisaku Kenkyusho Co., Ltd., Amano Kensetsu Co., Ltd., and Emorisu Link Co., Ltd.—were added to the scope of consolidation.
- The full-year consolidated performance forecast for the fiscal year ending June 2026 remains unchanged from the most recently announced figures: net sales of ¥13,500 million, operating income of ¥540 million, ordinary income of ¥530 million, and net income attributable to owners of parent of ¥200 million.
🤖 AI Perspective
G-MEIHO HD’s Q3 FY2026 results show a year-on-year decline in both net sales and various profit metrics. This is primarily attributed to a decrease in gross profit due to reduced sales in the construction business. The addition of three new companies to the consolidated scope is consistent with the company’s mid-term management plan “M30BD,” which focuses on “promoting employee succession M&A” and “providing corporate support platforms,” making their integration and future contributions a key area for investors to monitor.
7376|G-BCC
1220.0
▲ +8.73%
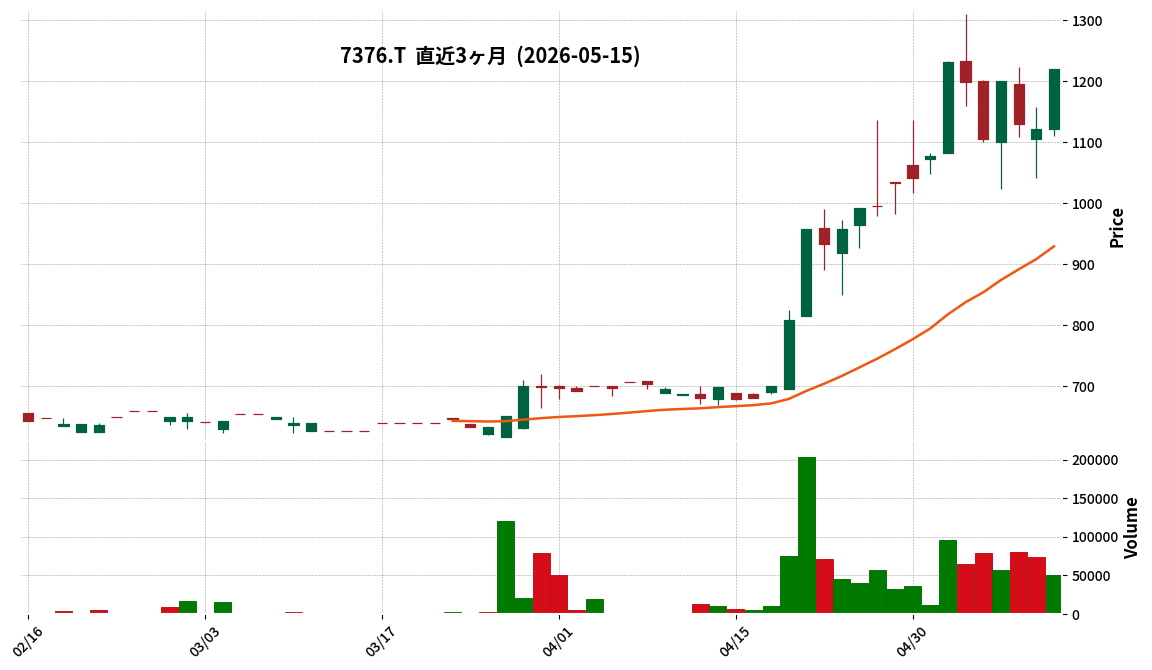
This article is an AI-generated summary and analysis of official IR disclosures.
📄 Announcement (AI-Reviewed)
- G-BCC has announced its consolidated financial results for the second quarter (interim period) of the fiscal year ending September 2026.
- For this interim period, consolidated net sales were JPY 923 million, operating loss was JPY 81 million, ordinary loss was JPY 90 million, and net loss attributable to owners of the parent was JPY 90 million.
- Basic earnings per share (interim net loss) was △23.52 yen.
- Total assets stood at JPY 1,566 million, net assets at JPY 1,067 million, with an equity ratio of 68.1%.
- Significant changes in the scope of consolidation include the addition of Good Digital Co., Ltd. and Robotusnet Co., Ltd. as new consolidated subsidiaries.
- The full-year consolidated performance forecast remains unchanged, projecting net sales of JPY 1,850 million, operating loss of JPY 194 million, ordinary loss of JPY 185 million, and net loss attributable to owners of the parent of JPY 135 million.
🤖 AI Perspective
This interim period marks the first time consolidated financial statements have been prepared, thus comparative data for the prior year is not available. The impact and contribution of the newly consolidated subsidiaries on future performance, as well as the progress of the IT sales outsourcing and healthcare business segments toward achieving the full-year forecast, are points worth monitoring.
8362|福井銀
4545.0
▲ +7.45%
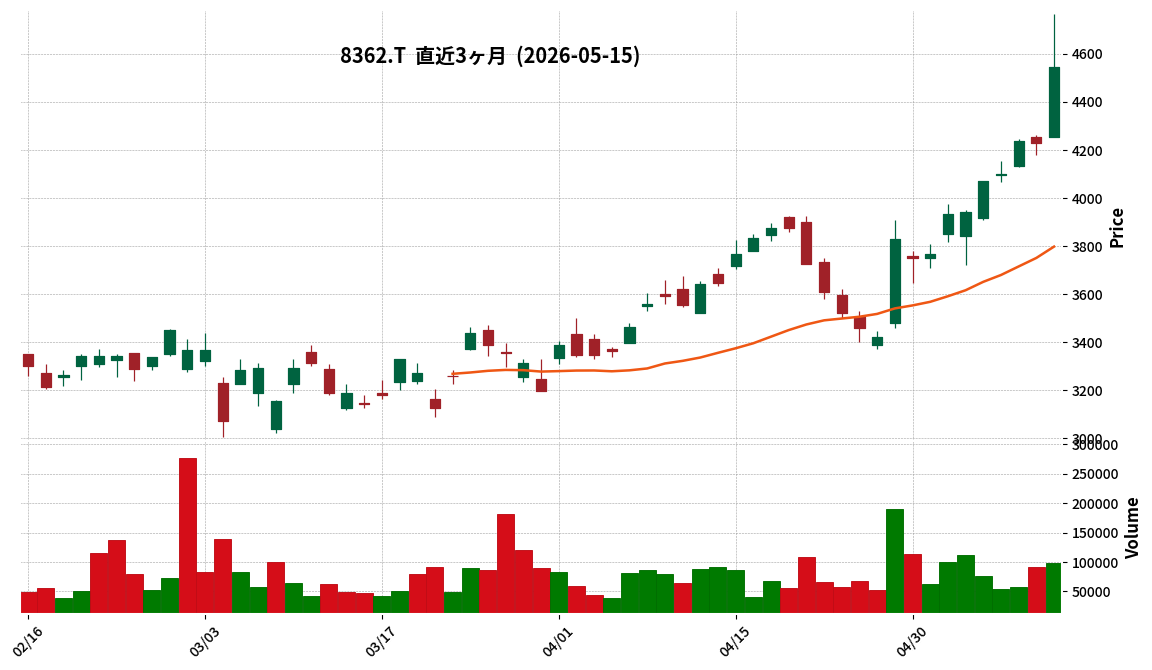
This article is an AI-generated summary and analysis of official IR disclosures.
📄 Announcement (AI-Reviewed)
- Fukuibank Co., Ltd. announced its consolidated financial results for the fiscal year ended March 31, 2026.
- Consolidated ordinary revenue was ¥79,101 million, marking a 22.8% increase compared to the previous fiscal year.
- Consolidated ordinary profit amounted to ¥13,434 million, an increase of 54.3% year-on-year.
- Profit attributable to owners of parent reached ¥8,601 million, representing a 20.0% increase from the prior year.
- The annual dividend per share is ¥108.00 (compared to ¥58.00 in the previous year), with the dividend payment scheduled to commence on June 5, 2026.
- For the fiscal year ending March 31, 2027 (forecast), the company projects consolidated ordinary profit of ¥10,200 million (down 24.0% year-on-year) and profit attributable to owners of parent of ¥9,000 million (up 4.6% year-on-year).
🤖 AI Perspective
Fukuibank’s FY2026/3 results demonstrate substantial growth in both ordinary revenue and net profit, with ordinary profit showing a notable 54.3% increase. However, the forecast for FY2027/3 indicates a projected decrease in ordinary profit, which may draw investor attention to the underlying factors for this expectation. This shift in profitability outlook could be a key area for investors to monitor in the coming fiscal year.
9212|G-GEI
351.0
▼ -1.96%
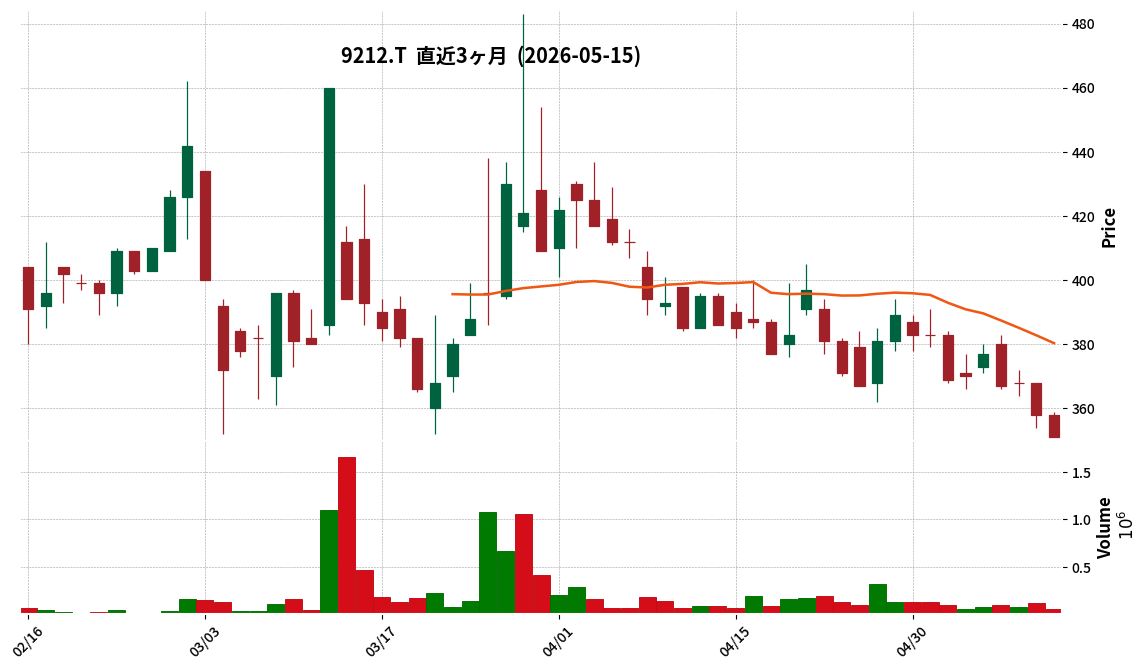
This article is an AI-generated summary and analysis of official IR disclosures.
📄 Announcement (AI-Reviewed)
- Green Earth Institute Co., Ltd. (G-GEI, Code: 9212) announced its unaudited financial results for the second quarter (interim period) of the fiscal year ending September 2026.
- For the interim period of FY2026, net sales reached ¥240 million, representing a 0.1% increase compared to the previous interim period.
- The company reported an operating loss of ¥186 million, an ordinary loss of ¥190 million, and a net loss attributable to owners of parent of ¥192 million for the interim period.
- As of the end of the second quarter of FY2026, the equity ratio stood at 59.7%, a decrease from 71.0% at the end of the previous fiscal year.
- Interim net loss per share was ¥-16.93. The full-year dividend forecast remains unchanged at ¥0.00 per share.
- The full-year earnings forecast for FY2026 is maintained with projected net sales of ¥1,035 million (a 3.7% decrease YoY) and a net profit of ¥146 million (a 15.3% increase YoY).
🤖 AI Perspective
G-GEI’s Q2 FY2026 results show a marginal increase in sales but continued losses. The company has noted that its revenue generation is heavily weighted towards the fourth quarter due to the nature of its government-contracted projects, which is a factor for investors to consider when evaluating interim performance. While the equity ratio has declined from the previous year-end, maintaining a level of 59.7% suggests a degree of financial stability that may be worth monitoring in subsequent quarters.
9663|ナガワ
5340.0
▼ -0.37%
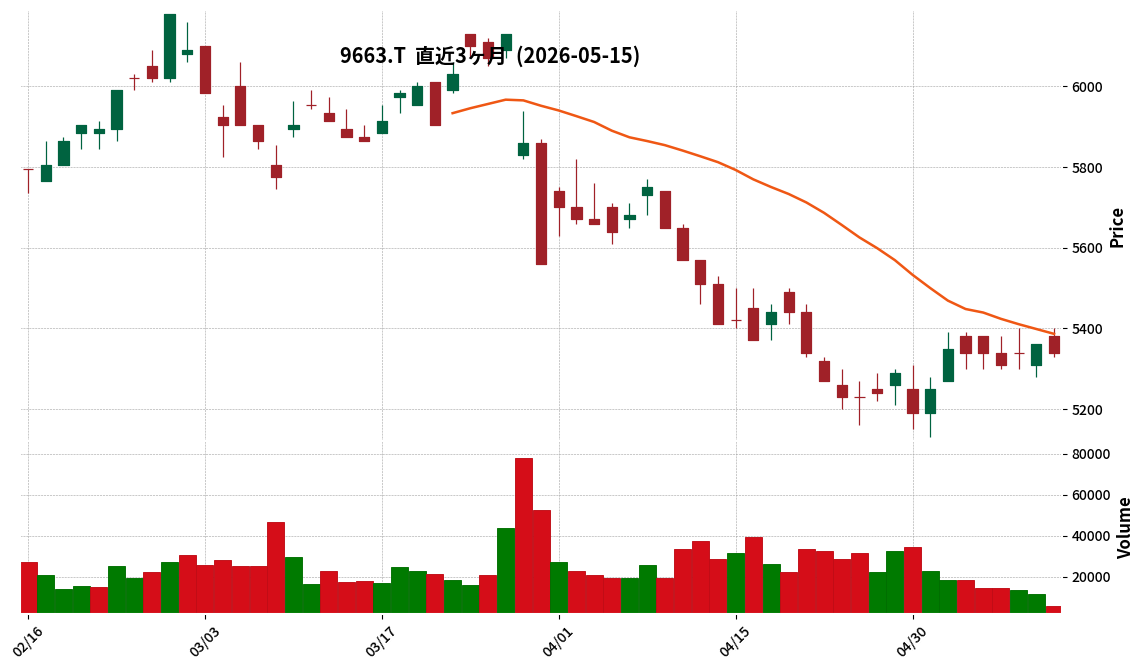
This article is an AI-generated summary and analysis of official IR disclosures.
📄 Announcement (AI-Reviewed)
- Nagawa Co., Ltd. announced its non-consolidated financial results for the fiscal year ended March 31, 2026 (April 1, 2025 – March 31, 2026).
- Net sales were ¥35,385 million (up 0.3% from the previous year), operating income was ¥4,380 million (up 1.9%), ordinary income was ¥5,002 million (up 4.1%), and net income was ¥4,436 million (up 5.3%).
- Diluted earnings per share (EPS) for the period was ¥284.11 (compared to ¥268.32 in the previous period).
- A year-end dividend of ¥100 per share was distributed, comprising a regular dividend of ¥60 and a ¥40 commemorative dividend for the 60th anniversary of the company’s founding (compared to ¥60 in the previous period).
- For the fiscal year ending March 31, 2027, the company forecasts net sales of ¥38,000 million (up 7.4% year-on-year), operating income of ¥4,500 million (up 2.7%), ordinary income of ¥5,100 million (up 1.9%), and net income of ¥3,300 million (down 25.6%).
🤖 AI Perspective
Nagawa’s fiscal year 2026 results indicate a solid performance with increases across all key profitability metrics, including a 5.3% rise in net income. The significant increase in the year-end dividend, including a special commemorative dividend, may reflect a strong commitment to shareholder returns. However, the forecast for a 25.6% decline in net income for fiscal year 2027 could warrant investor attention, suggesting that future market conditions or specific business strategies will be worth monitoring.
3710|ジョルダン
626.0
▲ +5.03%
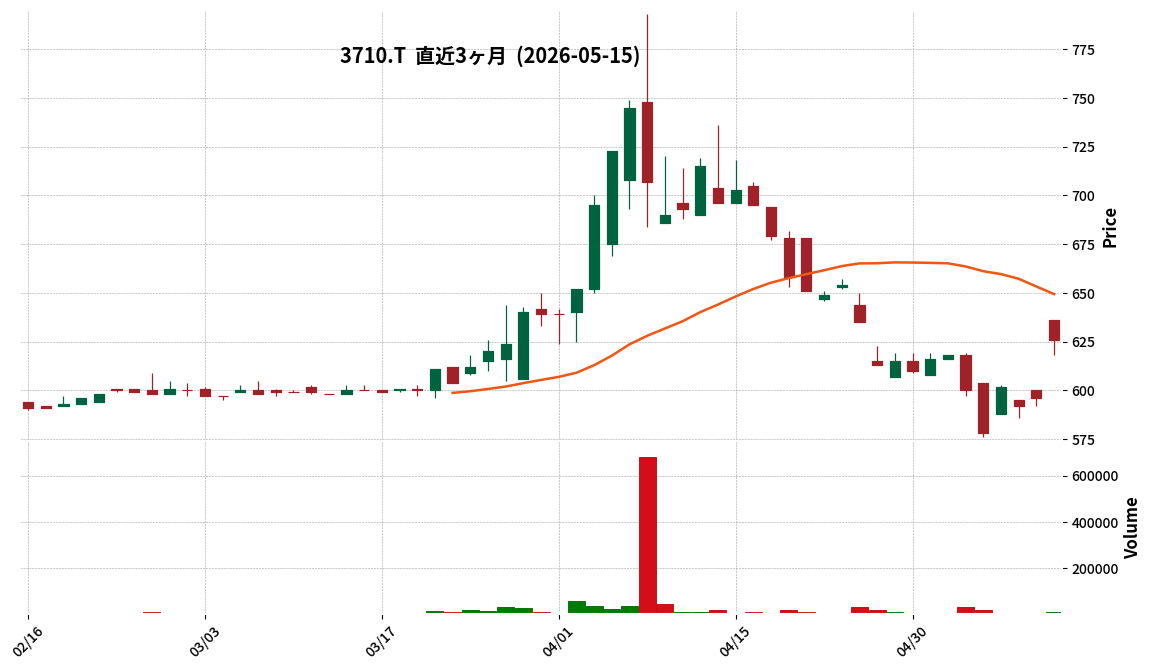
This article is an AI-generated summary and analysis of official IR disclosures.
📄 Announcement (AI-Reviewed)
- Jorudan Co.,Ltd. announced its financial results for the second quarter (interim) of the fiscal year ending September 2026.
- Revenue for the period was ¥1,651 million, representing an 11.4% increase year-over-year.
- Operating profit reached ¥87 million, a 61.3% increase compared to the previous year.
- Net income attributable to owners of parent was ¥259 million, marking a 94.1% increase year-over-year.
- The “Norikae Annai” service had 100,000 paid subscribers and 240 million monthly searches as of March 2026, with enhanced features including seat location/exit information updates and reservation links with JR Tokai, JR East, JR West, and Odakyu.
- The mobile ticketing business processed ¥32 million in transactions in August 2025, expanded services to 104 operators (as of March 2026), and implemented gate integrations with Yui Rail and Yurikamome, as well as facial recognition boarding systems for Yamaman Yukarigaoka and Okinawa’s Nakagusuku Community Bus.
- The corporate business segment achieved a record-high revenue of ¥858 million for the current second quarter.
🤖 AI Perspective
Jorudan’s Q2 FY2026 results show significant year-over-year growth in revenue, operating profit, and interim net income, suggesting an acceleration in business expansion. The enhanced functionality of the core “Norikae Annai” application, the increased number of operators in the mobile ticketing business, and record-high corporate segment revenue are noteworthy as they strengthen the company’s future earnings base. The diverse business developments, including AI demand transport, smart city mode expansion, API provision to overseas OTAs, and the sale of insurance-linked products, are important aspects for evaluating Jorudan’s strategic direction.
565A|P-FFFHD
961.0
▲ +0.00%
📎 Source:P-FFFHD Official IR →
This article is an AI-generated summary and analysis of official IR disclosures.
📄 Announcement (AI-Reviewed)
- P-FFFHD announced its interim financial results for the fiscal year ending September 2026 (October 1, 2025 – March 31, 2026).
- Consolidated results show net sales of ¥7,210 million (down 3.1% YoY), operating profit of ¥64 million (down 62.0% YoY), ordinary profit of ¥109 million (down 41.9% YoY), and net profit attributable to parent company shareholders of ¥80 million (down 30.4% YoY).
- By segment, the Housing Equipment Business reported sales of ¥6,696 million (down 2.7% YoY) and segment profit of ¥275 million (down 4.9% YoY). The Renovation and Construction Business reported sales of ¥464 million (down 8.8% YoY).
- The consolidated full-year forecast for FY2026 remains unchanged, with projected net sales of ¥14,371 million, operating profit of ¥21 million, ordinary profit of ¥68 million, and net profit attributable to parent company shareholders of ¥53 million.
- The annual dividend forecast is ¥3.75 for the interim and ¥3.75 for the year-end, totaling ¥7.50, with no changes from the latest publicly announced forecast.
🤖 AI Perspective
While the interim results show a decrease in both revenue and profit, the company’s decision to maintain its full-year forecast may suggest an expectation for recovery in the latter half of the fiscal year. Investors might focus on how the company’s cost reduction efforts and strengthening of sales bases will contribute to performance given the challenging housing market. Furthermore, initiatives such as integrating AI for operational optimization and enhancing customer satisfaction could be key factors to monitor for potential improvements in profitability.
8066|三谷商
2755.0
▲ +0.04%
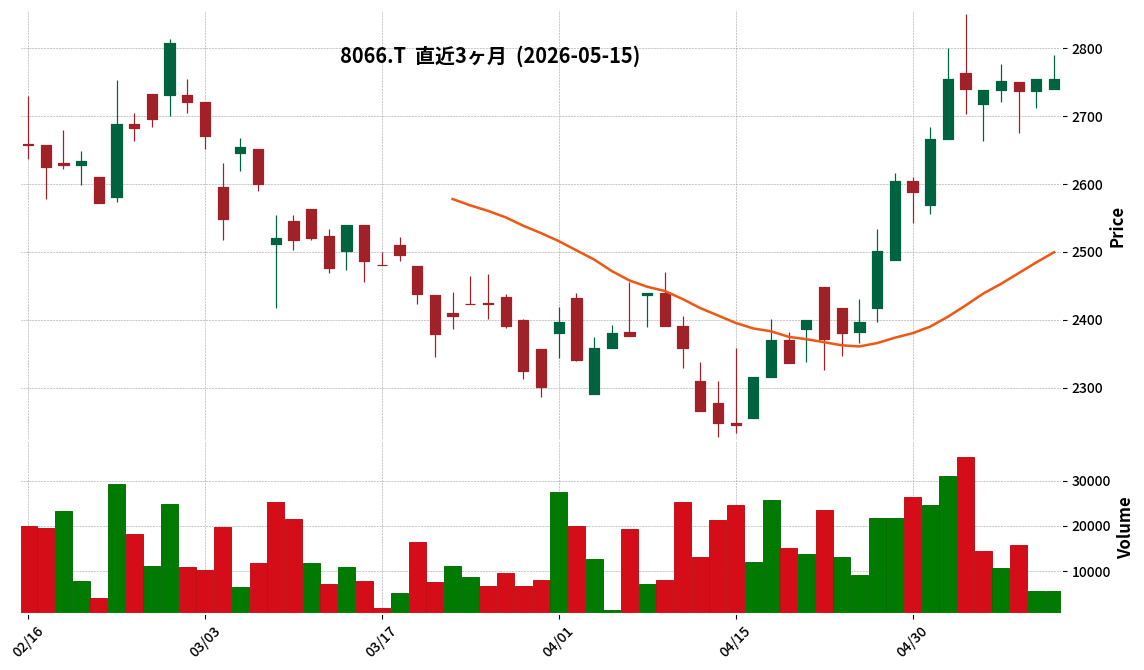
This article is an AI-generated summary and analysis of official IR disclosures.
📄 Announcement (AI-Reviewed)
- Mitani Corporation announced its consolidated financial results for the fiscal year ended March 31, 2026 (April 1, 2025 – March 31, 2026).
- Consolidated net sales were ¥339,031 million (up 0.0% year-on-year), operating profit was ¥32,387 million (up 2.8%), and ordinary profit was ¥36,634 million (up 9.0%).
- Net profit attributable to owners of the parent company reached ¥23,453 million, representing a 23.3% increase from the previous fiscal year.
- Earnings per share were ¥280.45 (an increase of ¥57.91 from the previous fiscal year).
- The annual dividend, including the year-end dividend of ¥53.00, totaled ¥97.00 (an increase of ¥31.00 from the previous fiscal year).
- For the fiscal year ending March 31, 2027 (April 1, 2026 – March 31, 2027), the company forecasts consolidated net sales of ¥330,000 million (down 2.7% year-on-year) and net profit attributable to owners of the parent company of ¥21,220 million (down 9.5% year-on-year).
🤖 AI Perspective
Mitani Corp.’s FY2026 results show a significant 23.3% increase in net profit attributable to owners of the parent, driven by specific demand factors in the information systems sector, such as the GIGA School refresh cycle and Windows 10 end-of-support PC replacements, along with progress in price pass-throughs. However, the company’s FY2027 forecast projects a decline in both revenue and profit, which may reflect the absence of these one-off demand drivers or changes in market conditions. Investors may wish to monitor how the company navigates the post-special demand period.
546A|MIRAINI
2008.0
▲ +0.20%
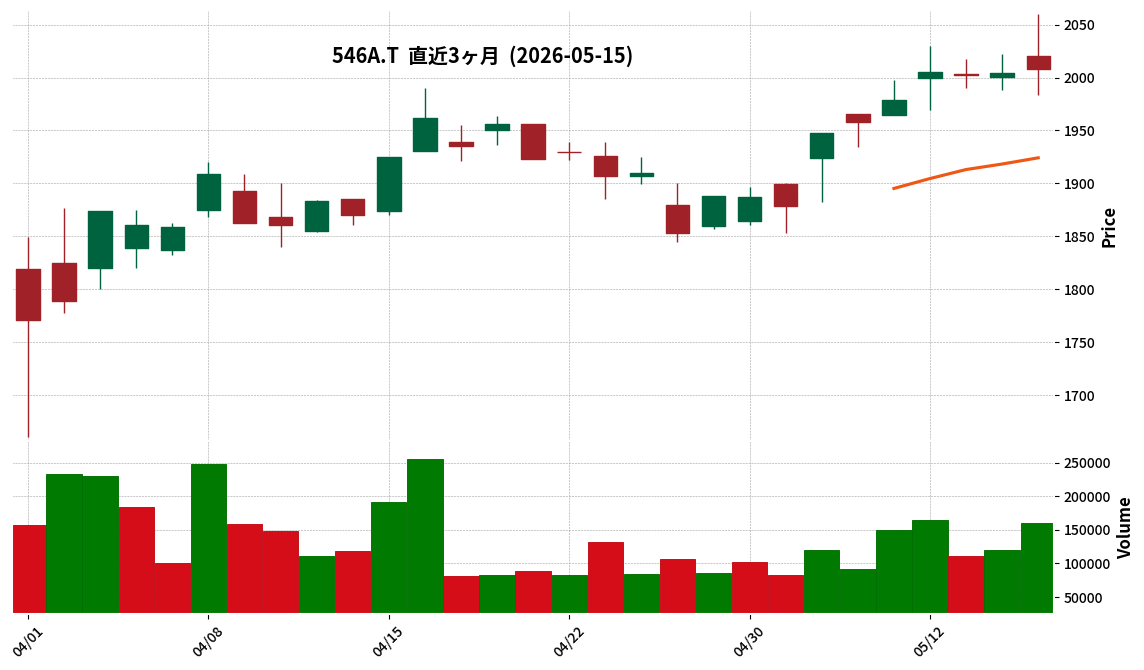
📎 Source:MIRAINI Official IR →
This article is an AI-generated summary and analysis of official IR disclosures.
📄 Announcement (AI-Reviewed)
- Consolidated net sales for the fiscal year ended March 2026 totaled ¥271,918 million, representing a 5.1% increase year-on-year.
- Operating profit for the same period was ¥6,269 million (down 11.9% year-on-year), and ordinary profit was ¥5,647 million (down 9.1% year-on-year).
- Net profit attributable to owners of the parent significantly decreased by 59.1% year-on-year to ¥1,514 million.
- An impairment loss of ¥2.1 billion for goodwill, arising from a corporate acquisition, was recorded as an extraordinary loss.
- Sales in the Device Business were ¥237,632 million (up 5.0% year-on-year), and in the Solution Business were ¥34,286 million (up 5.7% year-on-year).
🤖 AI Perspective
MIRAINI Holdings achieved increased revenue in the fiscal year ended March 2026, yet operating and net profits declined. The significant decrease in net profit attributable to owners of the parent appears primarily driven by the ¥2.1 billion goodwill impairment loss. This factor may be relevant for investors evaluating the company’s past acquisition strategies and asset valuations.
3277|サンセイランディック
1318.0
▲ +0.00%
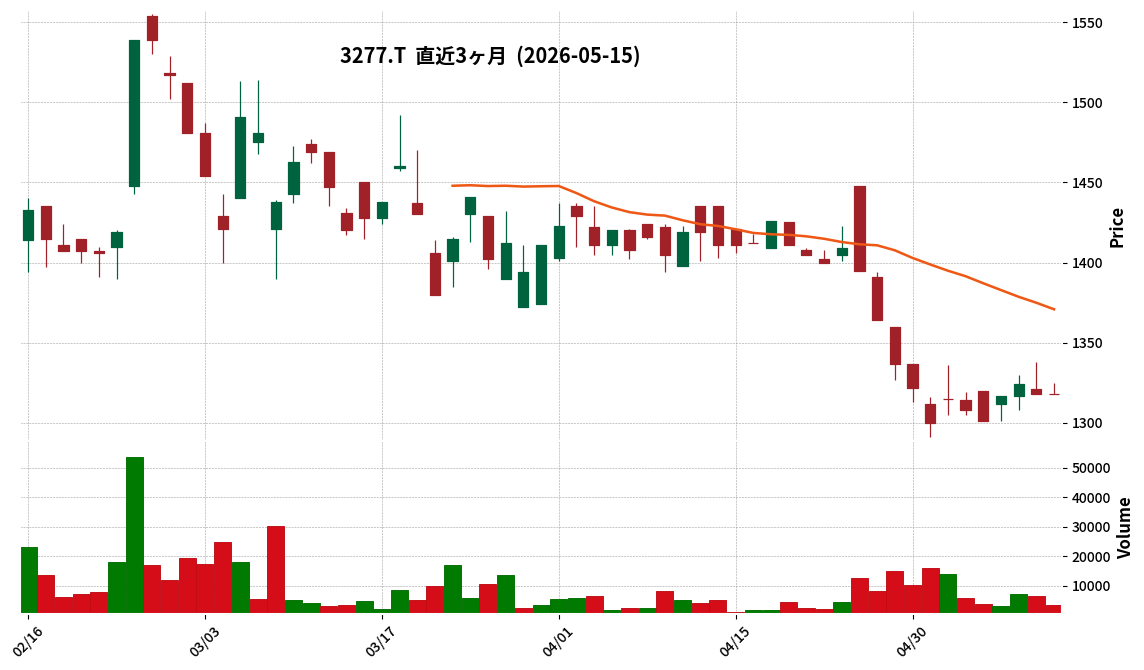
📎 Source:サンセイランディック Official IR →
This article is an AI-generated summary and analysis of official IR disclosures.
📄 Announcement (AI-Reviewed)
- Sansei Landic’s consolidated results for the first quarter of the fiscal year ending December 2026 (January 1, 2026 to March 31, 2026) showed net sales of ¥9,606 million (up 8.6% year-on-year), operating profit of ¥2,040 million (up 13.0%), ordinary profit of ¥1,894 million (up 9.6%), and net profit attributable to parent company shareholders of ¥1,317 million (up 12.1%).
- Sales performance increased across all categories (land with tenancy rights, properties with tenants, freehold, and other real estate sales businesses), with total net sales of ¥9,606 million (up 8.6%) from 144 contracts (up 28.6%).
- Acquisition performance saw an increase in land with tenancy rights and properties with tenants, resulting in total acquisition value of ¥7,724 million (up 173.6%) for 235 parcels (up 55.6%).
- A stock split at a ratio of two shares for every one common share is scheduled to take effect on July 1, 2026. Consequently, the estimated year-end dividend per share for FY2026 (forecast) is ¥15, considering the stock split, with the total annual dividend indicated as “—”. Without considering the stock split, the year-end dividend would be ¥30 and the total annual dividend ¥51.
- The full-year consolidated earnings forecast for FY2026 remains unchanged from the most recently published forecast, with net sales of ¥25,500 million (up 9.2% year-on-year), operating profit of ¥2,400 million (up 6.8%), ordinary profit of ¥1,900 million (up 2.6%), and net profit attributable to parent company shareholders of ¥1,330 million (up 2.7%).
🤖 AI Perspective
Sansei Landic’s first quarter for fiscal year 2026 demonstrated robust performance, marked by increased revenue and profits, primarily driven by strong sales in land with tenancy rights and properties with tenants. The substantial growth in both sales and acquisitions suggests a strengthening foundation for future business expansion. The planned stock split could also potentially enhance liquidity and broaden the investor base by making shares more accessible.
3299|ムゲンエステート
2170.0
▼ -0.73%
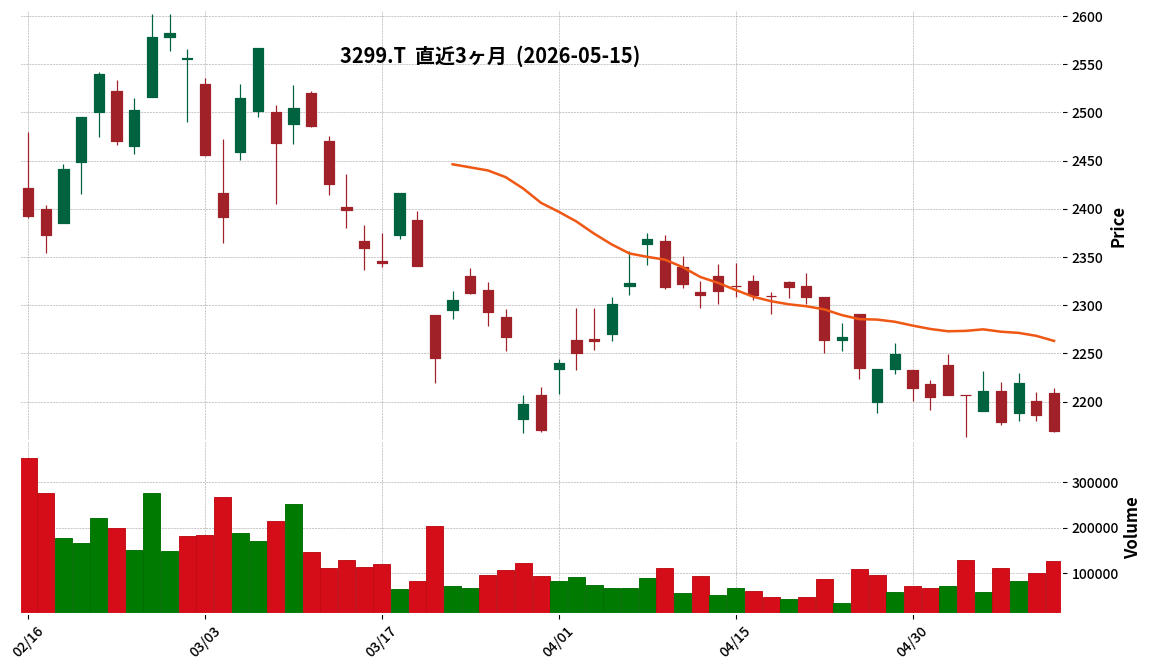
📎 Source:ムゲンエステート Official IR →
This article is an AI-generated summary and analysis of official IR disclosures.
📄 Announcement (AI-Reviewed)
- Mugen Estate announced its consolidated financial results for the first quarter of the fiscal year ending December 2026 (January 1, 2026 – March 31, 2026).
- Consolidated net sales were ¥12,523 million (down 27.0% year-on-year), operating profit was ¥1,014 million (down 66.0% year-on-year), ordinary profit was ¥731 million (down 72.5% year-on-year), and net income attributable to owners of parent was ¥440 million (down 75.5% year-on-year).
- Total assets stood at ¥108,443 million (up 1.6% from the end of the previous fiscal year), and net assets were ¥34,617 million (down 3.3% from the end of the previous fiscal year).
- The full-year consolidated earnings forecast remains unchanged: net sales of ¥79,286 million, operating profit of ¥12,398 million, ordinary profit of ¥11,058 million, and net income attributable to owners of parent of ¥7,595 million.
- The dividend forecast also remains unchanged, with a year-end dividend of ¥78.00 and a total annual dividend of ¥130.00.
🤖 AI Perspective
While the first quarter saw significant year-on-year declines in key profit metrics, reportedly due to softening demand from overseas investors and sluggish sales of large properties, an increase in investment property sales revenue, despite fewer transactions, was driven by a substantial rise in average selling prices. The rental and other businesses also achieved increased sales and profits, suggesting a potential diversification or resilience within the company’s segments. The unchanged full-year forecast indicates that management may anticipate a recovery in subsequent quarters.
3683|サイバーリンクス
986.0
▲ +0.41%
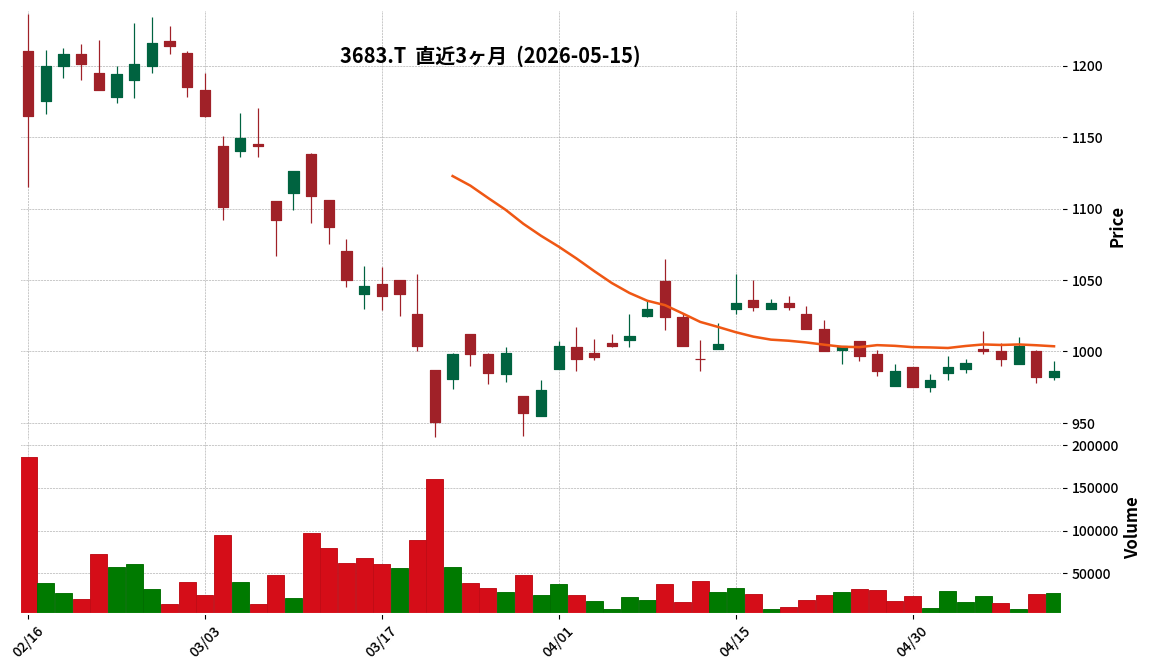
📎 Source:サイバーリンクス Official IR →
This article is an AI-generated summary and analysis of official IR disclosures.
📄 Announcement (AI-Reviewed)
- Cyberlinks announced its consolidated financial results for the first quarter of the fiscal year ending December 2026 (January 1, 2026, to March 31, 2026).
- Consolidated net sales reached ¥5,440 million, marking a 20.9% increase year-over-year.
- Consolidated operating profit was ¥834 million, a 101.3% increase from the same period last year.
- Net profit attributable to owners of the parent company amounted to ¥573 million, an increase of 111.4% year-over-year.
- Recurring revenue, a key management indicator, stood at ¥2,297 million, up 8.5% from the previous year.
- The Distribution Cloud segment achieved sales of ¥1,368 million (an 11.7% increase year-over-year) but experienced a slight decrease in profit due to higher labor costs and software amortization expenses.
- The full-year consolidated earnings forecast for FY2026 remains unchanged, projecting net sales of ¥19,238 million, operating profit of ¥1,909 million, and net profit attributable to owners of the parent company of ¥1,308 million.
🤖 AI Perspective
Cyberlinks’ Q1 results demonstrate substantial year-over-year growth in both sales and profits, with operating profit more than doubling. This performance may suggest the positive impact of expanded service offerings and new order acquisitions across its core business segments. However, the slight decrease in profit within the Distribution Cloud segment could indicate increased operational costs related to staffing and development investments.
3861|王子HD
846.5
▲ +0.56%
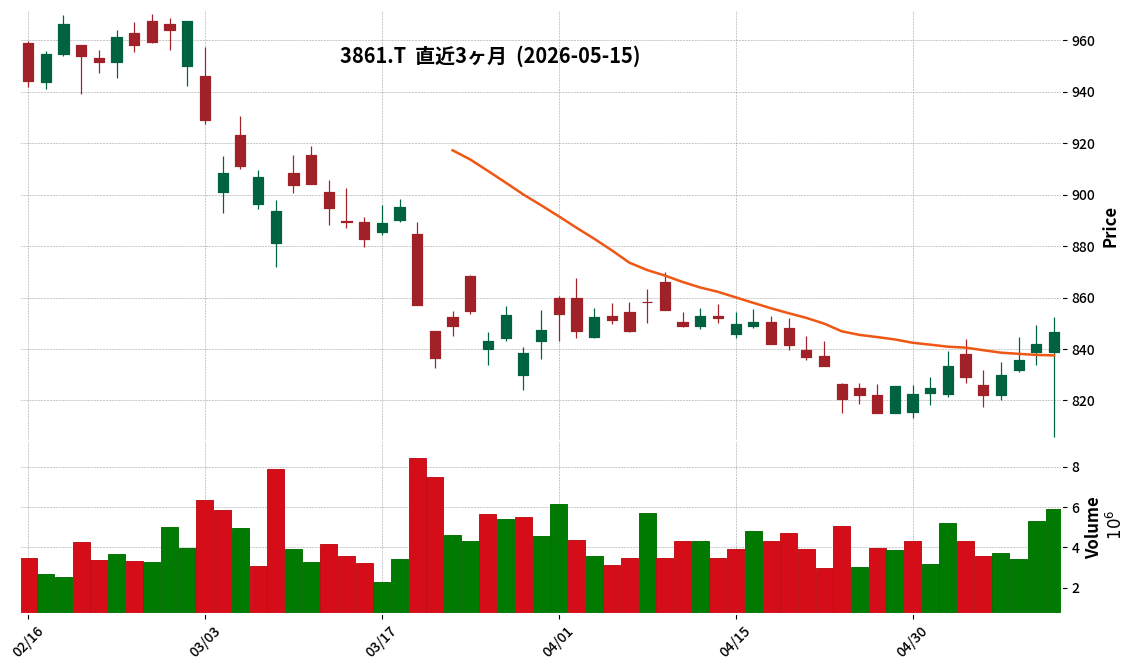
This article is an AI-generated summary and analysis of official IR disclosures.
📄 Announcement (AI-Reviewed)
- Oji Holdings reported consolidated operating profit of ¥34.6 billion for FY2025 (April 1, 2025 – March 31, 2026), marking a decrease of ¥33.1 billion from the previous fiscal year.
- Net profit attributable to owners of parent for the same period was ¥55.6 billion, an increase of ¥9.4 billion year-on-year.
- The decline in operating profit was attributed to the deterioration of overseas pulp and paper markets, reduced sales in Japan, and increased costs such as logistics and personnel expenses.
- The increase in net profit was due to higher foreign exchange gains from the revaluation of foreign currency-denominated receivables and payables in non-operating income/expenses, and increased gains from the sale of investment properties and marketable securities in extraordinary gains/losses.
- For FY2026 (April 1, 2026 – March 31, 2027), the company forecasts consolidated operating profit of ¥60.0 billion (an increase of ¥25.4 billion year-on-year) and net profit of ¥35.0 billion (a decrease of ¥20.6 billion year-on-year).
- The projected increase in FY2026 operating profit is based on the recovery of the pulp market, particularly LBKP, the full-year effect of price increases implemented in FY2025, and structural reforms in low-profitability businesses.
🤖 AI Perspective
The FY2025 results for Oji Holdings indicate that while core business segments faced challenges from market deterioration, strategic financial management, including foreign exchange gains and asset sales, significantly bolstered net profit. This highlights the importance of diversified income sources and proactive asset management in volatile market conditions. The FY2026 outlook suggests a potential rebound in operating profit driven by market recovery and structural reforms, but external geopolitical risks, such as those related to the Middle East, are also factored in, indicating a focus on enhancing business resilience.
4990|昭和化
510.0
▼ -2.86%
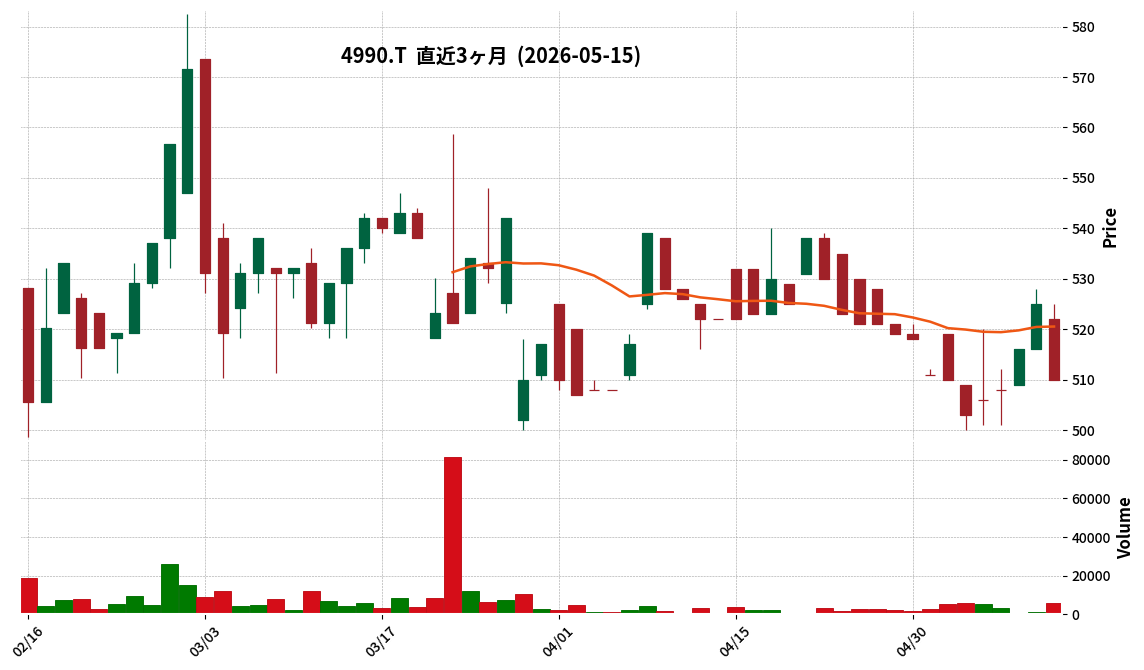
This article is an AI-generated summary and analysis of official IR disclosures.
📄 Announcement (AI-Reviewed)
- Showa Chemical Industry Co., Ltd. reported consolidated net sales of ¥9,272 million for the fiscal year ended March 2026, a 0.4% increase from the previous year.
- Operating profit reached ¥446 million (up 29.0% year-on-year), and ordinary profit was ¥801 million (up 40.3% year-on-year).
- Net profit attributable to owners of the parent company amounted to ¥624 million, marking a significant increase of 51.7% from the prior fiscal year.
- Earnings per share (EPS) for the period were ¥58.67, and the annual dividend per share was increased to ¥10.00.
- For the fiscal year ending March 2027, the company forecasts consolidated net sales of ¥9,400 million (up 1.4%) and operating profit of ¥200 million (down 55.2%).
🤖 AI Perspective
Showa Chemical Industry’s FY2026 results show a significant increase in profitability despite only a marginal rise in sales, with the 51.7% growth in net profit attributable to the parent company being a key highlight. This improvement appears to be driven by an increase in “equity in earnings of affiliates,” higher “gain on sales of investment securities,” and a reduction in “extraordinary losses,” which could suggest an enhanced earnings structure. However, the FY2027 outlook projects a substantial decrease in operating profit despite a sales increase, with the uncertainty surrounding the earnings forecast of an equity-method affiliate being a factor for investors to monitor.
5101|浜ゴム
6349.0
▼ -1.93%
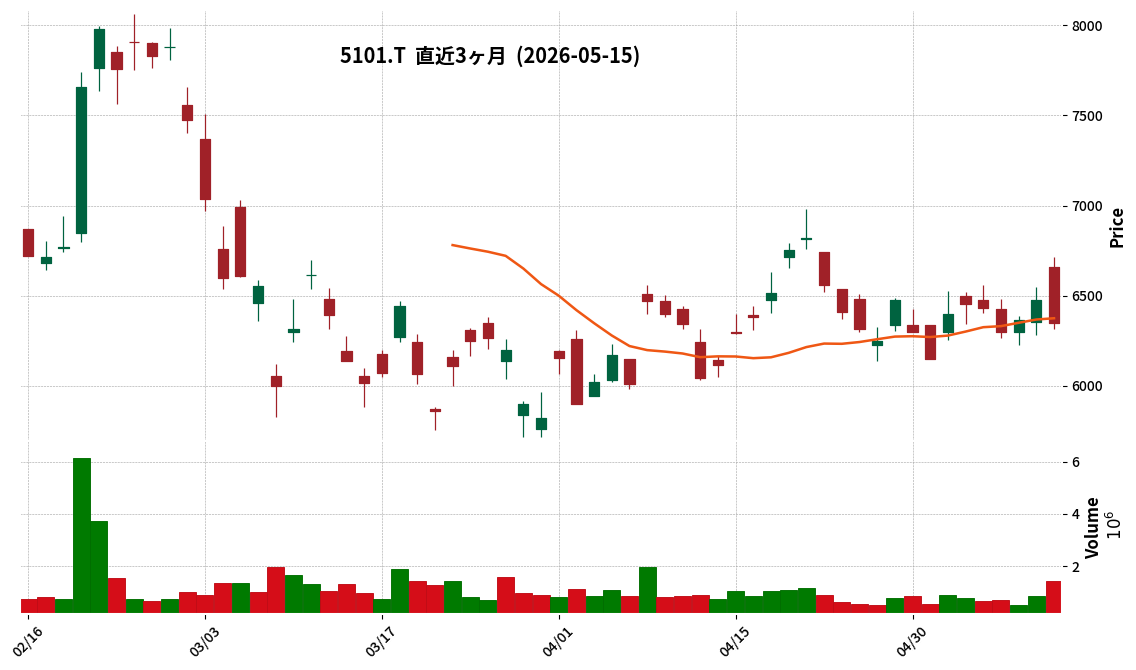
This article is an AI-generated summary and analysis of official IR disclosures.
📄 Announcement (AI-Reviewed)
- Yokohama Rubber Co., Ltd. announced its consolidated financial results for the first quarter of the fiscal year ending December 2026 (January 1, 2026 – March 31, 2026).
- Consolidated net sales revenue increased by 10.4% year-on-year to ¥303,806 million.
- Consolidated business profit surged by 84.6% year-on-year to ¥44,439 million.
- Consolidated operating profit increased by 34.5% year-on-year to ¥26,007 million, even after recording a one-time expense of ¥13,000 million related to the closure of the Salem plant in the U.S.
- Quarterly profit attributable to owners of the parent increased by 72.6% year-on-year to ¥14,717 million.
- The consolidated financial forecasts for both the second quarter (cumulative) and the full fiscal year ending December 2026 have been revised.
- The Tire segment’s net sales revenue was ¥278,118 million (up 11.1% year-on-year), accounting for 91.5% of the consolidated net sales revenue.
- The MB (Multiple Business) segment’s net sales revenue was ¥23,985 million (up 4.2% year-on-year).
🤖 AI Perspective
Yokohama Rubber’s Q1 FY2026 results show a significant year-over-year increase in both revenue and various profit indicators, reflecting strong performance across all business segments. The remarkable 84.6% surge in business profit may be attributed to increased sales of high-value-added products, higher sales volumes, improved profitability in existing businesses, and cost-reduction efforts. Furthermore, the revision of full-year earnings forecasts could suggest management’s confidence in future business activities.
5966|京都機械工具
2421.0
▲ +0.00%
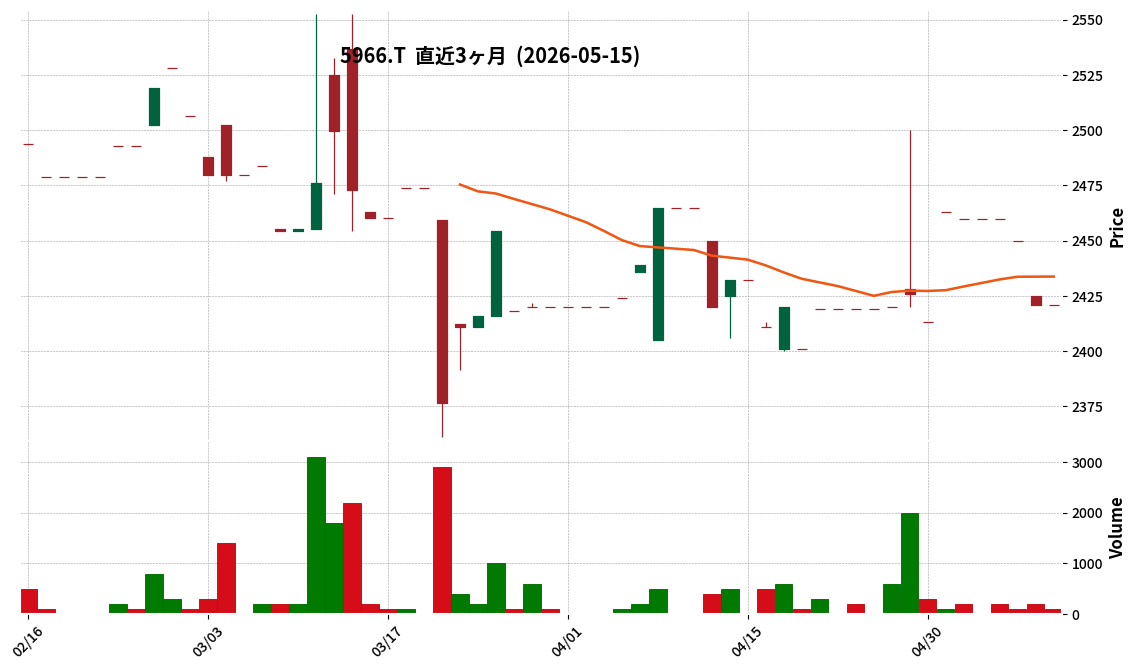
This article is an AI-generated summary and analysis of official IR disclosures.
📄 Announcement (AI-Reviewed)
- Kyoto Tool Co., Ltd. (KTC) announced its consolidated financial results for the fiscal year ended March 2026.
- Net sales were ¥8,334 million, a 7.9% decrease year-on-year (YoY). Operating income was ¥753 million (down 11.1% YoY), ordinary income ¥817 million (down 13.4% YoY), and net income attributable to owners of parent was ¥501 million (down 7.9% YoY).
- The annual dividend for the fiscal year ended March 2026 was set at ¥85.00 per share (compared to ¥80.00 in the previous period), including a year-end dividend of ¥45.00 (ordinary dividend ¥40.00 and commemorative dividend for the 75th anniversary of the company’s establishment ¥5.00).
- For the fiscal year ending March 2027, consolidated performance forecasts include net sales of ¥8,500 million (up 2.0% YoY), net income attributable to owners of parent of ¥470 million (down 6.3% YoY), and an annual dividend of ¥80.00 per share.
- During the current fiscal year, special losses of ¥561 million for investigation costs related to inappropriate accounting by a consolidated subsidiary and ¥89 million for expenses related to the voluntary recall of digital torque wrenches were recorded.
🤖 AI Perspective
The decrease in revenue and profit for the fiscal year ended March 2026 was impacted by special losses related to an inappropriate accounting case and product recall expenses. However, the increase in the annual dividend, including a commemorative dividend, may suggest a commitment to shareholder returns despite the challenging year. The forecast for the next fiscal year anticipates an increase in sales, but the annual dividend is projected to decrease from the previous period due to the absence of the commemorative dividend, making future business recovery and profitability improvements key areas for investors to monitor.
6858|小野測器
805.0
▼ -0.37%
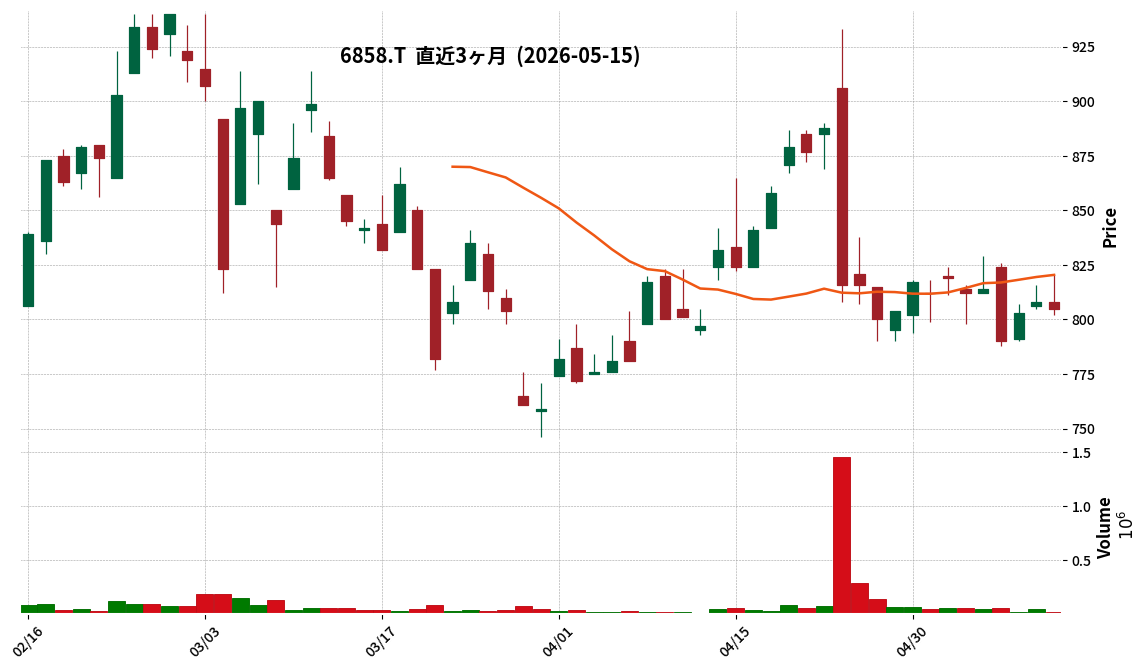
This article is an AI-generated summary and analysis of official IR disclosures.
📄 Announcement (AI-Reviewed)
- Ono Sokki Co., Ltd. announced on May 15, 2026, the completion of the interim review by certified public accountants for its Q1 FY2026 consolidated financial results.
- There are no changes to the consolidated quarterly financial statements and related disclosures previously announced on April 23, 2026.
- For Q1 FY2026 (January 1, 2026, to March 31, 2026), consolidated net sales were JPY 4,448 million (up 19.4% year-on-year), operating income was JPY 423 million (up 28.0%), ordinary income was JPY 416 million (up 27.2%), and net income attributable to owners of the parent was JPY 267 million (up 13.1%).
- Orders received increased by 12.5% year-on-year to JPY 3,893 million, and order backlog, despite a decrease from the beginning of the period, rose 25.7% year-on-year to JPY 8,494 million.
- By segment, “Custom Test Equipment and Services” contributed significantly with sales of JPY 3,186 million (up 20.7% year-on-year) and segment profit of JPY 413 million (up 28.9%).
🤖 AI Perspective
The completion of the interim review by certified public accountants, confirming the previously announced Q1 financial results, may reassure investors regarding the transparency and reliability of the reported information. The double-digit growth in sales and all profit metrics year-on-year could indicate a continuation of robust business operations. The strong performance of the Custom Test Equipment and Services segment appears to be driven by increasing demand for existing equipment upgrades and regulatory compliance, which could be a key area to monitor going forward.
6977|日抵抗器
1080.0
▲ +0.00%
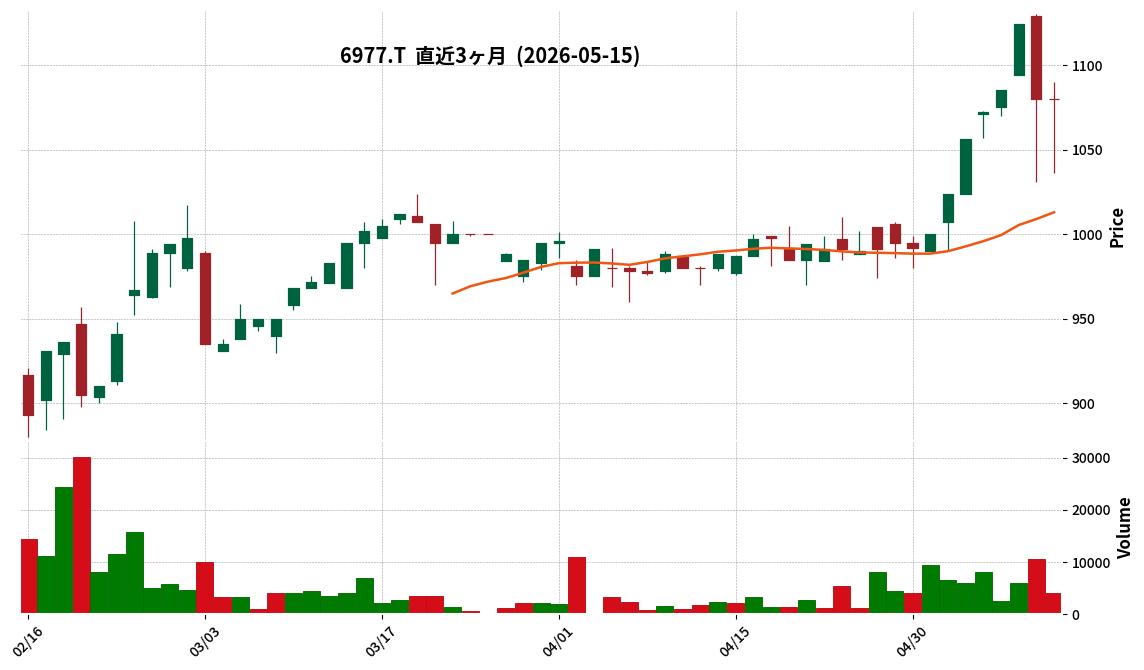
This article is an AI-generated summary and analysis of official IR disclosures.
📄 Announcement (AI-Reviewed)
- For the first quarter of the fiscal year ending December 2026 (January 1, 2026, to March 31, 2026), consolidated net sales amounted to ¥1,379 million, representing a 4.9% increase compared to the same period of the previous year.
- The company reported an operating loss of ¥20 million, an ordinary loss of ¥34 million, and a net loss attributable to owners of the parent of ¥57 million. These figures represent an improvement in losses compared to the same period last year (Q1 FY2025 operating loss of ¥107 million, ordinary loss of ¥122 million, net loss attributable to owners of the parent of ¥119 million).
- The increase in net sales was attributed to higher sales of sensor-related products and a recovery in orders due to improved customer inventory adjustments.
- Sales breakdown by region was: Japan ¥1,054 million, Asia ¥235 million, Europe ¥83 million, and other regions ¥5 million.
- The full-year consolidated earnings forecast and annual dividend forecast remain unchanged from the most recently published projections.
🤖 AI Perspective
Japan Resistor’s Q1 results show a notable increase in sales and a reduction in losses across key profit metrics, which could indicate positive momentum from demand in specific product areas and improved inventory management by customers. Despite these improvements, the company still reported a net loss for the quarter, suggesting that continued monitoring of their strategies for achieving full-year profitability and managing rising costs will be important for investors.
7272|ヤマハ発
1241.5
▲ +6.48%
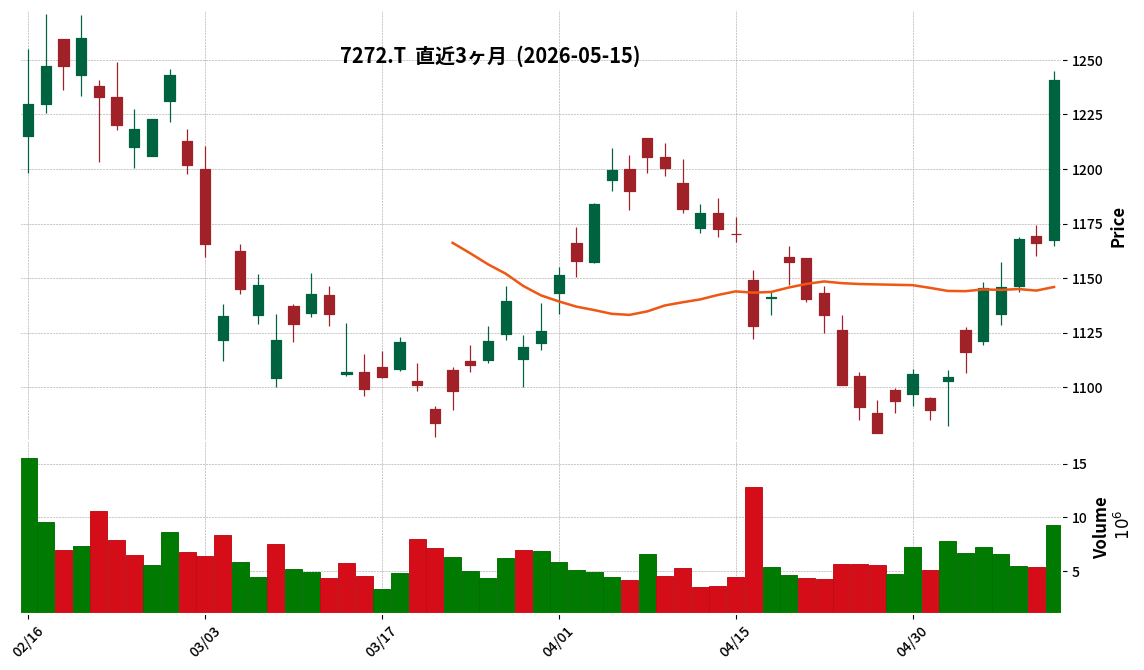
This article is an AI-generated summary and analysis of official IR disclosures.
📄 Announcement (AI-Reviewed)
- Yamaha Motor Co., Ltd. announced its consolidated financial results for the first quarter of the fiscal year ending December 2026 (January 1, 2026, to March 31, 2026).
- Revenue for the period increased by 16.6% year-on-year to ¥730,121 million.
- Operating profit significantly rose by 43.8% year-on-year, reaching ¥62,635 million.
- Profit attributable to owners of the parent increased by 34.5% year-on-year to ¥41,260 million.
- By segment, the Land Mobility business reported a substantial increase in revenue of ¥479.9 billion (+23.7% YoY) and operating profit of ¥49.0 billion (+76.3% YoY).
- The consolidated full-year forecast for December 2026 remains unchanged, projecting revenue of ¥2,700,000 million (+6.5% YoY), operating profit of ¥180,000 million (+42.4% YoY), and profit attributable to owners of the parent of ¥100,000 million (+520.8% YoY).
🤖 AI Perspective
Yamaha Motor has demonstrated robust performance in its first quarter of fiscal year 2026, with significant increases across key financial metrics. The strong growth in the Land Mobility segment, driven by favorable motorcycle sales and foreign exchange impacts, appears to be a primary contributor to the overall positive results. However, challenges in the Marine and Outdoor Land Vehicle segments, notably due to U.S. tariff effects, suggest that monitoring these areas will be important for understanding future performance.
8076|カノークス
1992.0
▲ +0.30%
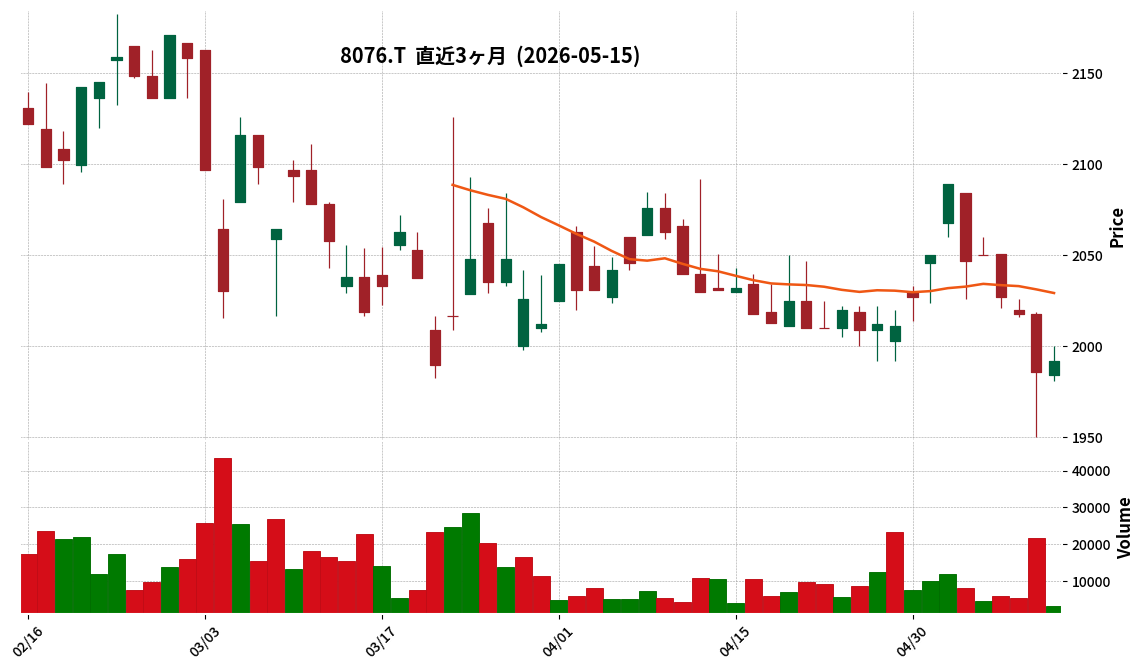
This article is an AI-generated summary and analysis of official IR disclosures.
📄 Announcement (AI-Reviewed)
- KANOX Co., Ltd. resolved at its Board of Directors meeting on April 28, 2026, to acquire all shares of Ogawa Shinkou Shoten Co., Ltd., making it a wholly owned subsidiary.
- Ogawa Shinkou Shoten Co., Ltd. is a steel wholesaler based in Sendai, Miyagi Prefecture, engaged in wholesale metal materials and processing.
- The purpose of this acquisition is to secure business in the Southern Tohoku region, establish a steel sales channel covering the entire Tohoku area by integrating with KANOX’s Tohoku branch sales network, and strengthen the supply chain.
- The planned share transfer execution date is July 1, 2026.
- KANOX states that the impact of this transaction on its business performance is minor.
🤖 AI Perspective
- This full acquisition suggests KANOX’s strategic move to strengthen its business foundation and expand its presence in the Tohoku region.
- The integration of Ogawa Shinkou Shoten’s operations with KANOX’s existing Northern Tohoku network could enhance customer response capabilities and logistics efficiency across the entire Tohoku area.
- While the immediate impact on performance is stated as minor, potential medium to long-term synergy effects may be worth monitoring by investors.
8163|SRSHD
1194.0
▼ -0.67%
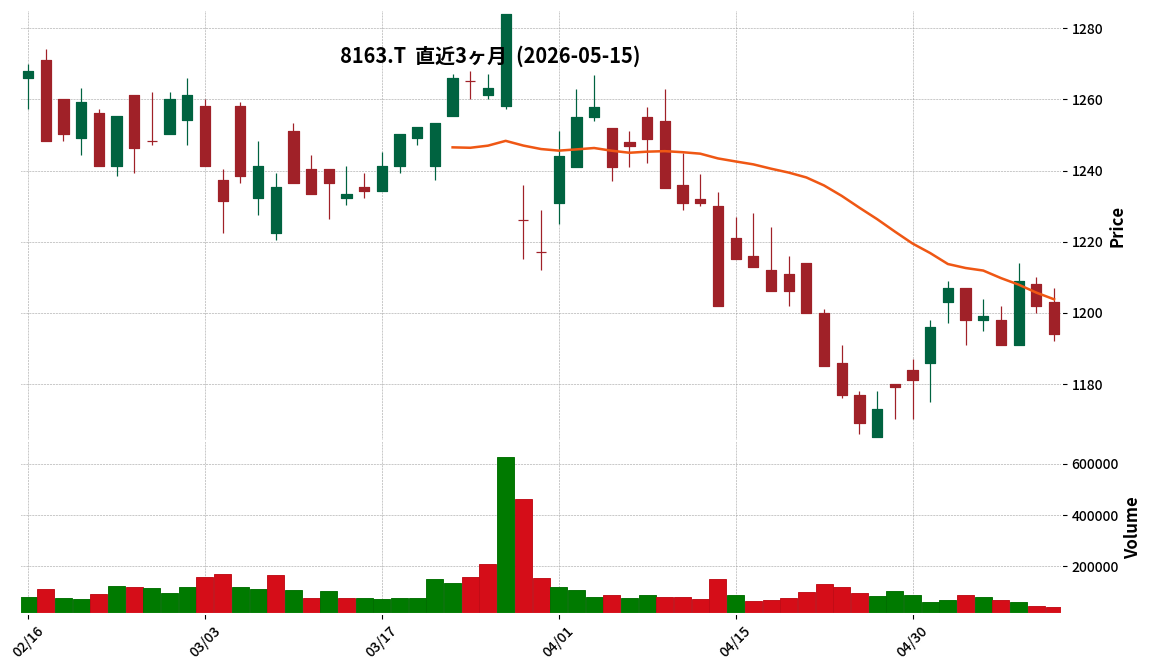
This article is an AI-generated summary and analysis of official IR disclosures.
📄 Announcement (AI-Reviewed)
- SRS Holdings Co., Ltd. reported consolidated financial results for the fiscal year ended March 2026, with sales of JPY 76,421 million (up 13.3% year-on-year), operating profit of JPY 3,051 million (up 13.9% year-on-year), ordinary profit of JPY 2,994 million (up 17.9% year-on-year), and net profit attributable to parent company of JPY 1,694 million (up 83.1% year-on-year).
- Earnings per share (EPS) for the fiscal year ended March 2026 was JPY 40.98 (compared to JPY 22.39 in the previous year).
- The annual dividend for the fiscal year ended March 2026 was JPY 10.00, comprising a year-end dividend of JPY 10.00 (compared to JPY 7.50 in the previous year).
- For the fiscal year ending March 2027, the company forecasts consolidated sales of JPY 83,000 million (up 8.6% year-on-year), operating profit of JPY 3,200 million (up 4.9% year-on-year), ordinary profit of JPY 3,000 million (up 0.2% year-on-year), and net profit attributable to parent company of JPY 1,800 million (up 6.2% year-on-year).
- Sushi Benkei Co., Ltd. was newly included in the scope of consolidation during the current fiscal year.
🤖 AI Perspective
SRS Holdings’ financial results for the fiscal year ended March 2026 show significant year-on-year increases in sales and all profit categories, with a particularly strong rise in net profit attributable to the parent company. This performance appears to be driven by enhanced product appeal through menu strategies, price adjustments, and revenue growth from M&A activities and new store openings, which collectively offset increases in raw material and personnel costs. The positive outlook for the fiscal year ending March 2027, projecting continued growth in both revenue and profit, suggests an ongoing focus on business expansion.
8388|阿波銀
6550.0
▲ +1.08%
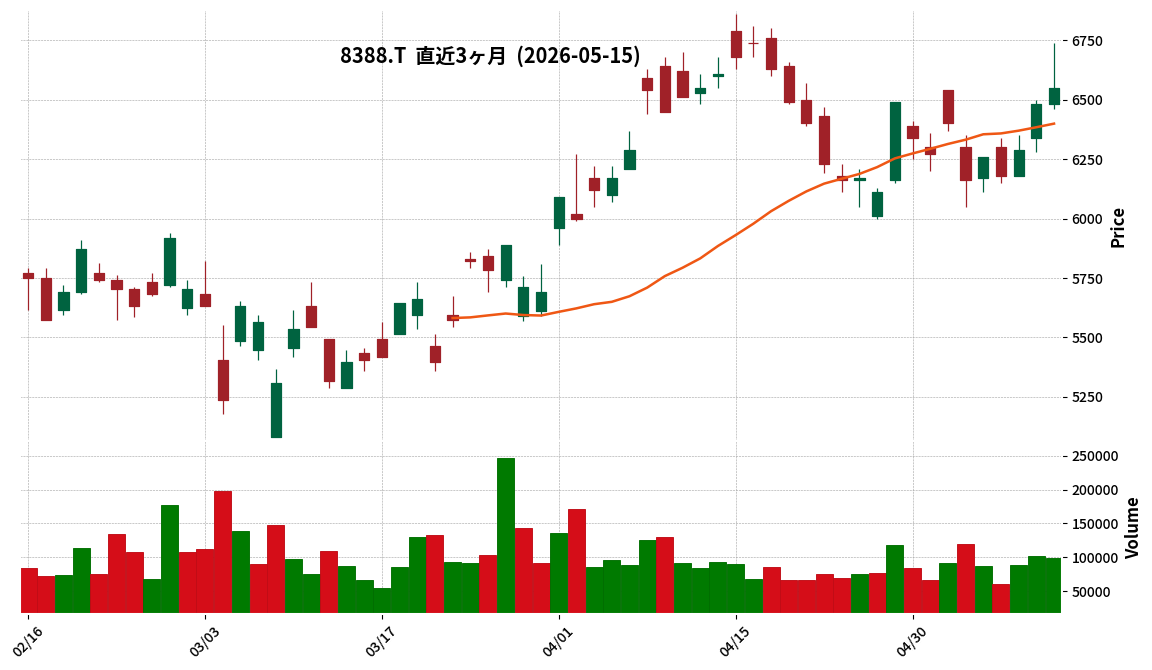
This article is an AI-generated summary and analysis of official IR disclosures.
📄 Announcement (AI-Reviewed)
- Awagin Bank has decided on a year-end dividend of ¥82.50 per share for the fiscal year ending March 31, 2026, comprising an ordinary dividend of ¥72.50 and a commemorative dividend of ¥10.00.
- This represents an increase of ¥12.50 from the most recent dividend forecast of ¥70.00 per share announced on January 27, 2026.
- The total annual dividend per share for the fiscal year ending March 2026 will be ¥142.50, combining the interim dividend of ¥60.00, marking a ¥47.50 increase compared to the previous fiscal year.
- For the fiscal year ending March 2027, the bank forecasts an annual dividend of ¥190.00 per share (interim ¥100.00, year-end ¥90.00) under a new shareholder return policy.
- The shareholder return policy for the fiscal year ending March 2026 targets a total shareholder return ratio (dividends plus share buybacks) of 40% or more of net profit attributable to parent company shareholders.
- From the fiscal year ending March 2027 onwards, the policy targets a dividend payout ratio of 40% or more of net profit attributable to parent company shareholders, with share buybacks to be implemented flexibly and opportunistically.
🤖 AI Perspective
This announcement highlights Awagin Bank’s decision to increase its year-end dividend for the fiscal year ending March 2026 and outlines a revised, more robust shareholder return policy for future periods. The substantial projected annual dividend for the fiscal year ending March 2027 could signal an enhanced commitment to shareholder returns. The updated shareholder return policy, emphasizing a higher payout ratio and flexible share buybacks, may suggest the bank’s confidence in its future earnings growth and capital management strategies.
8714|池田泉州
938.0
▲ +0.32%
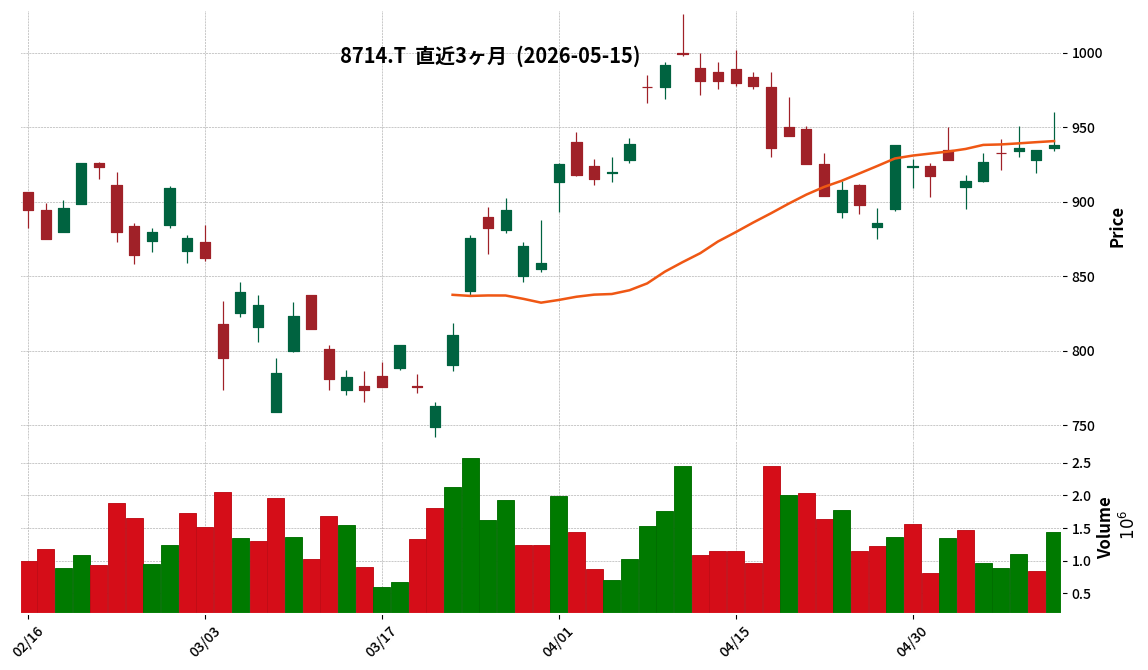
This article is an AI-generated summary and analysis of official IR disclosures.
📄 Announcement (AI-Reviewed)
- Ikeda Senshu Holdings reported consolidated ordinary revenue of ¥117,417 million for the fiscal year ended March 2026, marking a 26.1% increase year-over-year.
- Consolidated ordinary profit reached ¥25,233 million (up 29.0% year-over-year), and net income attributable to parent company shareholders was ¥17,336 million (up 30.8% year-over-year).
- Earnings per share (EPS) for the period were ¥62.29, an increase from ¥47.28 in the prior fiscal year.
- The annual dividend per share for FY2026 was increased to ¥25.00 from ¥15.50 in FY2025.
- For the fiscal year ending March 2027, the company forecasts consolidated ordinary revenue of ¥133,000 million (up 13.2% year-over-year), ordinary profit of ¥28,500 million (up 12.9% year-over-year), and net income attributable to parent company shareholders of ¥19,100 million (up 10.1% year-over-year).
🤖 AI Perspective
Ikeda Senshu Holdings’ strong double-digit growth across key profit metrics for FY2026 may suggest robust operational performance and an expanding revenue base, potentially driven by increased financial income. The significant increase in the annual dividend could indicate the company’s confidence in its financial health and a commitment to shareholder returns. Investors may view the positive outlook for FY2027 as a sign of continued growth momentum.
4116|大日精化
1089.0
▲ +0.55%
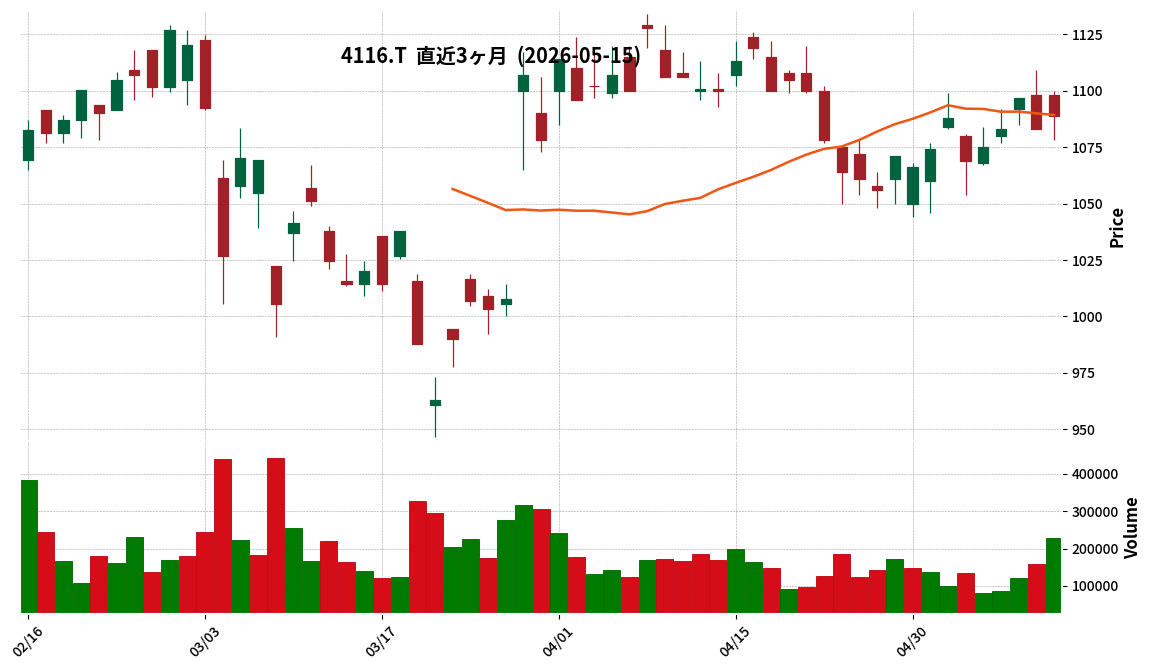
This article is an AI-generated summary and analysis of official IR disclosures.
📄 Announcement (AI-Reviewed)
- Dainichiseika Color & Chemicals Mfg. Co., Ltd. resolved to revise its dividend forecast for the fiscal year ending March 2026 at a Board of Directors meeting held on May 15, 2026.
- The revised annual dividend forecast increased from the previously announced JPY 208 to JPY 220 (ordinary dividend JPY 190, special dividend JPY 30).
- The year-end dividend was revised from the previously announced JPY 121 to JPY 133 (ordinary dividend JPY 118, special dividend JPY 15).
- This revision is based on the shareholder return policy outlined in the medium-term management plan “Transformation for Tomorrow 2027” (including an average total return ratio of 50% or more over three years, a dividend payout ratio of 40% or more, and a minimum annual dividend per share of JPY 100), as well as the financial results for the fiscal year ending March 2026.
- A special dividend of JPY 30 per year, funded by the extraordinary gain from the sale of the former Kawaguchi Manufacturing Plant, is planned to be implemented over four periods from the fiscal year ending March 2024 to March 2027.
🤖 AI Perspective
This dividend forecast revision appears to stem from the company’s shareholder return policy under its medium-term management plan, specifically an increase in the ordinary year-end dividend. The combination of a target dividend payout ratio of 40% or more (excluding special dividends) and special dividends sourced from extraordinary gains may signal the company’s commitment to consistent shareholder returns to investors. Such clear shareholder return policies could serve as a factor for long-term investment decisions.
Disclaimer: This article is for informational purposes only and does not constitute investment advice.
6151|日東工器
1661.0
▲ +0.18%
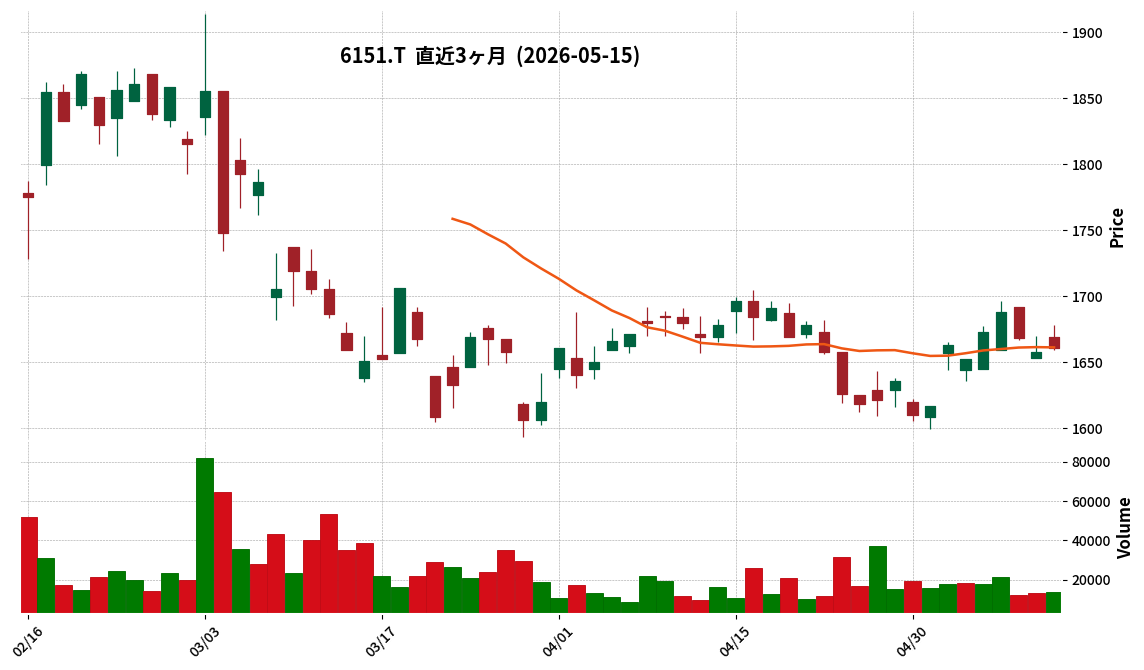
This article is an AI-generated summary and analysis of official IR disclosures.
📄 Announcement (AI-Reviewed)
- Nitto Kohki’s consolidated financial results for the fiscal year ended March 2026 show net sales of 27,289 million yen (up 0.1% year-on-year).
- Operating profit was 1,182 million yen (down 49.5% year-on-year), and ordinary profit was 1,466 million yen (down 41.6% year-on-year).
- Net profit attributable to owners of parent reached 2,144 million yen (up 59.4% year-on-year).
- The annual dividend for the fiscal year ended March 2026 was 40 yen per share (20 yen interim, 20 yen year-end), an increase from 39 yen in the prior fiscal year.
- For the fiscal year ending March 2027, the company forecasts consolidated net sales of 29,190 million yen (up 7.0% year-on-year), operating profit of 1,750 million yen (up 48.1% year-on-year), and net profit attributable to owners of parent of 1,470 million yen (down 31.5% year-on-year).
🤖 AI Perspective
While net sales showed a slight increase for the fiscal year ended March 2026, the decline in operating and ordinary profit appears to be influenced by initial costs related to new factory operations, including depreciation and fixed costs, as well as rising raw material and labor expenses. Conversely, net profit attributable to owners of parent significantly increased. For the fiscal year ending March 2027, despite projections for increased sales and operating profit, the expected decrease in net profit suggests that uncertainties in the business environment and structural factors may continue to impact future earnings.
1979|大気社
3505.0
▲ +0.29%
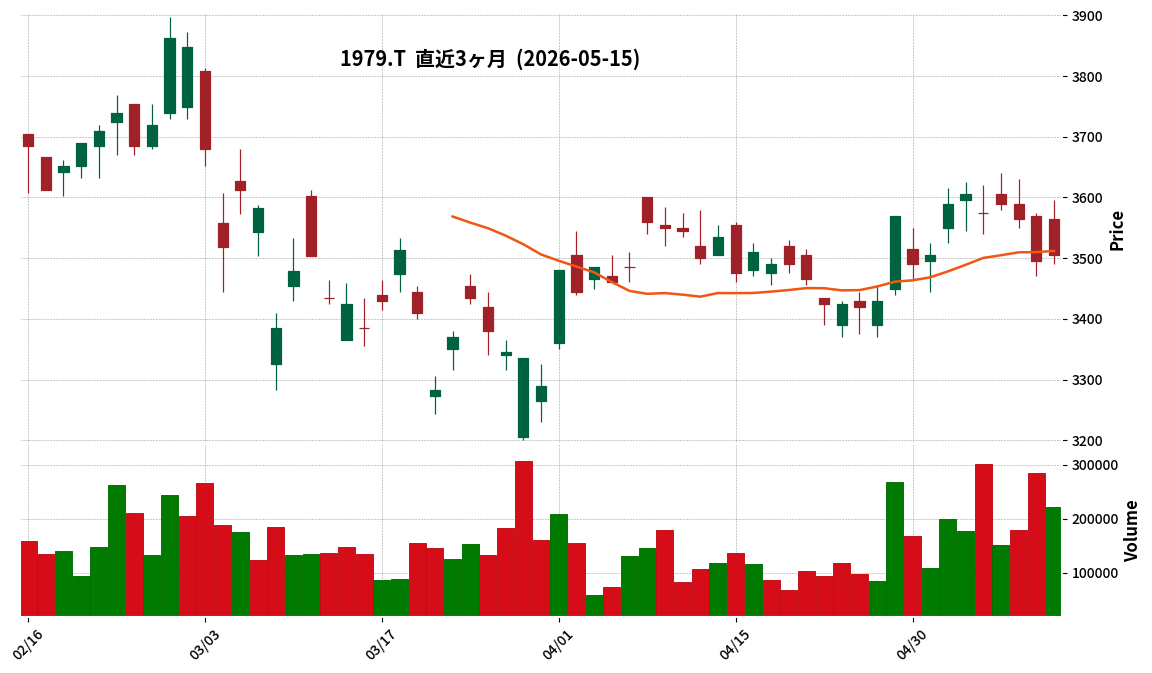
This article is an AI-generated summary and analysis of official IR disclosures.
📄 Announcement (AI-Reviewed)
- Taikisha Co., Ltd. resolved to change its dividend policy and increase its dividend (interim dividend) at a Board of Directors meeting held on May 15, 2026.
- The target consolidated Dividend on Equity (DOE) has been revised upwards from the previous 4.0% to 4.5%. This change will be applied starting from the fiscal year ending March 2026.
- The year-end dividend for the fiscal year ending March 31, 2026, has been increased by ¥16 from the most recent forecast of ¥54 per share to ¥70 per share.
- Consequently, the estimated annual dividend per share for the fiscal year ending March 2026 will be ¥110 (¥40 for Q2, ¥70 for year-end).
- The total dividend amount is ¥4,439 million, with the effective date of payment set for June 24, 2026.
🤖 AI Perspective
Taikisha’s revision of its dividend policy and upward adjustment of its DOE target may signal a strengthened commitment to shareholder returns. This dividend increase, attributed to improved current earnings, could be viewed as positive news for investors. The heightened DOE target and the concrete dividend increase might be interpreted as an integral part of the company’s shareholder return strategy within its medium-term management plan.
Disclaimer: This article is for informational purposes only and does not constitute investment advice.
406A|P-環境のミカタHD
5450.0
▲ +0.00%
📎 Source:P-環境のミカタHD Official IR →
This article is an AI-generated summary and analysis of official IR disclosures.
📄 Announcement (AI-Reviewed)
- P-KANKYO NO MIKATA HD reported consolidated net sales of ¥1,302 million for the interim period of the fiscal year ending September 2026 (October 1, 2025 – March 31, 2026).
- The company posted an operating loss of ¥0 million, an ordinary loss of ¥(77) million, and a net loss attributable to owners of parent of ¥(67) million for the interim period.
- The company was established on October 1, 2025, through a sole share transfer, thus there are no comparable figures for the interim period of the fiscal year ended September 2025.
- The interim dividend for the fiscal year ending September 2026 will be ¥0.00, considering the current business performance. The year-end dividend forecast remains undetermined.
- The new recycling plant commenced full-scale operation in January 2026, but the start-up of new projects was delayed due to factors such as the timing of the disposal permit issuance, resulting in lower-than-planned waste acceptance volumes.
🤖 AI Perspective
P-KANKYO NO MIKATA HD’s interim results for the fiscal year ending September 2026 show sales but reported losses across operating, ordinary, and net income attributable to owners of parent. This outcome is attributed to delays in securing new contracts for the new recycling plant, which began full-scale operation in January 2026, and increased fixed costs such as depreciation associated with the plant’s operation. Investors may wish to monitor future order trends and the timing of the new plant’s expected contribution to profitability.
Disclaimer: This article is for informational purposes only and does not constitute investment advice.
5074|テスホールディングス
1022.0
▼ -0.58%
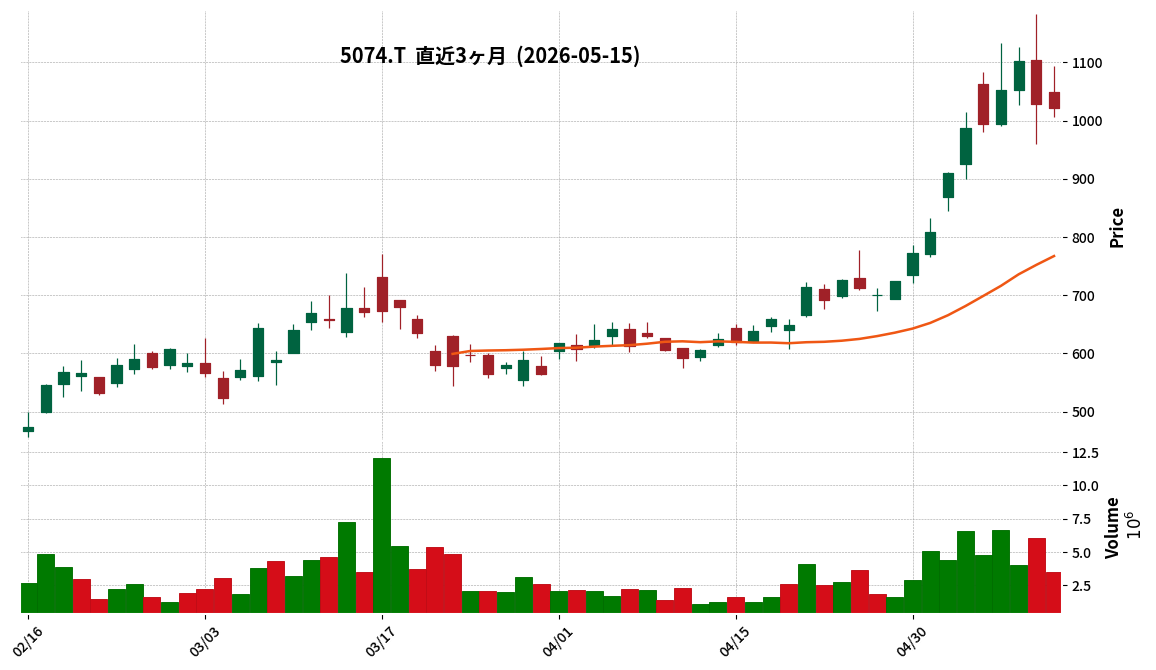
📎 Source:テスホールディングス Official IR →
This article is an AI-generated summary and analysis of official IR disclosures.
📄 Announcement (AI-Reviewed)
- For the nine months ended March 31, 2026, TES HOLDINGS reported consolidated net sales of ¥37,444 million, a 39.8% increase compared to the prior year.
- Operating income was ¥3,592 million (+34.6% YoY), and net income attributable to owners of parent reached ¥1,263 million (+105.0% YoY).
- Ordinary income significantly increased to ¥2,497 million, compared to ¥225 million in the same period last year.
- The Engineering segment’s net sales were ¥16,442 million (+39.2% YoY), but segment profit decreased by 23.4% to ¥593 million.
- The full-year consolidated earnings forecast and the annual dividend forecast of ¥5.80 for the fiscal year ending June 2026 remain unchanged from the most recently announced figures.
🤖 AI Perspective
TES HOLDINGS’ Q3 FY2026 results show substantial growth in both revenue and net income, with the net income growth being particularly notable. While the Engineering segment’s sales increased, the decline in segment profit within this area may be a point of interest for investors seeking to understand the underlying drivers. The company’s decision to maintain its full-year earnings and dividend forecasts suggests confidence in its current operational trajectory.
5724|アサカ理研
3090.0
▲ +0.49%
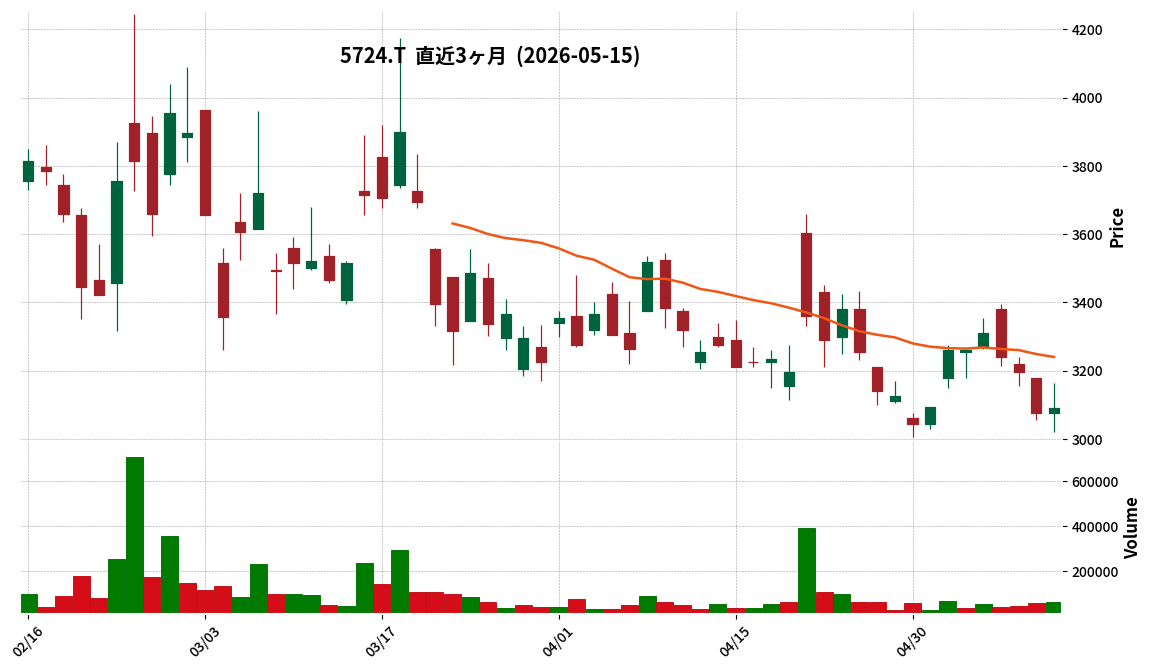
This article is an AI-generated summary and analysis of official IR disclosures.
📄 Announcement (AI-Reviewed)
- Asaka Riken announced its Q2 FY2026 (interim) financial results, reporting revenue of ¥5.283 billion (+19.8% YoY), operating profit of ¥717 million (+191.7% YoY), ordinary profit of ¥666 million (+290.8% YoY), and net profit attributable to parent company of ¥494 million (+279.8% YoY).
- The primary drivers for the increased revenue and profit were the rise in gold prices and an increase in transaction volume.
- By segment, the Precious Metals business recorded sales of ¥4.403 billion (+18.6% YoY) and segment profit of ¥565 million (+420.1% YoY). Both the Environmental business and System business also achieved increases in revenue and profit.
- On May 15, 2026, the full-year earnings forecast was revised upwards to revenue of ¥10.750 billion, operating profit of ¥1.240 billion, ordinary profit of ¥1.040 billion, and net profit attributable to parent company of ¥785 million.
- Regarding the LiB recycling business, construction of the new building at the Iwaki Plant is progressing, transitioning from foundation work to building construction.
🤖 AI Perspective
The latest financial results indicate that the Precious Metals business, a core segment, significantly boosted overall performance due to rising gold prices and increased transaction volumes. Concurrently, the ongoing capital investment in the LiB recycling business, a potential future growth driver, suggests a long-term strategic transformation. The upward revision of the full-year earnings forecast, despite planning for one-off expenses related to the LiB recycling business in the second half, may reflect the company’s confidence in its current strong performance and future outlook.
5918|滝上工
7220.0
▲ +0.00%
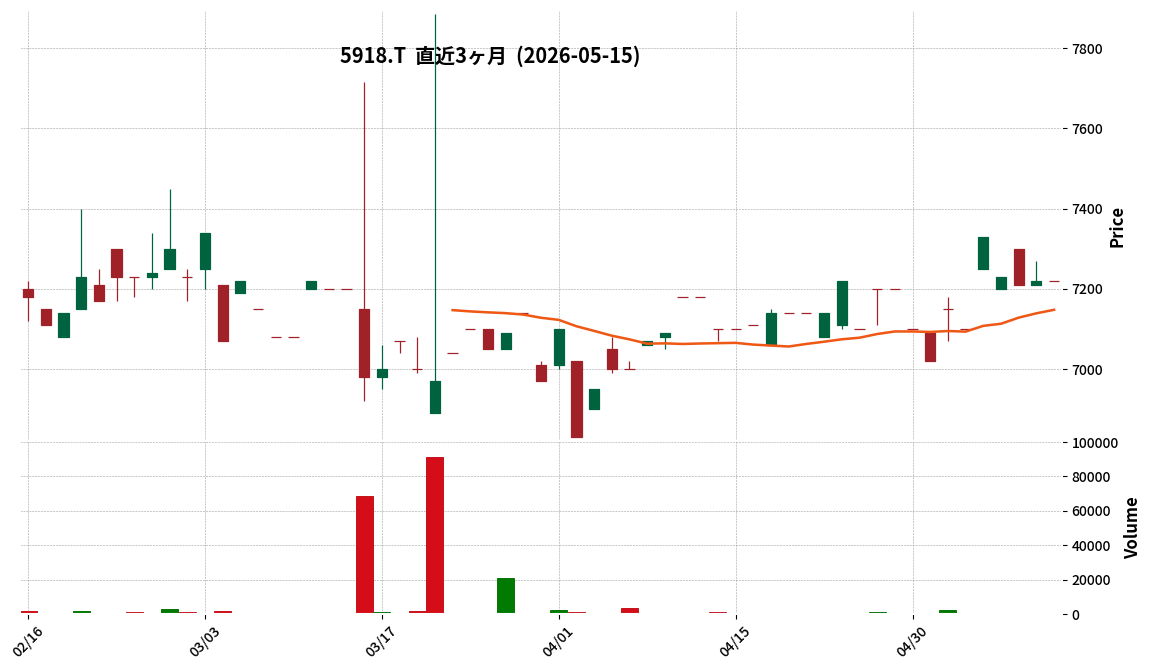
This article is an AI-generated summary and analysis of official IR disclosures.
📄 Announcement (AI-Reviewed)
- Takigami Kogyo Co., Ltd. resolved to pay a surplus dividend (an increase due to a 130th anniversary commemorative dividend) for the record date of March 31, 2026, at its Board of Directors meeting held on May 15, 2026.
- The year-end dividend per share for the fiscal year ending March 2026 will be ¥70.00 (¥50.00 ordinary dividend + ¥20.00 commemorative dividend).
- This represents an increase of ¥20.00 per share compared to the most recent dividend forecast (announced on February 13, 2026) of ¥50.00.
- The annual dividend per share for the fiscal year ending March 2026 is projected to be ¥120.00, combining the interim dividend of ¥50.00 with the year-end dividend (¥100.00 ordinary dividend + ¥20.00 commemorative dividend).
- This resolution is subject to approval at the 89th Annual General Meeting of Shareholders, scheduled for June 26, 2026.
🤖 AI Perspective
Takigami Kogyo’s decision to implement a commemorative dividend for its 130th anniversary demonstrates a commitment to enhancing shareholder returns. The increase in the year-end dividend, resulting in a higher annual payout compared to the previous fiscal year, aligns with the company’s policy of maintaining stable dividends while considering business performance. This move could be interpreted as the company’s intention to reward shareholders for their continued support.
6144|西部電機
3195.0
▼ -3.91%
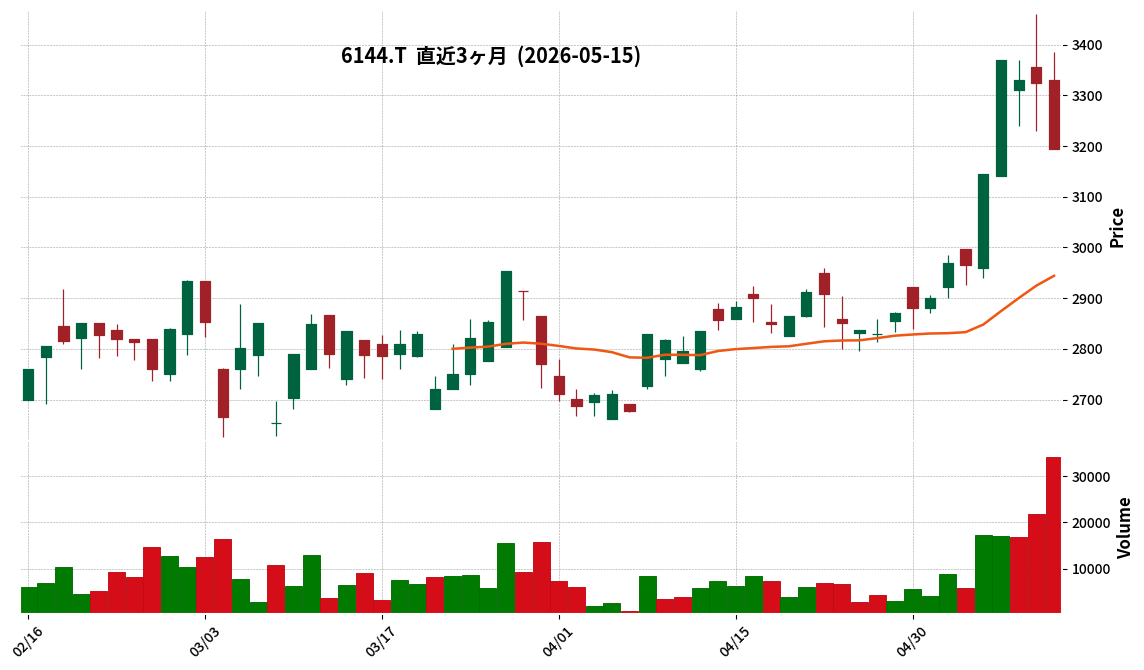
This article is an AI-generated summary and analysis of official IR disclosures.
📄 Announcement (AI-Reviewed)
- Seibu Denki announced consolidated results for the fiscal year ended March 31, 2026, with net sales of ¥39,265 million (up 17.7% YoY), operating profit of ¥4,195 million (up 31.4% YoY), ordinary profit of ¥4,292 million (up 31.2% YoY), and profit attributable to owners of parent of ¥3,516 million (up 49.6% YoY).
- Order intake increased by 10.8% year-on-year to ¥40,212 million, primarily driven by strong performance in the precision machinery and industrial machinery segments.
- Net sales, operating profit, ordinary profit, and profit attributable to owners of parent all reached record highs.
- For the fiscal year ending March 31, 2027, the company forecasts consolidated net sales of ¥40,830 million (up 4.0% YoY), operating profit of ¥4,370 million (up 4.1% YoY), ordinary profit of ¥4,410 million (up 2.7% YoY), and profit attributable to owners of parent of ¥3,000 million (down 14.7% YoY).
- The annual dividend for FY2026/3 was ¥84 (interim ¥42, year-end ¥42), and the forecast for FY2027/3 is an increase to ¥90 (interim ¥45, year-end ¥45).
🤖 AI Perspective
Seibu Denki’s FY2026/3 results show significant growth across key profitability metrics, reaching record highs, with sales and order intake also setting new records for the second consecutive period. This performance may suggest successful price pass-through for rising material costs and improved productivity through optimized production lines. However, the projected decrease in net profit for FY227/3 could indicate factors worth monitoring by investors for the upcoming fiscal year.
6331|菱化工機
3345.0
▲ +1.21%
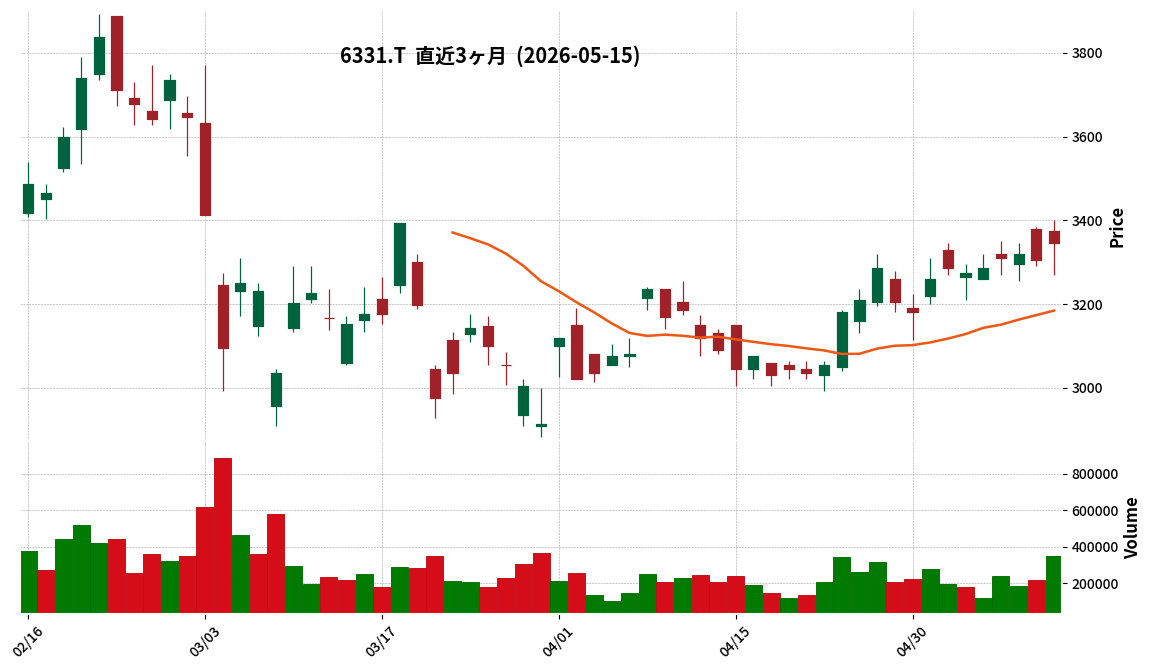
This article is an AI-generated summary and analysis of official IR disclosures.
📄 Announcement (AI-Reviewed)
- Mitsubishi Kakoki announced a resolution to update its “Mitsubishi Kakoki Group 2050 Management Vision.”
- The company advanced its target for achieving consolidated net sales of ¥100 billion from FY2035 to FY2029, a six-year acceleration.
- The consolidated net sales forecast for FY2035 was revised upwards from ¥100 billion to ¥120-140 billion.
- For FY2029, consolidated performance targets include net sales of ¥100 billion (with approximately 30% from the GX business) and an operating profit margin of around 10%.
- The primary reasons for the update are cited as structural changes in the business environment and advancements in the company’s management strategy, which have clarified the path to achieving the vision, and the need to maintain an accurate message regarding its long-term growth prospects.
🤖 AI Perspective
This vision update highlights a significant acceleration in the timeline for achieving consolidated net sales targets and an upward revision of future sales figures. This suggests that the company believes it can accelerate its growth trajectory, driven by changes in the business environment and the progress of its management strategies. The emphasis on the expansion of the GX business as a key growth driver indicates a reinforced commitment to sustainable growth.
6376|日機装
2730.0
▲ +1.79%
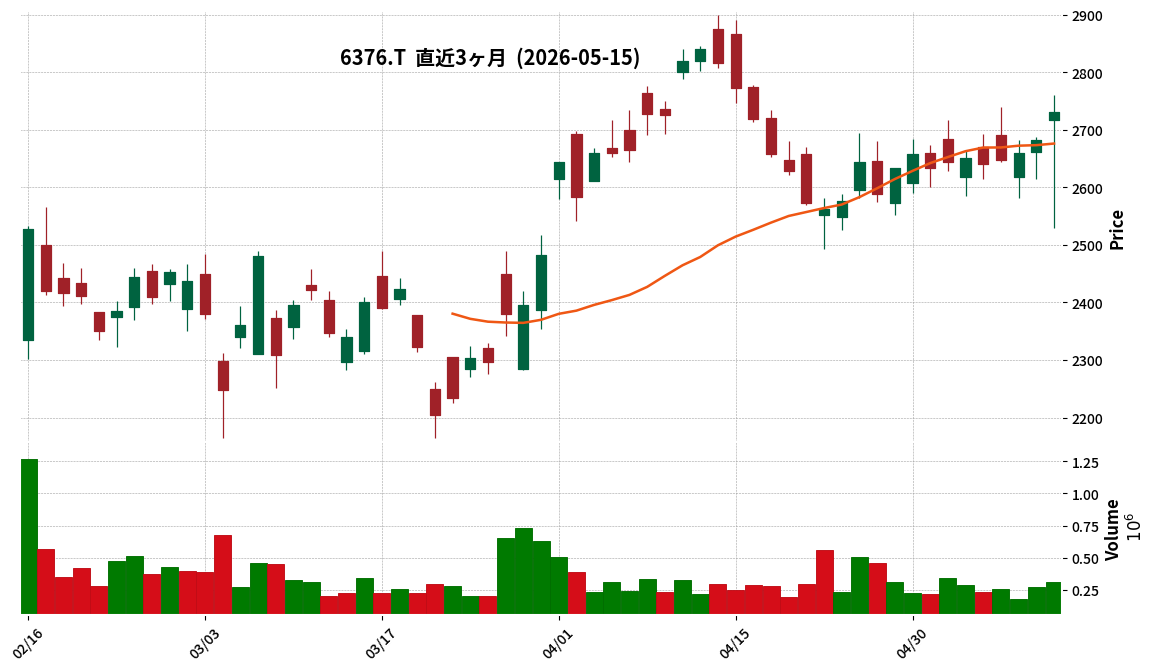
This article is an AI-generated summary and analysis of official IR disclosures.
📄 Announcement (AI-Reviewed)
- Nikkiso Co., Ltd. has announced its consolidated financial results for the first quarter of the fiscal year ending December 2026 (January 1, 2026 – March 31, 2026).
- Consolidated revenue was ¥55,366 million, marking a 14.6% increase compared to the same period in the previous year.
- Consolidated operating profit reached ¥3,689 million, a 24.9% increase year-over-year.
- Profit attributable to owners of the parent was ¥3,156 million, up 39.4% from the prior year’s first quarter.
- By segment, the Industrial division reported a 49.0% increase in order intake, a 23.8% increase in revenue, and an 82.3% increase in segment profit year-over-year. Within this, the Industrial business saw a 22.7% rise in revenue, and the Aerospace business achieved a 31.4% increase in revenue.
- The Medical division’s revenue increased by 0.1%, but its segment profit decreased by 5.7%.
🤖 AI Perspective
Nikkiso’s Q1 FY2026 results show a strong performance with increases in revenue, operating profit, and profit attributable to owners of the parent, notably driven by the Industrial and Aerospace segments. This performance may suggest a positive impact from the expanding capital investment demand in the LNG sector and the recovery of the aircraft market. However, the decline in profit within the Medical segment is worth monitoring, as it could indicate areas for investor focus regarding future growth strategies and cost structures.
6400|不二精機
289.0
▲ +0.35%
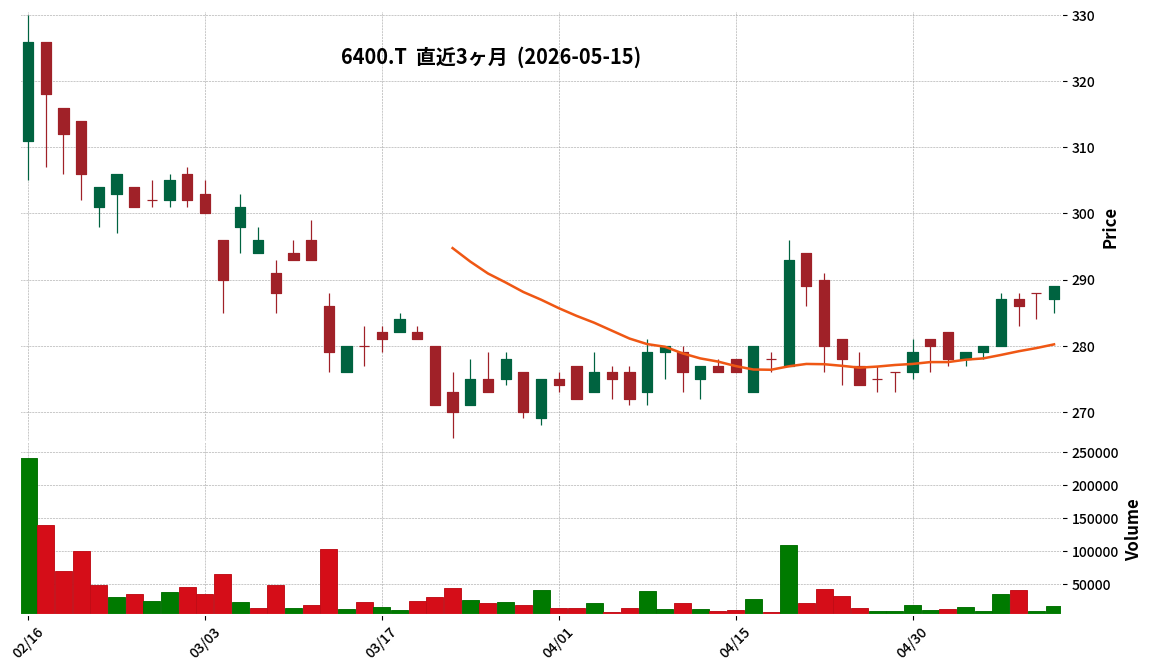
This article is an AI-generated summary and analysis of official IR disclosures.
📄 Announcement (AI-Reviewed)
- Fujiseiki announced its consolidated financial results for the first quarter of the fiscal year ending December 2026 (January 1, 2026 – March 31, 2026).
- Net sales were ¥2,254 million, a 0.0% change from the same period in the prior year.
- Operating profit increased by 41.1% year-on-year to ¥195 million.
- Net income attributable to owners of parent rose by 17.7% year-on-year to ¥124 million.
- The equity ratio improved by 3.0 percentage points from 37.8% at the end of the previous consolidated fiscal year, reaching 40.8%.
- There were no changes to the full-year consolidated earnings forecast or the dividend forecast (year-end ¥7.00, total ¥7.00).
🤖 AI Perspective
Fujiseiki’s Q1 FY2026 results indicate stable sales while achieving significant growth in operating profit and net income attributable to owners of parent. This performance suggests an improvement in gross profit margins across both the injection molding precision die and molding system business and the precision molded products and other businesses, despite increases in selling and administrative expenses. The enhanced equity ratio could also be seen as an indicator of strengthening financial stability.
6457|グローリー
4499.0
▲ +9.79%
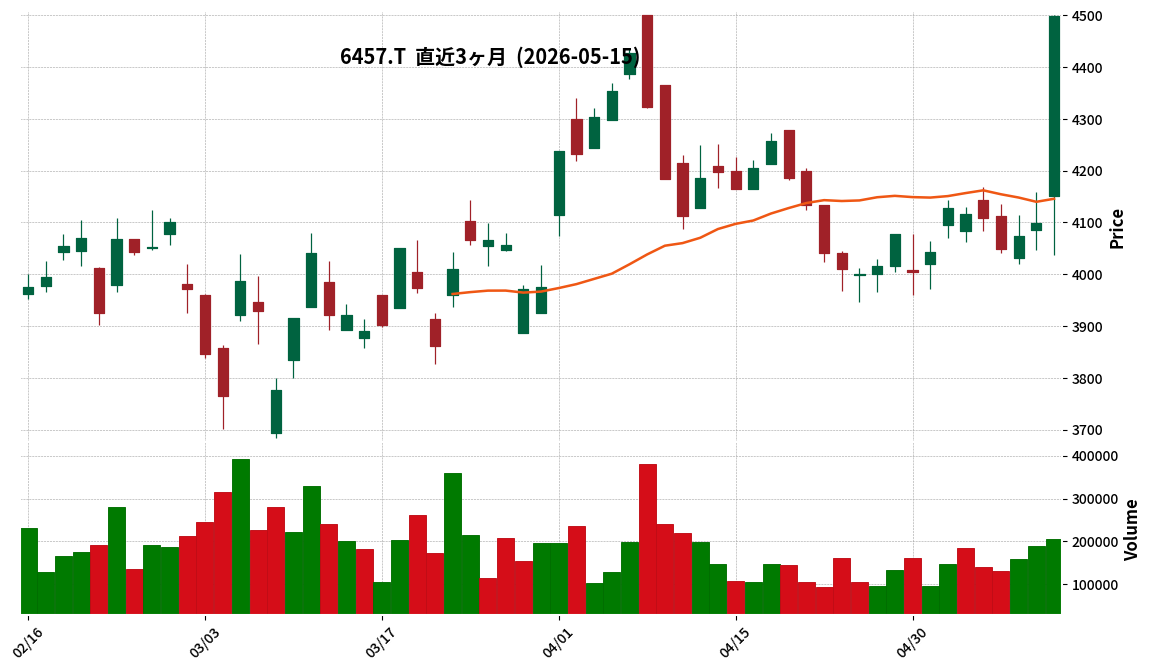
This article is an AI-generated summary and analysis of official IR disclosures.
📄 Announcement (AI-Reviewed)
- Consolidated revenue for the fiscal year ended March 2026 was ¥339,582 million, a decrease of 7.9% year-on-year.
- Net profit attributable to owners of the parent for the same period was ¥15,388 million, down 37.2% year-on-year.
- Basic earnings per share were ¥284.71 (compared to ¥439.22 in the previous fiscal year).
- For the fiscal year ending March 2027 (forecast), consolidated revenue is projected at ¥360,000 million (up 6.0% year-on-year), and net profit attributable to owners of the parent is projected at ¥20,000 million (up 30.0% year-on-year).
- The annual dividend for the fiscal year ended March 2026 was ¥112 per share (interim ¥56, year-end ¥56), with a forecast of ¥154 per share (interim ¥77, year-end ¥77) for the fiscal year ending March 2027.
🤖 AI Perspective
Glory’s financial results for the fiscal year ended March 2026 showed a decline in both revenue and profit. However, the company’s forecast for the fiscal year ending March 2027, projecting increases in both revenue and profit, may indicate an expected turnaround. The anticipated increase in the annual dividend could be seen as a positive sign regarding shareholder returns. Investors might want to monitor the progression of these forward-looking figures and the company’s strategic initiatives to achieve them.
2376|サイネックス
661.0
▼ -1.93%
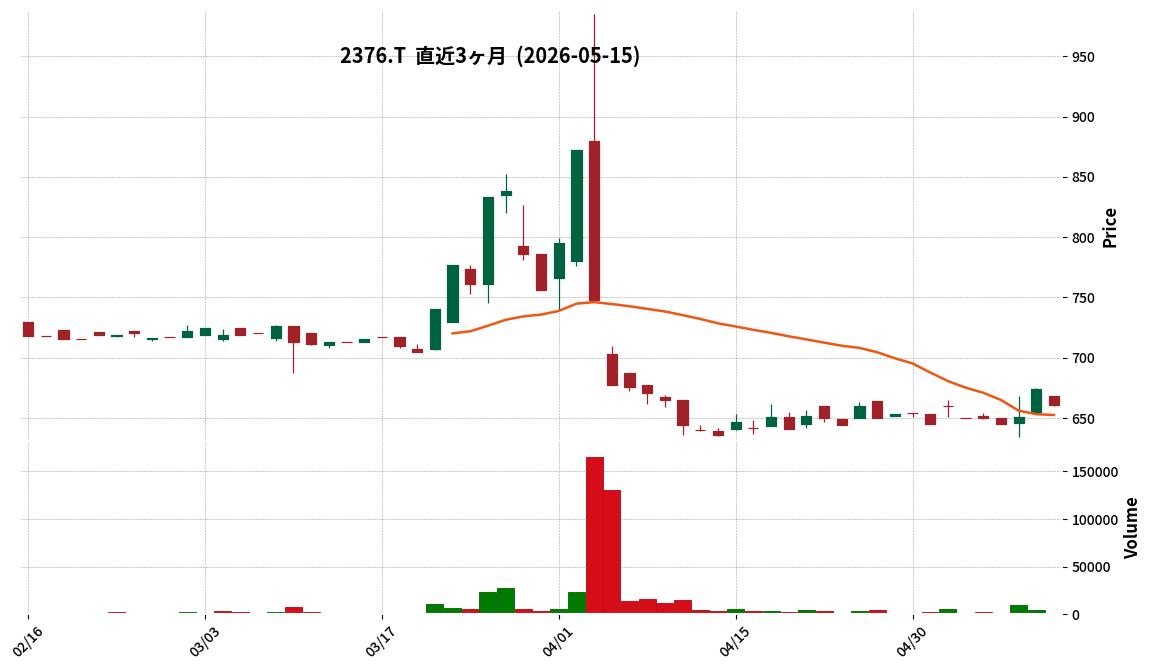
This article is an AI-generated summary and analysis of official IR disclosures.
📄 Announcement (AI-Reviewed)
- SCINEX Co., Ltd. has announced its consolidated financial results for the fiscal year ended March 2025.
- Consolidated net sales for the period were JPY 17,089 million, representing a 3.6% increase compared to the previous fiscal year.
- Operating profit decreased by 65.0% to JPY 167 million, ordinary profit fell by 54.3% to JPY 224 million, and profit attributable to owners of parent declined by 81.6% to JPY 50 million.
- Basic earnings per share were JPY 9.00 (compared to JPY 49.02 in the previous year).
- For the fiscal year ending March 2026, the company forecasts consolidated net sales of JPY 15,300 million (down 10.5% year-on-year), operating profit of JPY 410 million (up 145.0%), ordinary profit of JPY 440 million (up 95.6%), and profit attributable to owners of parent of JPY 240 million (up 375.5%).
🤖 AI Perspective
SCINEX’s FY2025 results show a revenue increase but significant profit declines across operating, ordinary, and net profit metrics. This could suggest challenges in managing costs or shifts in the profitability of its core businesses, such as the contraction of “Telepal 50” in the information media segment. However, the substantial projected profit recovery for FY2026 may indicate anticipated benefits from strategic initiatives or a more favorable business environment, which investors might consider monitoring closely.
4391|G-ロジザード
1075.0
▼ -0.19%
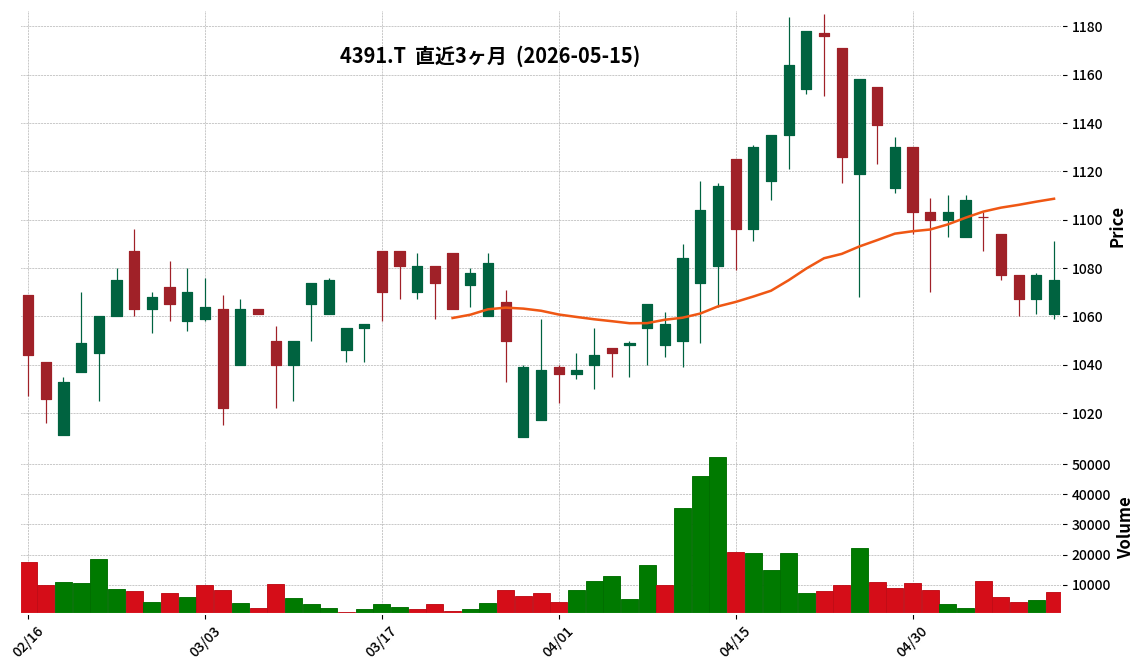
📎 Source:G-ロジザード Official IR →
This article is an AI-generated summary and analysis of official IR disclosures.
📄 Announcement (AI-Reviewed)
- G-Logizard announced its financial results for the third quarter of the fiscal year ending June 2026 (July 1, 2025 – March 31, 2026).
- During the cumulative third quarter, net sales reached ¥1,772 million, marking an 8.4% increase year-over-year.
- Operating income was ¥305 million (down 14.6% YoY), ordinary income was ¥308 million (down 14.1% YoY), and net income for the quarter was ¥219 million (down 17.4% YoY).
- By service segment, Cloud Service revenue increased 9.4% to ¥1,403 million, and Development/Implementation Service revenue increased 8.3% to ¥305 million. Conversely, Equipment Sales Service revenue decreased 9.9% to ¥62 million.
- The full-year earnings forecast for fiscal year 2026 remains unchanged, with projected net sales of ¥2,439 million, operating income of ¥355 million, ordinary income of ¥356 million, and net income of ¥258 million.
🤖 AI Perspective
While revenue demonstrates solid growth, operating income and other profit metrics declined compared to the prior year. This could be attributed to upfront investments, such as organizational reforms to improve business operational capabilities and software version upgrades. The continued growth in cloud and development/implementation services, alongside a decrease in equipment sales, might indicate a shift in the company’s business structure, which warrants monitoring for its potential impact on future profitability.
6190|G-PXB
442.0
▼ -1.78%
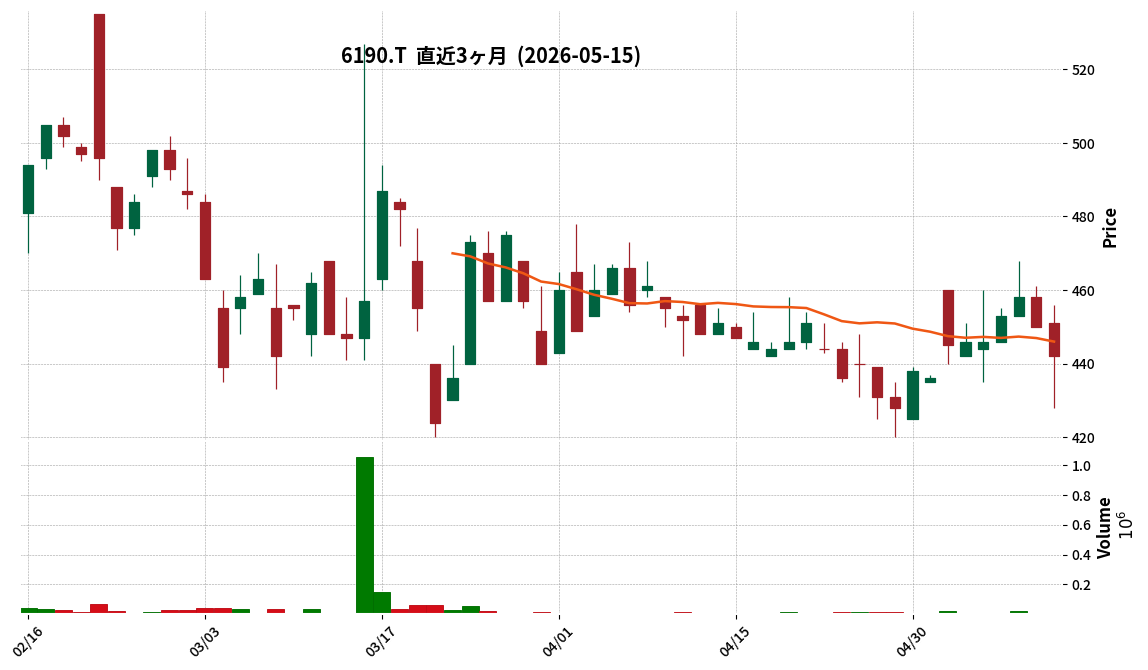
This article is an AI-generated summary and analysis of official IR disclosures.
📄 Announcement (AI-Reviewed)
- PhoenixBio Co., Ltd. has announced its consolidated financial results for the fiscal year ended March 31, 2026 (April 1, 2025 to March 31, 2026).
- Consolidated net sales reached JPY 1,565,532 thousand, representing a 1.6% increase compared to the previous fiscal year.
- Consolidated operating profit was JPY 82,769 thousand, marking a turnaround from an operating loss of JPY 142,079 thousand in the prior year.
- Consolidated ordinary profit was JPY 131,275 thousand (versus an ordinary loss of JPY 155,182 thousand in the prior year), and profit attributable to owners of parent was JPY 125,228 thousand (versus a loss of JPY 448,933 thousand in the prior year).
- For the fiscal year ending March 31, 2027, the company forecasts consolidated net sales of JPY 1,610 million (+2.9% YoY), operating profit of JPY 85 million (+3.7% YoY), ordinary profit of JPY 87 million (-33.5% YoY), and profit attributable to owners of parent of JPY 76 million (-38.6% YoY).
🤖 AI Perspective
G-PXB’s FY2026/3 results show a significant turnaround in operating profit, driven by cost reductions such as the liquidation of its overseas production subsidiary and decreased manufacturing costs for PXB mice. While sales and operating profit are projected to increase in FY2027/3, the forecast indicates a decline in ordinary and net profits, which may warrant investor attention regarding the underlying reasons. This shift in profitability metrics could influence market sentiment moving forward.
6291|エアーテック
1299.0
▼ -0.15%
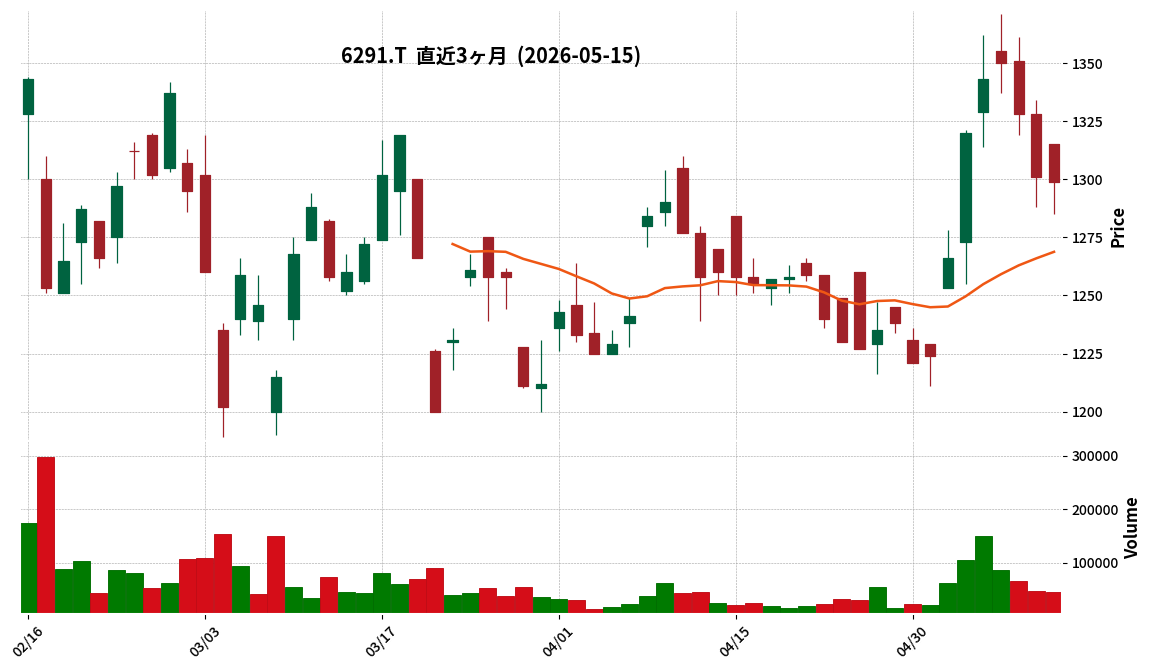
This article is an AI-generated summary and analysis of official IR disclosures.
📄 Announcement (AI-Reviewed)
- Airtech’s Q1 FY2026 (January 1, 2026 – March 31, 2026) non-consolidated results show net sales of ¥3.689 billion (down 2.9% YoY), operating profit of ¥313 million (down 14.6% YoY), ordinary profit of ¥325 million (down 9.6% YoY), and quarterly net profit of ¥223 million (down 9.3% YoY).
- Regarding financial position, total assets at the end of Q1 were ¥19.282 billion, a decrease of ¥593 million from the end of the previous fiscal year. Net assets were ¥14.446 billion, a decrease of ¥325 million, primarily due to dividend payments of ¥549 million and the recording of quarterly net profit of ¥223 million.
- The full-year forecast for FY2026 remains unchanged from the announcement on February 16, 2026, projecting net sales of ¥14.0 billion (down 1.1% YoY), operating profit of ¥1.150 billion (down 1.2% YoY), ordinary profit of ¥1.500 billion (down 6.6% YoY), and net profit of ¥1.080 billion (down 4.5% YoY).
- Sales by product show increases in “Clean Booths” for the electronic industry and “Filter Units” related to semiconductor manufacturing, while “Air Shower” sales decreased due to fewer large-scale projects.
- In terms of production, the company plans to utilize the Akagi No. 2 Plant (tentative name), scheduled to start operation in September 2026, to improve productivity, increase sales, enhance transport efficiency, and reduce costs.
352A|G-LOIVE
479.0
▼ -3.23%
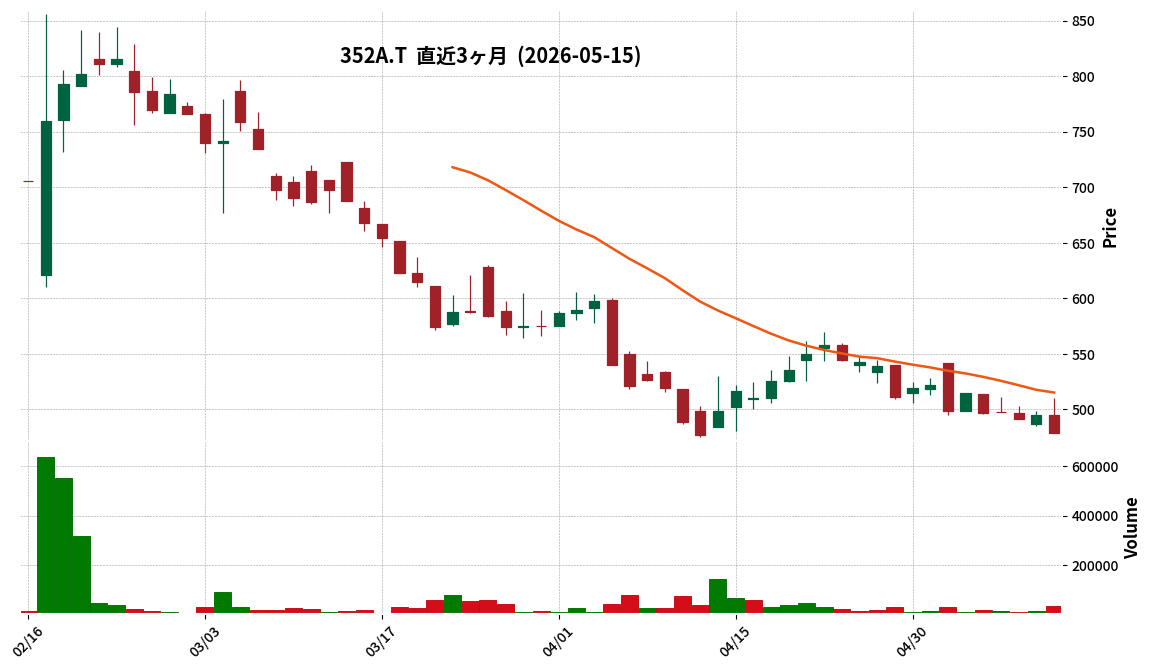
📎 Source:G-LOIVE Official IR →
This article is an AI-generated summary and analysis of official IR disclosures.
📄 Announcement (AI-Reviewed)
- G-LOIVE’s full-year results for the fiscal year ended March 2026 reported record-high net sales of ¥11.421 billion, a 34.5% increase year-on-year.
- Operating profit was ¥722 million (down 28.1% YoY) and net profit was ¥343 million (down 31.4% YoY).
- The total number of stores expanded to 200, with Pilates K opening 45 new stores.
- By brand, the Pilates K business saw significant growth of 70.0% year-on-year, reaching ¥6.606 billion, securing the second-largest market share.
- Merchandise sales ratio increased to 7.6% (up 0.8 percentage points YoY), and the member retention rate remained high at 95.9%.
🤖 AI Perspective
The record-high revenue, particularly driven by the Pilates K business, may suggest that the aggressive store expansion and market positioning strategies are yielding results. However, the decrease in operating profit due to increased selling, general, and administrative expenses from strategic investments could indicate a focus on long-term growth over short-term profitability. The improvement in financial health might suggest a balanced approach between growth investments and strengthening the financial foundation.
3769|GMOPG
7274.0
▲ +3.96%
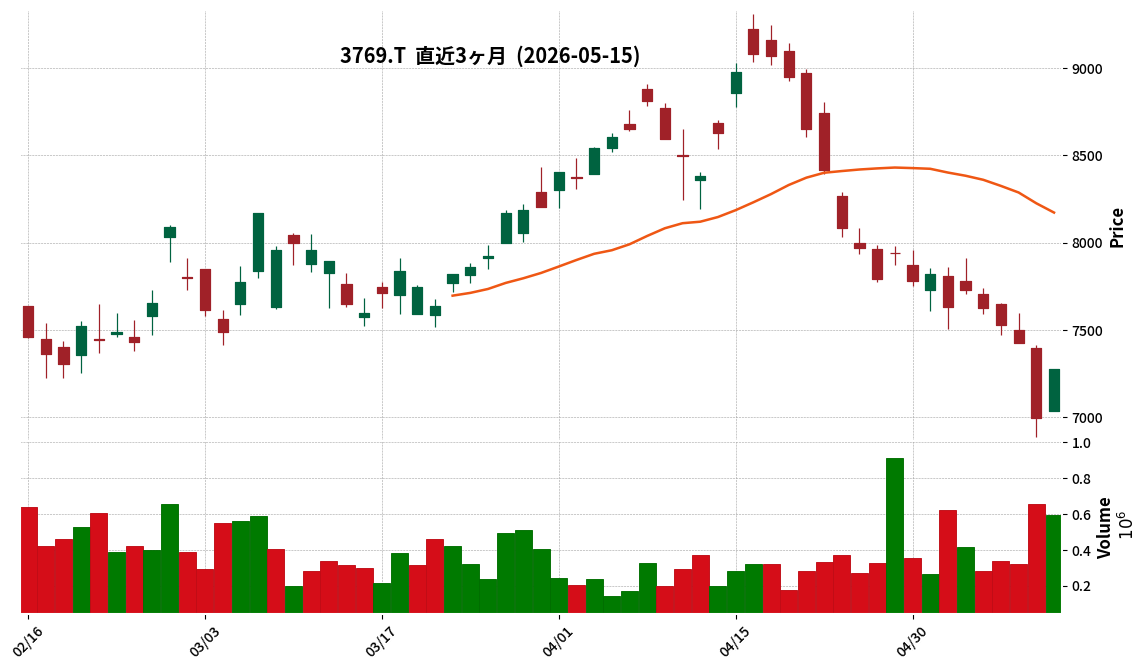
This article is an AI-generated summary and analysis of official IR disclosures.
📄 Announcement (AI-Reviewed)
- GMO Payment Gateway, Inc. (3769) has announced its consolidated financial results for the second quarter (interim) of the fiscal year ending September 2026.
- For the interim period, revenue reached ¥46,084 million, marking a 13.1% increase compared to the same period last year.
- Operating profit for the period was ¥18,792 million, up 22.7% year-on-year.
- Profit attributable to owners of the parent increased by 22.3% year-on-year to ¥12,042 million.
- By segment, Payment Processing Services recorded revenue of ¥34,187 million (+12.3% YoY), and Financial-related Services recorded revenue of ¥11,108 million (+16.8% YoY).
- The consolidated full-year earnings forecast and dividend forecast for the fiscal year ending September 2026 remain unchanged from the most recently publicly announced figures.
🤖 AI Perspective
The company’s interim results demonstrate robust performance with double-digit growth across revenue and profit metrics, indicating a strong operational period. The continued growth in both Payment Processing Services and Financial-related Services segments appears to be a key driver for this positive trend. The unchanged full-year forecast suggests that management is confident in maintaining this trajectory for the remainder of the fiscal year.
4051|GMO-FG
5570.0
▼ -0.54%
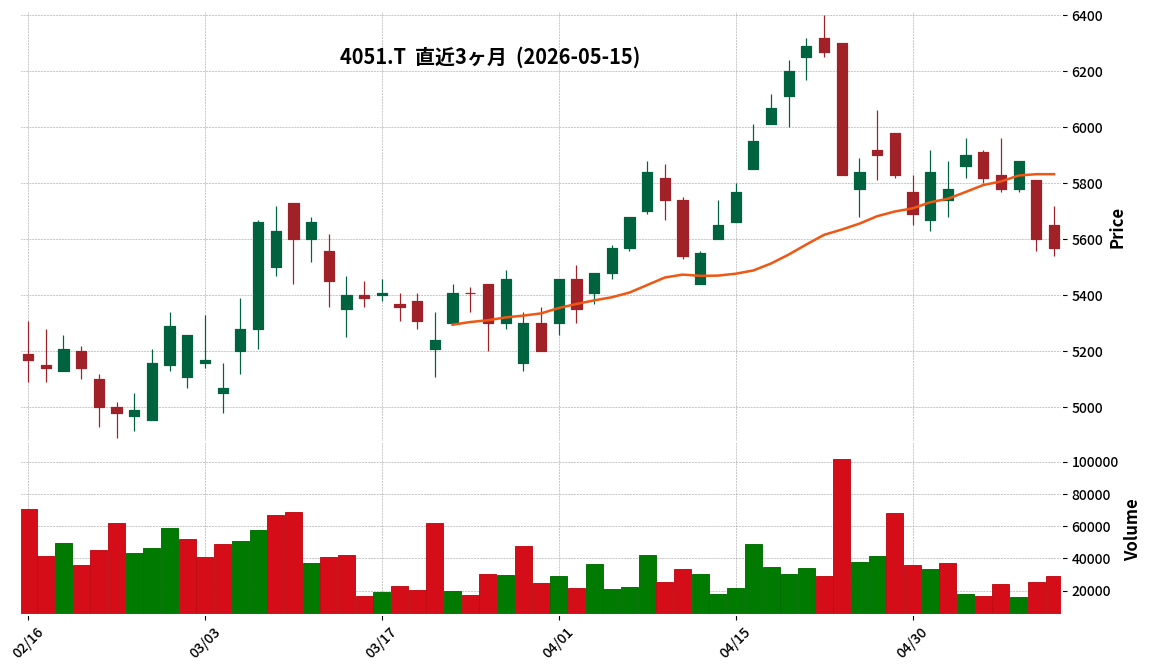
This article is an AI-generated summary and analysis of official IR disclosures.
📄 Announcement (AI-Reviewed)
- For the second quarter of the fiscal year ending September 2026, consolidated revenue reached ¥10,515 million, representing a 16.2% increase compared to the prior interim period.
- Consolidated operating profit was ¥1,559 million, an increase of 12.8% year-over-year for the interim period.
- Interim profit attributable to owners of the parent company amounted to ¥1,049 million, a 1.5% increase from the prior interim period.
- The forecast for the annual dividend for the fiscal year ending September 2026 remains at ¥125.00 (total), with no revisions from the most recently published forecast.
- The full-year consolidated earnings forecast (revenue ¥19,730 million, operating profit ¥2,800 million, profit attributable to owners of the parent company ¥1,870 million) remains unchanged from the most recently published forecast.
- During this interim consolidated accounting period, recurring revenue increased by 29.9% to ¥5,228 million compared to the prior interim period, and initial revenue increased by 5.3% to ¥5,286 million.
🤖 AI Perspective
GMO Financial Gate achieved an increase in both revenue and profit for the second quarter of fiscal year 2026, driven by growth in payment processing volume and GMV. The significant growth in recurring revenue suggests a strengthening of the company’s stable revenue base, which could be a key point for investors to monitor. The unchanged full-year earnings and dividend forecasts may indicate that the company perceives its current progress to be in line with its initial plans.
Disclaimer: This article is for informational purposes only and does not constitute investment advice.
9449|GMO
3079.0
▼ -0.39%
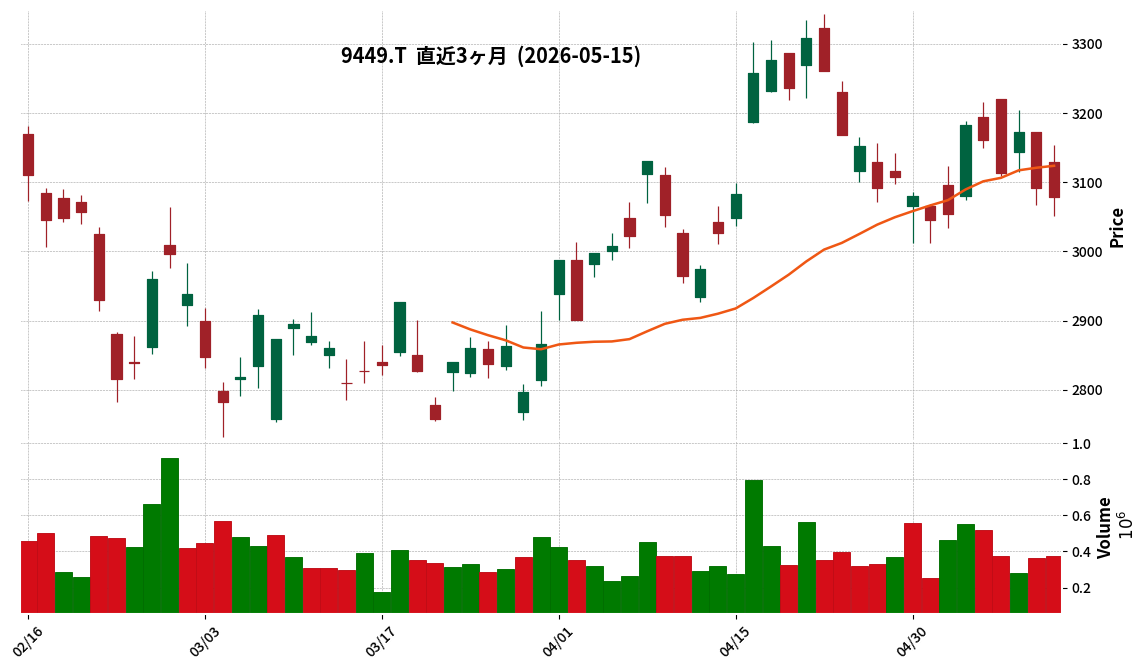
This article is an AI-generated summary and analysis of official IR disclosures.
📄 Announcement (AI-Reviewed)
- GMO Internet Group, Inc. announced its consolidated financial results for the first quarter of the fiscal year ending December 2026 (January 1, 2026 to March 31, 2026).
- Revenue increased by 13.3% year-on-year to ¥81,604 million.
- Business profit grew by 32.0% year-on-year, reaching ¥19,387 million.
- Profit attributable to owners of the parent company increased by 13.5% year-on-year to ¥6,353 million.
- By segment, the Internet Infrastructure segment reported revenue of ¥47,735 million (+11.8% YoY) and business profit of ¥12,323 million (+24.3% YoY). The Internet Financial segment recorded revenue of ¥14,311 million (+37.1% YoY) and business profit of ¥6,597 million (+79.9% YoY).
- The consolidated earnings forecast and dividend forecast for the fiscal year ending December 2026 are undisclosed due to the difficulty in forecasting market conditions such as economic situations, financial markets, and crypto assets.
🤖 AI Perspective
GMO Internet Group’s Q1 FY2026 results show strong growth in both revenue and business profit, significantly outperforming the prior year period. This performance was primarily driven by the robust contributions from its Internet Infrastructure and Internet Financial segments. However, the decline in the Crypto Assets segment’s revenue and profit, coupled with the non-disclosure of the full-year earnings forecast, may suggest that the company acknowledges ongoing market uncertainties influencing its business outlook.
153A|G-カウリス
1770.0
▲ +3.45%
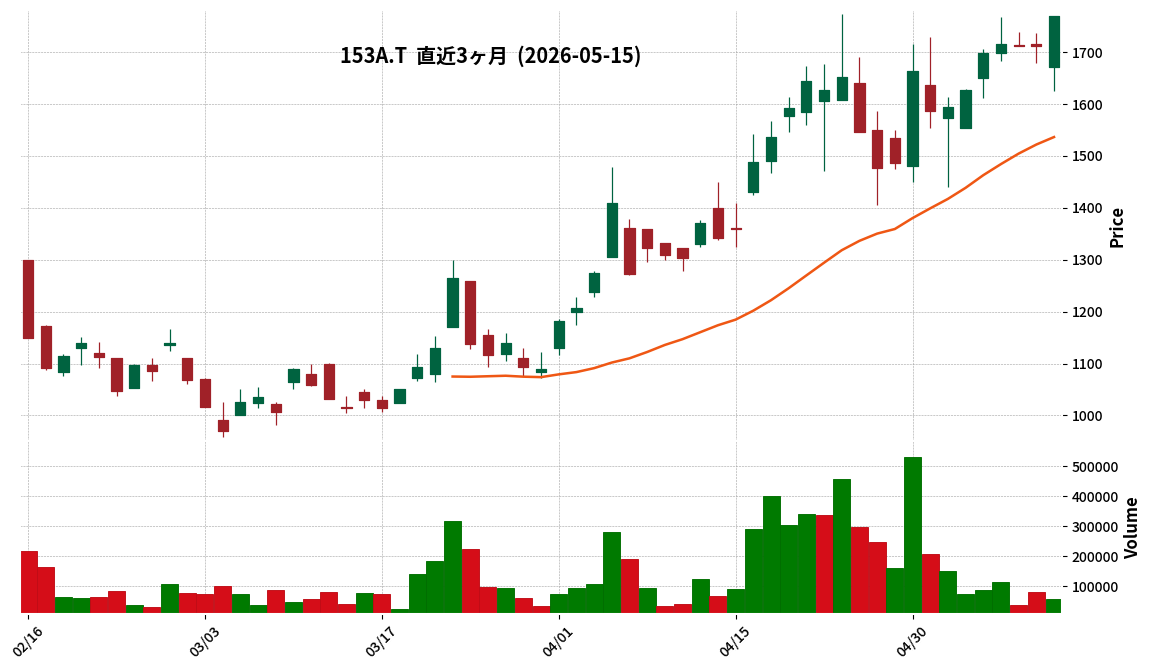
This article is an AI-generated summary and analysis of official IR disclosures.
📄 Announcement (AI-Reviewed)
- G-Caulis announced its financial results for the first quarter of the fiscal year ending December 2026 (January 1, 2026 to March 31, 2026).
- For Q1, net sales were ¥400 million (up 22.4% year-on-year), operating profit was ¥129 million (up 33.9% year-on-year), ordinary profit was ¥131 million (up 35.6% year-on-year), and quarterly net profit was ¥82 million (up 28.2% year-on-year).
- Basic earnings per share were ¥12.72, and diluted earnings per share were ¥12.36.
- As of the end of Q1, total assets stood at ¥2,003 million, net assets at ¥1,557 million, and the equity ratio at 77.7%.
- The full-year dividend forecast for the fiscal year ending December 2026 remains unchanged from the previous forecast, with an expected year-end dividend of ¥5.50, totaling ¥5.50.
- The full-year consolidated earnings forecast for the fiscal year ending December 2026 remains unchanged, projecting net sales of ¥1,570 million (up 12.1% year-on-year), operating profit of ¥411 million (up 0.7% year-on-year), ordinary profit of ¥417 million (up 1.7% year-on-year), net profit of ¥282 million (up 2.0% year-on-year), and earnings per share of ¥43.20.
- Upselling to existing securities firm clients for the main service “Fraud Alert” contributed significantly to MRR (Monthly Recurring Revenue), which reached ¥129,170 thousand (up 24.3% year-on-year).
- The new business “Grid Data KYC” initiated a Proof of Concept (PoC) with one new company.
- Development for infrastructure reconstruction aimed at reducing server costs was completed in March, ahead of schedule, contributing positively to profits.
🤖 AI Perspective
G-Caulis’s first-quarter results show robust double-digit growth in both sales and profit, primarily driven by upselling to existing clients for its core “Fraud Alert” service. The commencement of a PoC for the new “Grid Data KYC” business and early completion of infrastructure reconstruction for cost reduction could suggest positive momentum for future profitability. The company’s progress towards its full-year guidance and further developments in client acquisition and business expansion will be worth monitoring.
1716|第一カッター
1401.0
▲ +0.72%
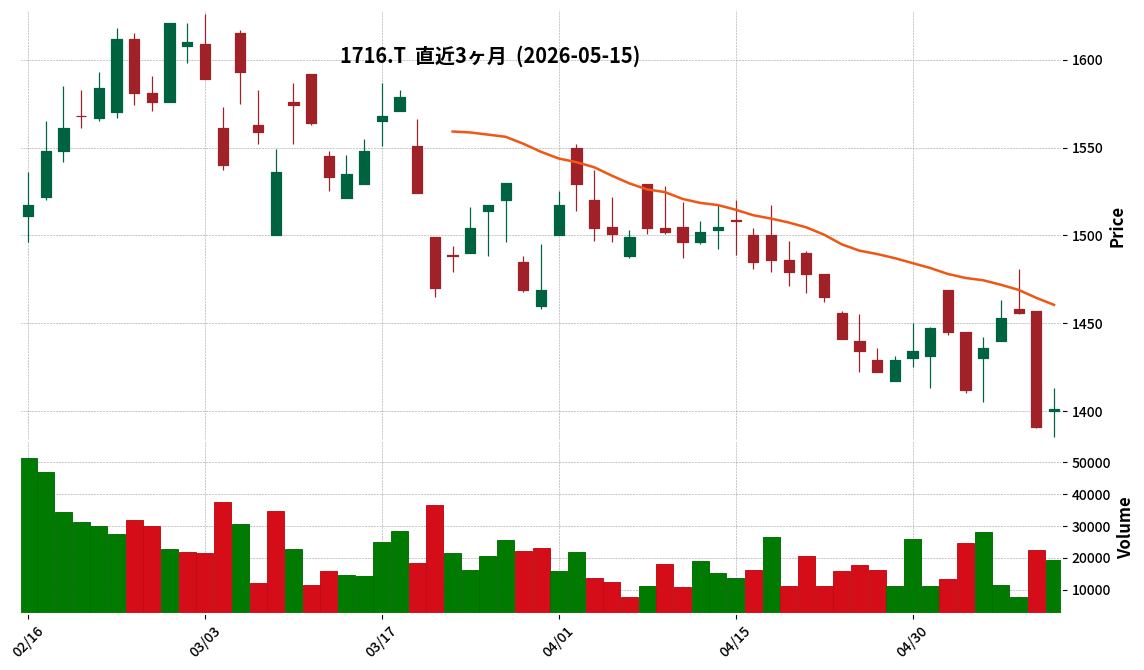
This article is an AI-generated summary and analysis of official IR disclosures.
📄 Announcement (AI-Reviewed)
- Daiichi Cutter Kogyo Co., Ltd. announced its consolidated financial results for the third quarter of the fiscal year ending June 2026 (July 1, 2025 – March 31, 2026).
- Consolidated net sales reached ¥15,648 million, a 3.0% increase year-on-year.
- Consolidated operating profit was ¥1,774 million (up 28.6% YoY), and consolidated ordinary profit was ¥1,967 million (up 32.5% YoY).
- Net profit attributable to owners of the parent significantly increased to ¥1,529 million (up 49.4% YoY).
- Basic earnings per share for the quarter were ¥136.00.
- The full-year consolidated earnings forecast for the fiscal year ending June 2026 remains unchanged from the most recently announced figures: net sales ¥20,500 million, operating profit ¥1,925 million, ordinary profit ¥2,055 million, and net profit attributable to owners of the parent ¥1,643 million.
- By segment, the Cutting and Coring Construction business reported completed construction revenue of ¥15,162 million (up 2.9% YoY) and segment profit of ¥2,625 million (up 17.8% YoY). The Building Maintenance business reported completed construction revenue of ¥486 million (up 5.2% YoY) but a segment profit of ¥38 million (down 24.2% YoY).
🤖 AI Perspective
Daiichi Cutter’s Q3 FY2026 results show growth across sales and profit metrics, with a notable increase in net profit attributable to owners of the parent, which may suggest improved operational efficiency. The robust performance of the Cutting and Coring Construction business appears to be a key driver for overall results, while the Building Maintenance segment’s increase in revenue but decrease in profit is worth monitoring as part of the company’s future business strategy.
1376|カネコ種苗
1412.0
▼ -0.28%
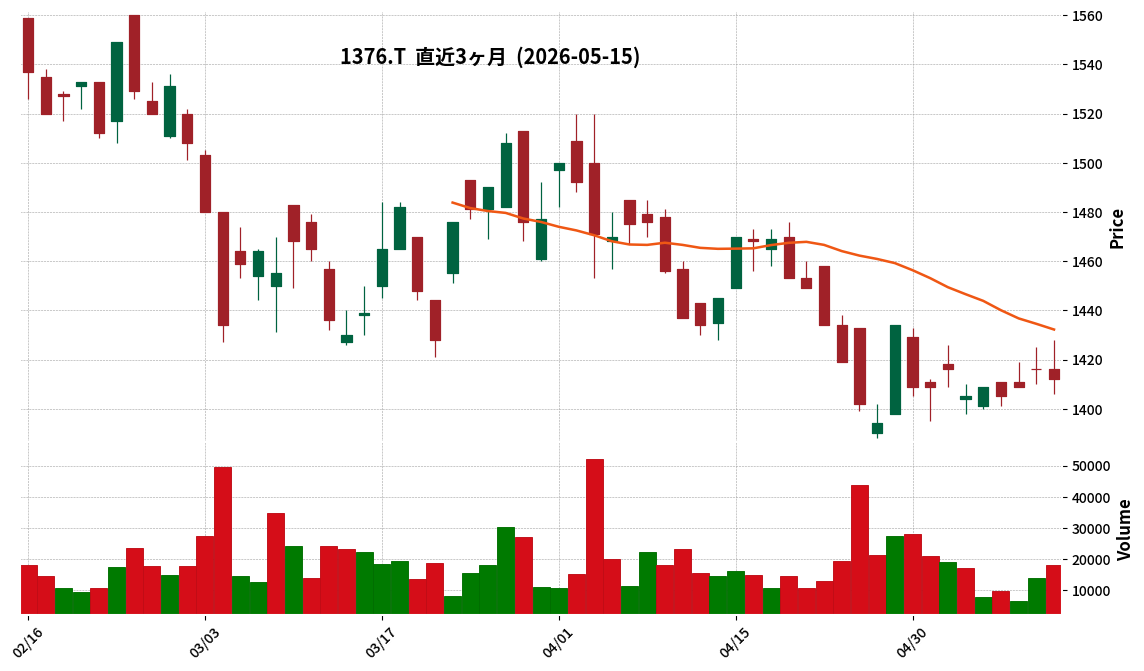
This article is an AI-generated summary and analysis of official IR disclosures.
📄 Announcement (AI-Reviewed)
- Kaneko Seeds Co., Ltd. resolved to revise (increase) its year-end dividend forecast for the fiscal year ending May 31, 2026, at a Board of Directors meeting held on May 15, 2026.
- The year-end dividend forecast for May 2026 has been revised to ¥37.00 per share, an increase of ¥10.00 from the previous forecast of ¥27.00.
- This revision results in a projected total annual dividend of ¥48.00 per share for the current fiscal year, combining the revised year-end dividend with the already distributed interim dividend of ¥11.00.
- The previous total annual dividend forecast (announced July 11, 2025) was ¥38.00.
- The company stated that the revision was made to return profits to shareholders, based on a comprehensive consideration of recent business performance trends, financial position, and capital efficiency.
🤖 AI Perspective
This upward revision to the year-end dividend forecast aligns with the company’s stated shareholder return policy, which includes maintaining a dividend payout ratio of 30% or more. This move may be seen by investors as a positive indication of the company’s commitment to shareholder value, as outlined in its medium-term management plan. The underlying financial health and performance trends of the company could be a contributing factor to this decision.
2498|オリコンHD
2977.0
▼ -1.26%
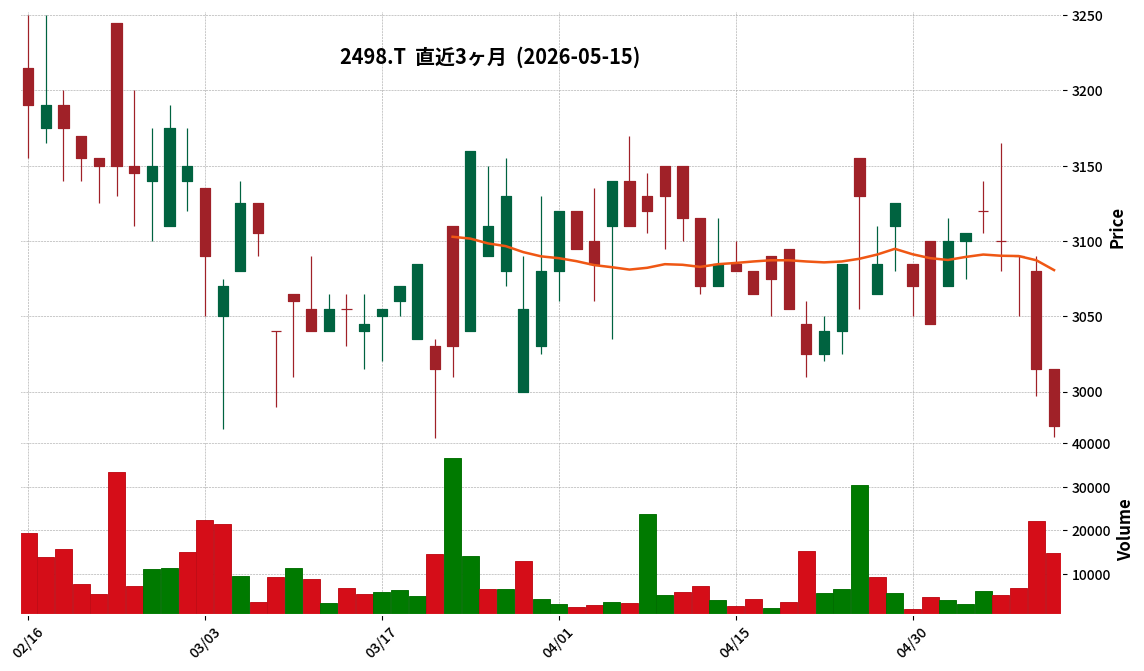
This article is an AI-generated summary and analysis of official IR disclosures.
📄 Announcement (AI-Reviewed)
- Oricon HD announced its consolidated financial results for the second quarter (interim) of the fiscal year ending September 2026.
- Consolidated net sales reached ¥49,046 million, a 5.9% increase compared to the same period of the previous fiscal year.
- Consolidated operating profit was ¥4,620 million (up 15.6% YoY), and ordinary profit was ¥5,121 million (up 21.4% YoY).
- Net profit attributable to owners of parent was ¥3,500 million, marking a 22.1% increase year-over-year.
- Diluted interim earnings per share stood at ¥290.62.
- The consolidated full-year earnings forecast remains unchanged from the announcement on November 14, 2025.
5983|イワブチ
14800.0
▲ +3.57%
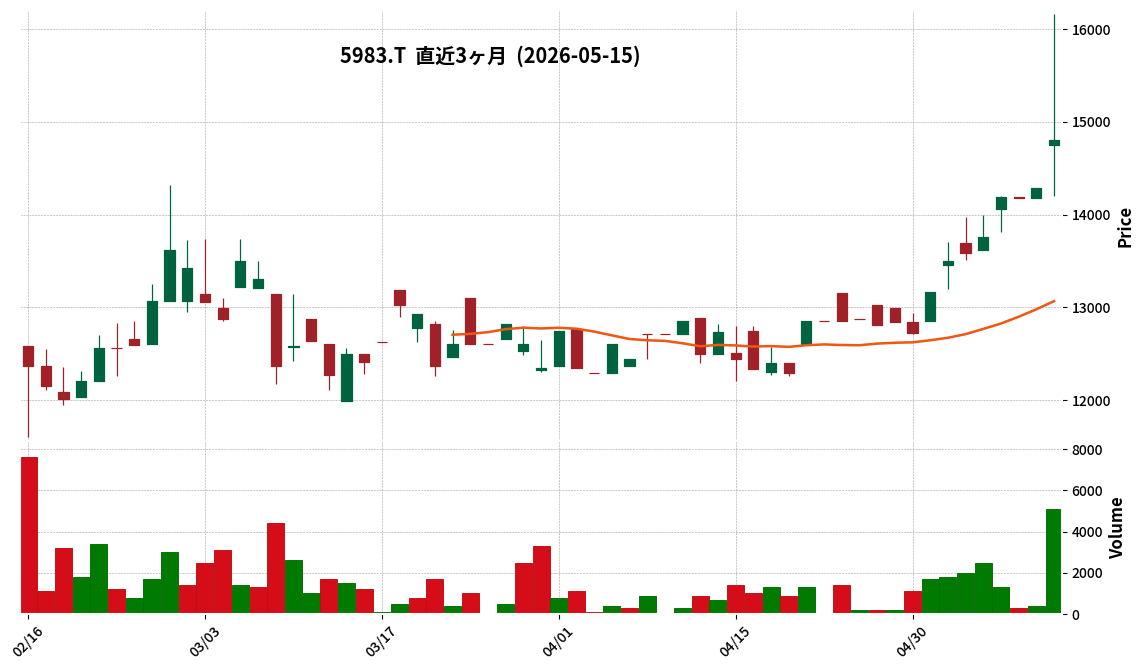
This article is an AI-generated summary and analysis of official IR disclosures.
📄 Announcement (AI-Reviewed)
- Iwabuchi Corporation has announced its consolidated financial results for the fiscal year ended March 2026.
- Net sales for the period reached ¥13,528 million, representing a 7.0% increase year-over-year.
- Operating profit was ¥1,456 million (+65.8% YoY), ordinary profit was ¥1,537 million (+60.2% YoY), and net profit attributable to owners of parent was ¥940 million (+34.5% YoY).
- The annual dividend for the fiscal year ended March 2026 is ¥300.00 per share (previous year: ¥250.00), consisting of a regular dividend of ¥270.00 and a 75th-anniversary commemorative dividend of ¥30.00.
- For the fiscal year ending March 2027, the company forecasts consolidated net sales of ¥13,545 million (+0.1% YoY), operating profit of ¥935 million (-35.8% YoY), ordinary profit of ¥1,067 million (-30.6% YoY), and net profit attributable to owners of parent of ¥681 million (-27.6% YoY).
🤖 AI Perspective
Iwabuchi delivered substantial profit growth across all key metrics for the fiscal year ended March 2026, with operating profit increasing by a notable 65.8%. This strong performance suggests improved operational efficiency or favorable market conditions during the period. However, the company’s forecast for the fiscal year ending March 2027 indicates a significant decline in profits despite a slight increase in sales, which may warrant investor attention regarding the sustainability of its growth drivers or potential headwinds. While the increased dividend, including a commemorative payout, demonstrates a commitment to shareholder returns, the projected downturn in future profitability could be a point of consideration for investors.
6637|寺崎電気
3825.0
▲ +2.00%
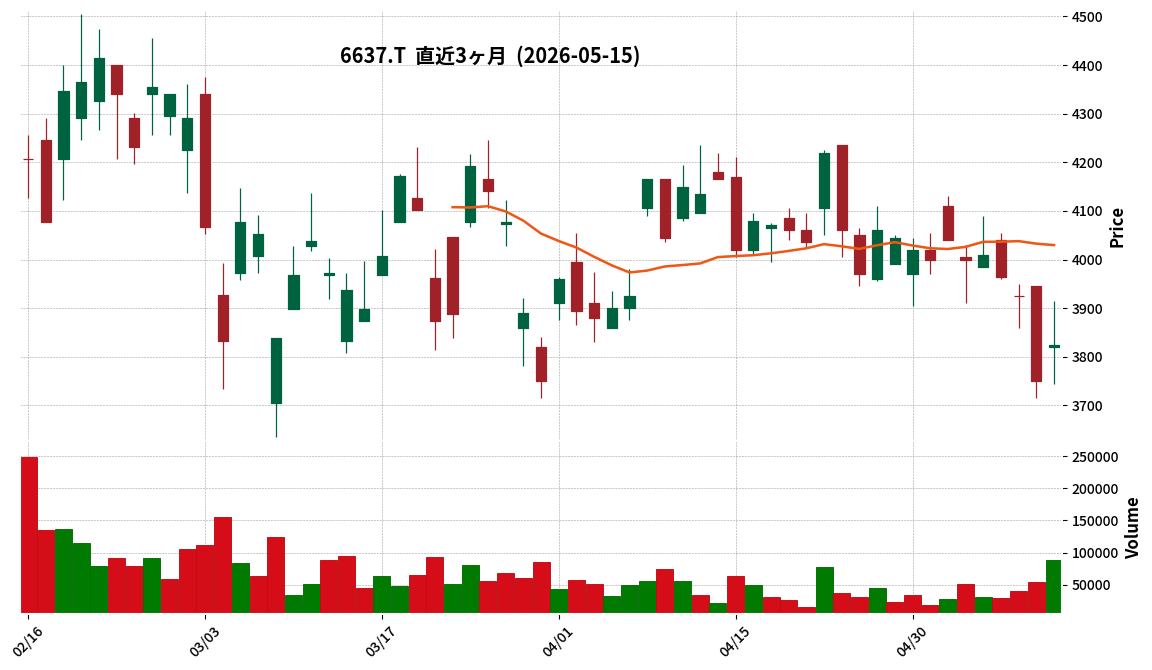
This article is an AI-generated summary and analysis of official IR disclosures.
📄 Announcement (AI-Reviewed)
- Terasaki Electric’s consolidated net sales for the fiscal year ended March 2026 were ¥62,858 million, an increase of 11.4% compared to the previous fiscal year.
- Consolidated operating profit for the same period was ¥6,197 million (up 10.3% year-on-year), and ordinary profit was ¥6,515 million (up 7.6% year-on-year).
- Profit attributable to owners of parent decreased by 5.9% year-on-year to ¥4,188 million.
- The annual dividend for the fiscal year ended March 2026 was revised, with the year-end dividend changed from ¥23 to ¥33, resulting in a total annual dividend of ¥53 (compared to ¥40 in the previous year).
- For the fiscal year ending March 2027 (forecast), the company projects consolidated net sales of ¥69,520 million (up 10.6% year-on-year), operating profit of ¥5,730 million (down 7.5% year-on-year), and profit attributable to owners of parent of ¥3,760 million (down 10.2% year-on-year).
🤖 AI Perspective
Terasaki Electric’s FY2026 results show a notable increase in sales and operating profit, indicating continued business expansion. However, the decline in profit attributable to owners of parent, despite the top-line growth, could be a point of focus for investors seeking to understand underlying factors. The increase in the annual dividend and the projected decrease in profit for the next fiscal year are also elements that may warrant closer examination for evaluating the company’s future outlook and strategy.
1783|fantasista
63.0
▼ -1.56%
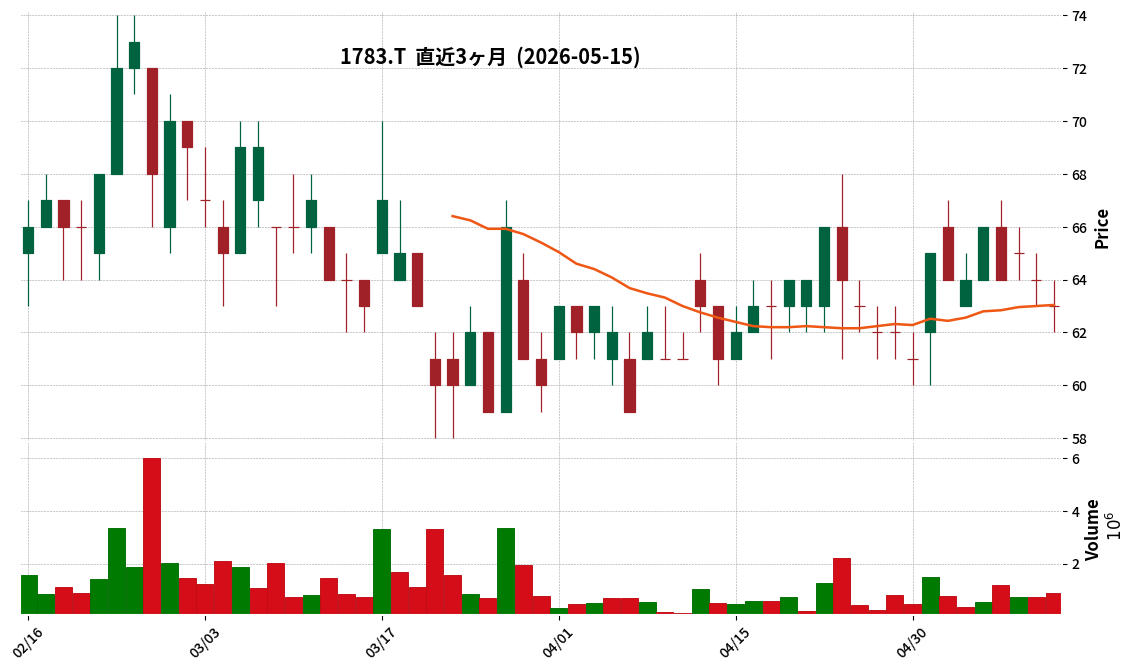
📎 Source:fantasista Official IR →
This article is an AI-generated summary and analysis of official IR disclosures.
📄 Announcement (AI-Reviewed)
- Fantasista’s consolidated results for the second quarter of the fiscal year ending September 2026 show net sales of 1,603 million yen, a 76.5% decrease year-on-year.
- Operating profit increased by 477.3% to 94 million yen, and ordinary profit was 62 million yen (compared to an ordinary loss of 205 million yen in the previous year’s interim period).
- Net loss attributable to owners of the parent company significantly narrowed by 89.1% to 23 million yen.
- The consolidated financial position shows total assets of 9,770 million yen, net assets of 6,667 million yen, and an equity ratio of 67.3%.
- The consolidated full-year forecast for September 2026 remains unchanged, projecting net sales of 10,300 million yen, operating profit of 500 million yen, ordinary profit of 400 million yen, and net profit attributable to owners of the parent company of 280 million yen.
🤖 AI Perspective
Fantasista’s Q2 FY2026 results highlight a substantial improvement in operating and ordinary profits despite a significant decrease in net sales. This turnaround could be attributed to increased high-margin brokerage fees in the real estate business, contributions from hotel operations, and stable electricity sales revenue from the clean energy business. The healthcare segment, however, is in an initial investment phase for new product development, showing an operating loss. The unchanged full-year forecast may suggest the company anticipates a recovery in sales and continued profit generation in the latter half of the fiscal year.
2160|G-GNI
2955.0
▼ -1.99%
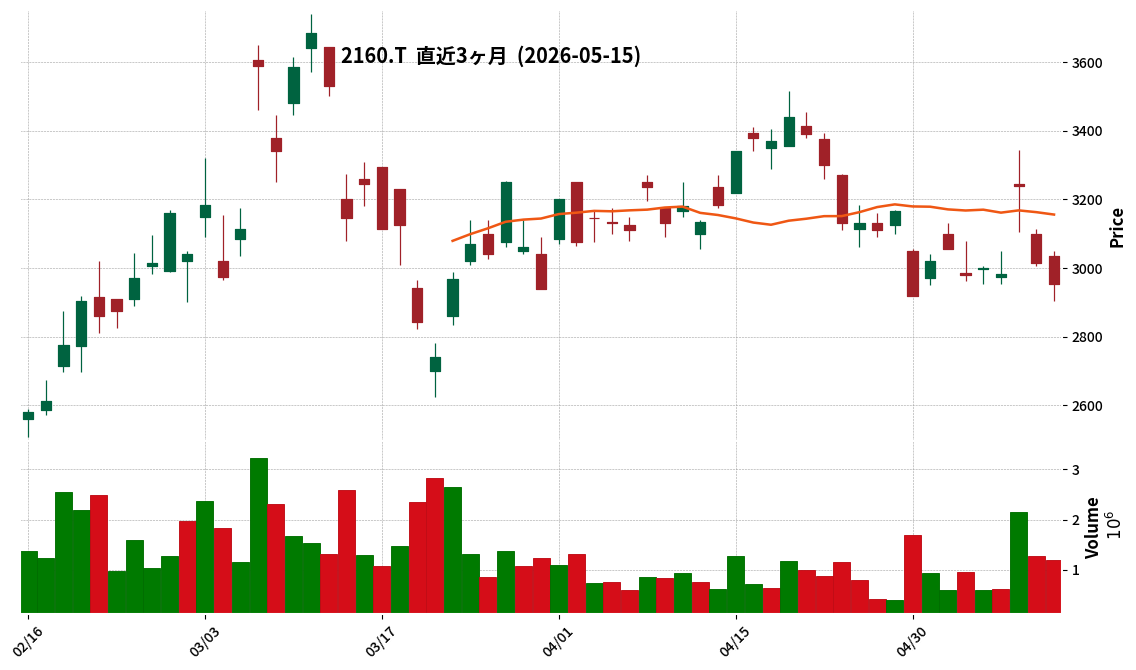
This article is an AI-generated summary and analysis of official IR disclosures.
📄 Announcement (AI-Reviewed)
- For the first quarter of the fiscal year ending December 2026 (January 1, 2026 to March 31, 2026), consolidated revenue was ¥5,526 million, an increase of 3.9% compared to the same period in the previous year.
- Operating loss was ¥2,749 million, loss before tax was ¥3,187 million, and quarterly profit attributable to owners of the parent was ¥2,127 million.
- In the pharmaceutical business, solid sales of the main product, Aisiwei, along with promotional activities for Etorel™ and Contiva™ (launched in the previous period), contributed to a year-on-year increase in revenue.
- Gyre Pharmaceuticals Co., Ltd. submitted a New Drug Application (NDA) for F351, targeting liver fibrosis caused by chronic hepatitis B, to China’s NMPA in March 2026, which was formally accepted in May 2026. F351 has also been designated for priority review.
- The Medtech business achieved its highest-ever first-quarter revenue, with growth driven by existing businesses of Berkeley Advanced Biomaterials LLC and Berkeley Biologics LLC, as well as contributions from ZOO LABO Co., Ltd., consolidated in December 2025.
🤖 AI Perspective
G-GNI’s Q1 FY2026 results show revenue growth, but the company continues to experience losses, likely due to upfront investments. The acceptance of the NDA for F351 in China and its priority review designation represent a significant milestone for future business development in the pharmaceutical segment. The robust performance of the Medtech business, achieving record-high Q1 revenue, also indicates the potential impact of their diversified business strategy on overall revenue growth.
2388|G-ウェッジHD
47.0
▼ -4.08%
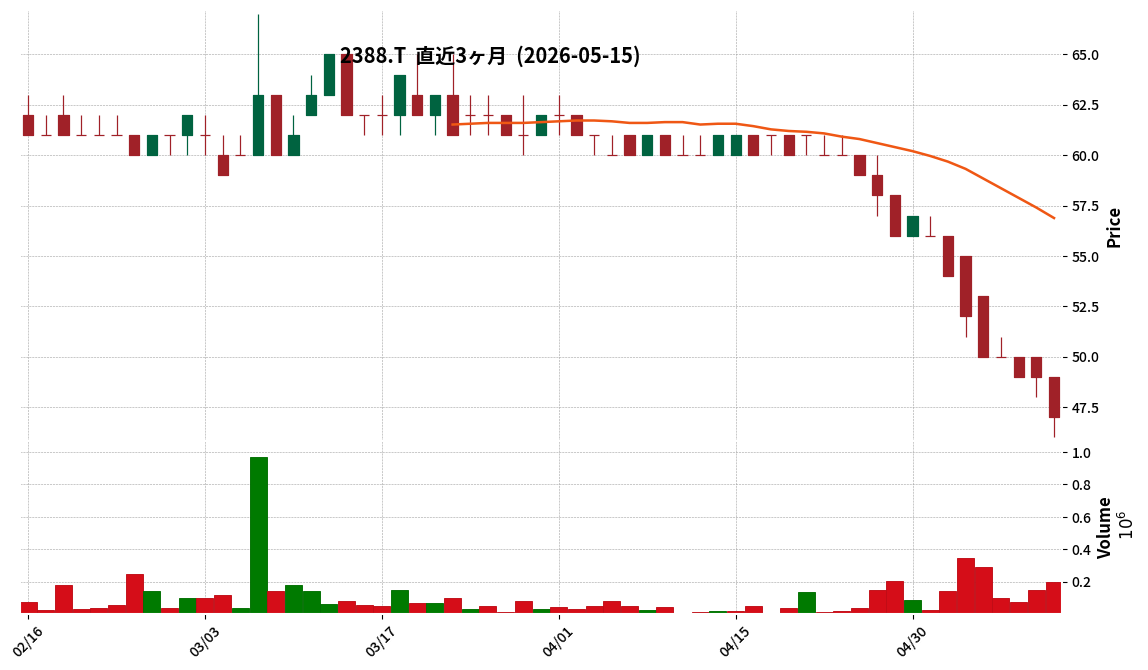
📎 Source:G-ウェッジHD Official IR →
This article is an AI-generated summary and analysis of official IR disclosures.
📄 Announcement (AI-Reviewed)
- G-Wedge HD announced its consolidated financial results for the second quarter (interim) of the fiscal year ending September 2026.
- Net sales reached JPY 524 million, representing a 24.6% increase compared to the prior year’s interim period.
- The company reported an operating loss of JPY 39 million, an ordinary loss of JPY 267 million, and a net loss attributable to parent company shareholders of JPY 285 million.
- The Content Business segment achieved sales of JPY 494 million (up 23.2% year-on-year) and segment profit of JPY 134 million (up 6.4%).
- The Digital Finance business (an equity-method affiliate) recorded sales of JPY 815 million (down 15.4%) and an investment loss of JPY 317 million.
🤖 AI Perspective
While consolidated net sales saw an increase driven by the strong performance of the Content Business, the significant equity-method investment loss from the Digital Finance business appears to have heavily impacted overall profitability. The ongoing costs associated with litigation in the Digital Finance sector are noted as a continuing factor, suggesting that the resolution of these legal matters and the recovery of that business will be crucial for future performance. Investors may monitor how the robust growth in the Content Business contributes to the group’s overall earnings structure going forward.
2585|ライフドリンクC
1253.0
▲ +0.72%
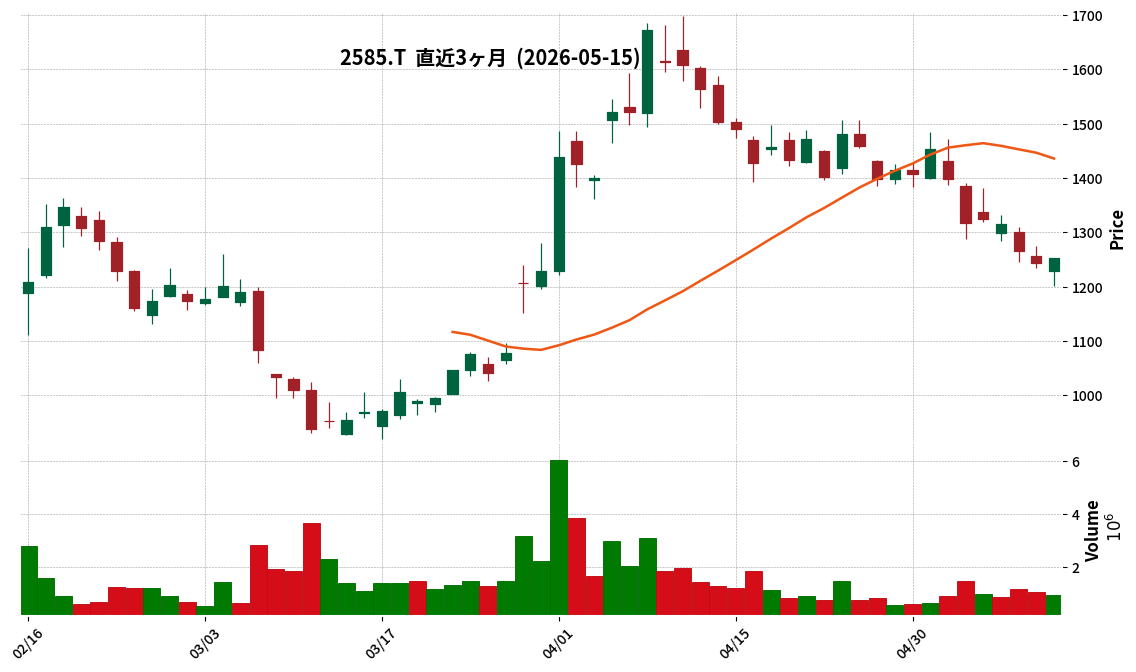
📎 Source:ライフドリンクC Official IR →
This article is an AI-generated summary and analysis of official IR disclosures.
📄 Announcement (AI-Reviewed)
- Lifedrink C announced its consolidated financial results for the fiscal year ended March 2026.
- Sales for FY2026/3 reached ¥52,651 million (up 18.2% year-on-year), operating profit was ¥5,326 million (up 12.3%), ordinary profit was ¥5,196 million (up 10.3%), and profit attributable to owners of parent was ¥3,461 million (up 2.0%).
- The annual dividend for FY2026/3 was ¥14.00 per share, up from ¥12.00 in the previous period.
- For the fiscal year ending March 2027, the company forecasts consolidated sales of ¥72,000 million (up 36.7% year-on-year), operating profit of ¥6,500 million (up 22.0%), and profit attributable to owners of parent of ¥4,200 million (up 21.3%).
- The projected annual dividend for FY2027/3 is ¥15.00 per share.
🤖 AI Perspective
Lifedrink C’s robust performance, marked by significant growth in sales and operating profit, appears to be driven by strategic initiatives such as M&A for production capacity expansion, securing sales channels, internalizing bottle production, and adapting to rising tea leaf prices. The positive forecasts for the next fiscal year, including projected increases in revenue, profit, and dividends, could suggest an expectation of continued sustainable growth.
2597|ユニカフェ
1065.0
▼ -0.19%
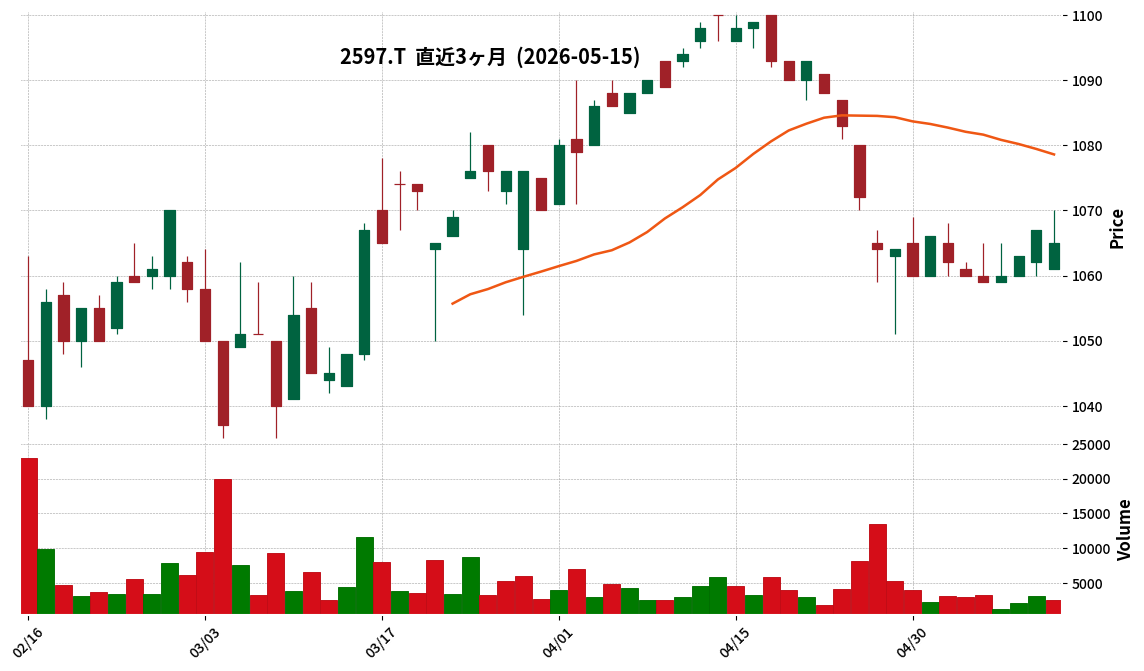
This article is an AI-generated summary and analysis of official IR disclosures.
📄 Announcement (AI-Reviewed)
- Unicafe Corporation announced its consolidated financial results for the first quarter of the fiscal year ending December 2026 (January 1, 2026 – March 31, 2026).
- Consolidated net sales reached ¥4,378 million, marking a 26.6% increase compared to the same quarter of the previous year.
- Consolidated operating profit was ¥258 million (up 32.4% year-on-year), and consolidated ordinary profit was ¥260 million (up 33.5% year-on-year).
- Net profit attributable to owners of the parent company amounted to ¥213 million, an increase of 58.5% year-on-year.
- The full-year consolidated performance forecast and dividend forecast for the fiscal year ending December 2026 remain unchanged from the most recently announced figures.
🤖 AI Perspective
Unicafe’s first-quarter results for the fiscal year ending December 2026 show significant year-over-year growth across net sales and all profit metrics. The substantial 58.5% increase in net profit attributable to owners of the parent company suggests robust business performance during the period. As the full-year forecast remains unchanged, investors may monitor subsequent quarters for further developments relative to these strong Q1 results.
3150|グリムス
2924.0
▼ -0.37%
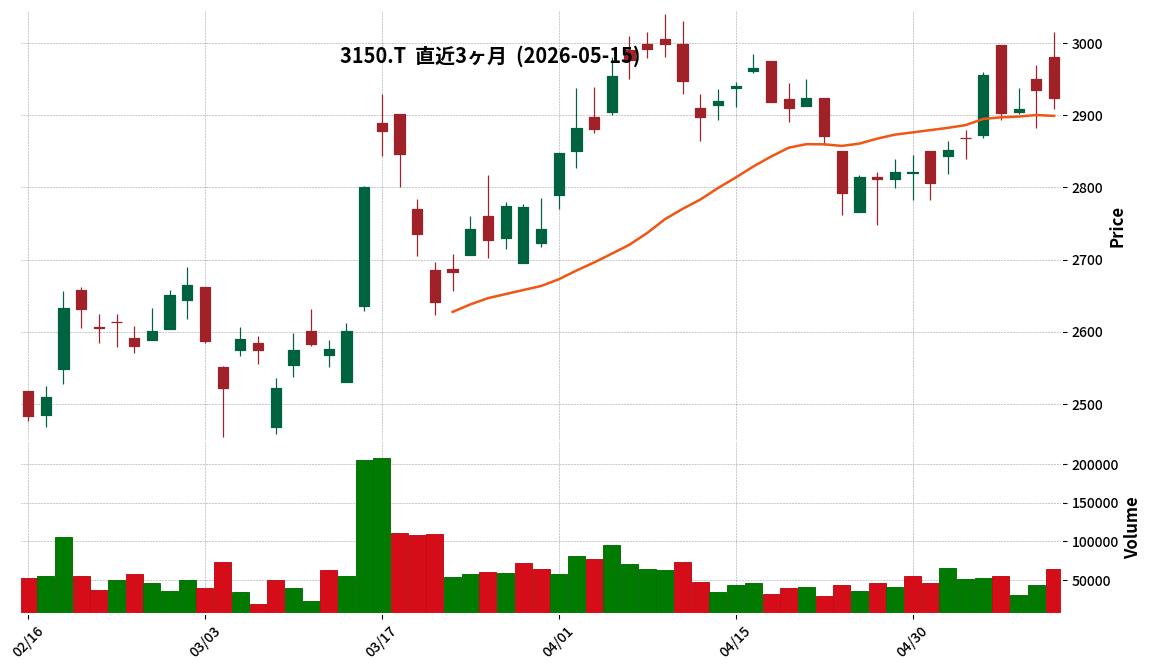
This article is an AI-generated summary and analysis of official IR disclosures.
📄 Announcement (AI-Reviewed)
- Grems’ consolidated financial results for the fiscal year ended March 2026 show net sales of ¥33,936 million (up 1.8% year-on-year), operating profit of ¥7,152 million (up 10.0%), ordinary profit of ¥7,289 million (up 9.7%), and profit attributable to owners of parent of ¥4,896 million (up 7.4%).
- These sales and profit figures represent record highs for the company.
- In the Energy Solution segment, the company focused on commercial solar power generation systems as its main growth driver, expanding sales.
- A special loss of ¥111 million was recorded as business structure improvement expenses due to anticipated declining profitability in sales of residential solar power generation systems and storage batteries to general consumers, shifting focus to corporate sales.
- The consolidated earnings forecast for the fiscal year ending March 2027 projects net sales of ¥37,174 million (up 9.5% year-on-year), operating profit of ¥7,900 million (up 10.5%), ordinary profit of ¥7,928 million (up 8.8%), and profit attributable to owners of parent of ¥5,376 million (up 9.8%).
- The year-end dividend for the fiscal year ended March 2026 was ¥60.00, resulting in an annual dividend of ¥85.00 (compared to ¥79.00 in the previous year). For the fiscal year ending March 2027, an annual dividend of ¥93.00 is forecast.
🤖 AI Perspective
Grems’ fiscal year 2026 results demonstrate robust performance, with record-high sales and profits, driven primarily by the expansion of its commercial solar power generation system business. This suggests that the strategic shift within the Energy Solution segment may be effectively contributing to growth. The projected increase in earnings and dividends for the upcoming fiscal year could be interpreted as the company’s confidence in its future business outlook.
3156|レスター
3465.0
▲ +12.50%
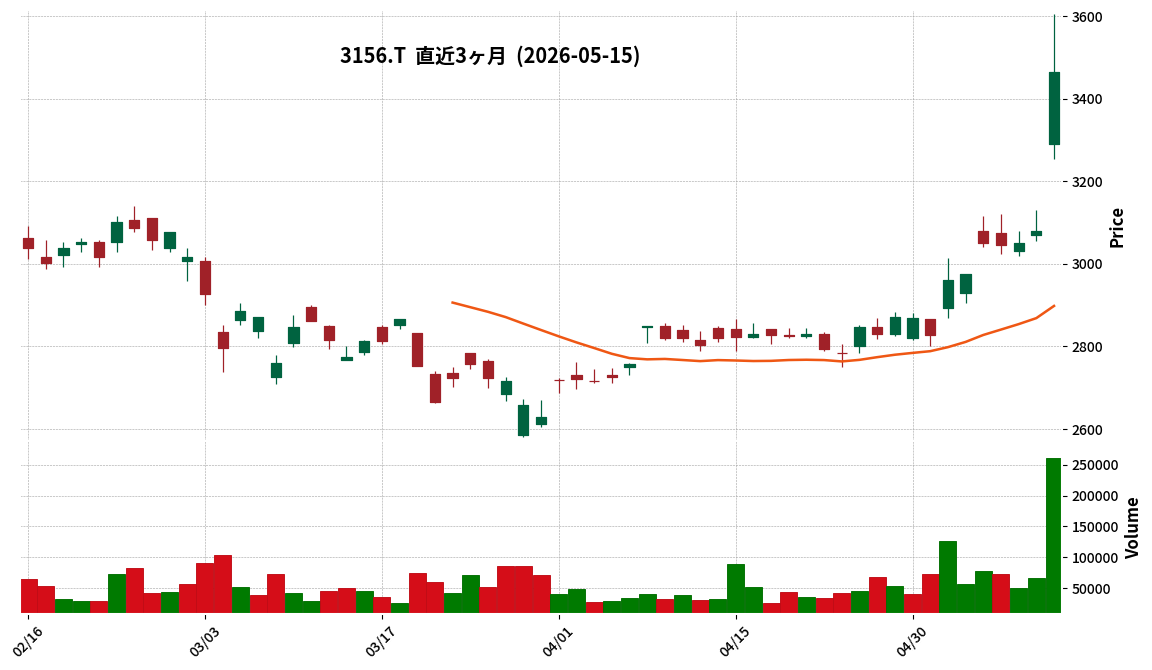
This article is an AI-generated summary and analysis of official IR disclosures.
📄 Announcement (AI-Reviewed)
- Lester Co., Ltd. resolved at its Board of Directors meeting today (May 15, 2026) to enter into an agreement to tender its 1,550,000 shares of Shinko Shoji Co., Ltd. in a tender offer initiated by Kaga Electronics Co., Ltd.
- Concurrently, Lester’s Board also resolved to terminate the capital and business alliance agreement with Shinko Shoji, originally dated October 31, 2024.
- The capital and business alliance is formally dissolved as of May 15, 2026.
- Lester stated that it deemed tendering its Shinko Shoji shares in the tender offer to be a rational decision, given Kaga Electronics’ objective to make Shinko Shoji a wholly-owned subsidiary.
- The impact of the dissolution of the capital and business alliance and the sale of Shinko Shoji shares on Lester’s performance is stated to have been incorporated into its consolidated earnings forecast for the fiscal year ending March 2027, which was announced on May 14, 2026.
🤖 AI Perspective
Lester’s decision to tender its Shinko Shoji shares and dissolve their capital and business alliance suggests a strategic shift in response to industry consolidation. This move appears to be a direct consequence of Kaga Electronics’ tender offer to fully acquire Shinko Shoji. Investors may want to monitor how this realignment impacts the future business strategies and competitive positioning of the involved companies, as such changes can often reshape market dynamics.
3187|G-ミラタップ
243.0
▲ +2.53%
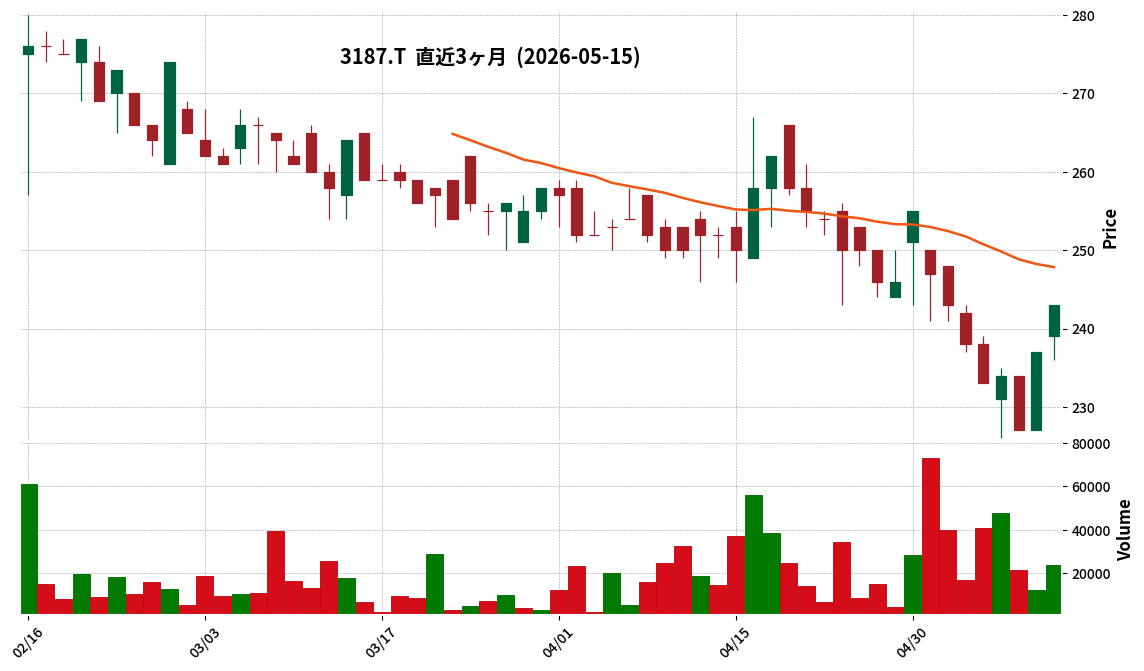
📎 Source:G-ミラタップ Official IR →
This article is an AI-generated summary and analysis of official IR disclosures.
📄 Announcement (AI-Reviewed)
- Miratap Co., Ltd. (3187) announced its Q2 FY2026 financial results (non-consolidated, Japanese GAAP).
- For the interim period, net sales were ¥7,886 million, operating profit ¥269 million, ordinary profit ¥249 million, and net income attributable to owners of the parent ¥211 million.
- The company transitioned to a non-consolidated accounting system from Q1 FY2026 following the sale of all shares in its consolidated subsidiary, Best Bright Co., Ltd., hence no year-over-year comparison rates are provided.
- As of the end of the interim period, total assets stood at ¥9,212 million, net assets at ¥3,074 million, and the equity ratio at 31.0%.
- The full-year forecast for FY2026 includes net sales of ¥17,035 million (up 12.0% year-on-year), operating profit of ¥352 million, ordinary profit of ¥324 million, net income of ¥227 million, and EPS of ¥12.53.
🤖 AI Perspective
G-Miratap’s Q2 FY2026 results mark the first reporting period under a non-consolidated structure following the subsidiary divestiture. The reported net sales of ¥7.886 billion and net income of ¥211 million provide an initial benchmark for assessing the company’s financial performance post-restructuring. Investors may find it noteworthy how the company’s revised strategy on advertising expenses and increased system investments for operational efficiency will impact its profitability and long-term growth trajectory.
3359|G-cotta
508.0
▲ +0.99%
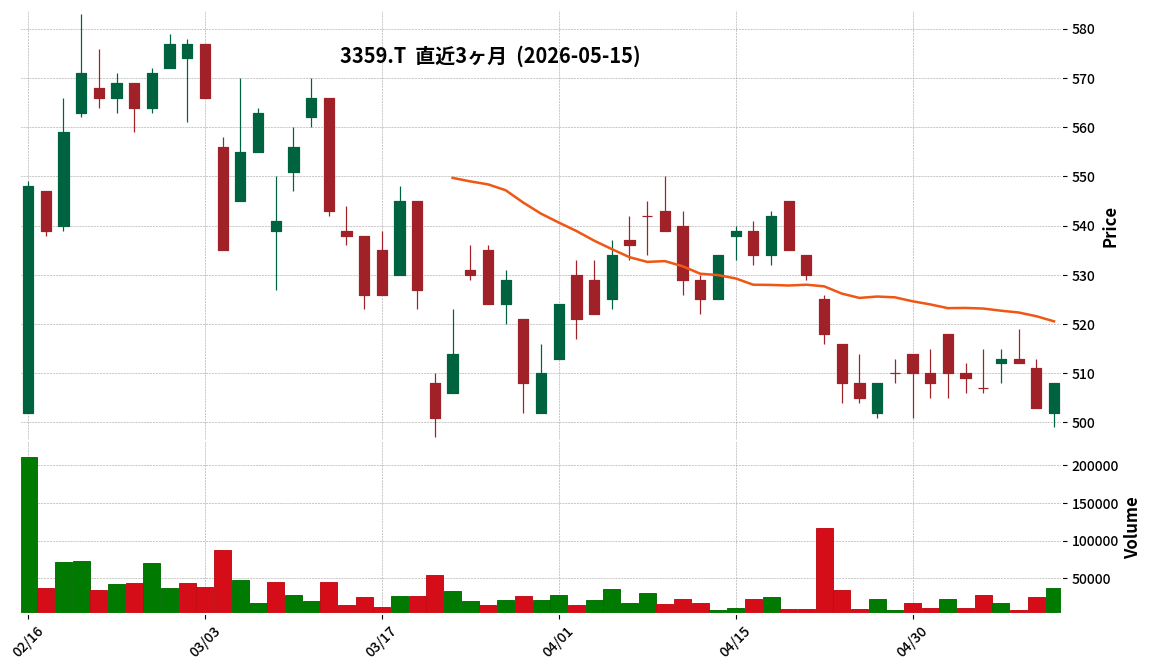
📎 Source:G-cotta Official IR →
This article is an AI-generated summary and analysis of official IR disclosures.
📄 Announcement (AI-Reviewed)
- G-cotta has released its supplementary financial results for the second quarter of the fiscal year ending September 2026.
- Net sales for the period reached ¥8.419 billion, representing a 22.3% increase compared to the prior year’s corresponding period.
- Operating profit stood at ¥647 million, marking a 17.7% rise year-on-year.
- EBITDA was reported at ¥816 million, an increase of 23.9% from the previous year.
- Quarterly net profit attributable to parent company shareholders amounted to ¥368 million, up 4.7% year-on-year.
3469|デュアルタップ
998.0
▼ -0.20%
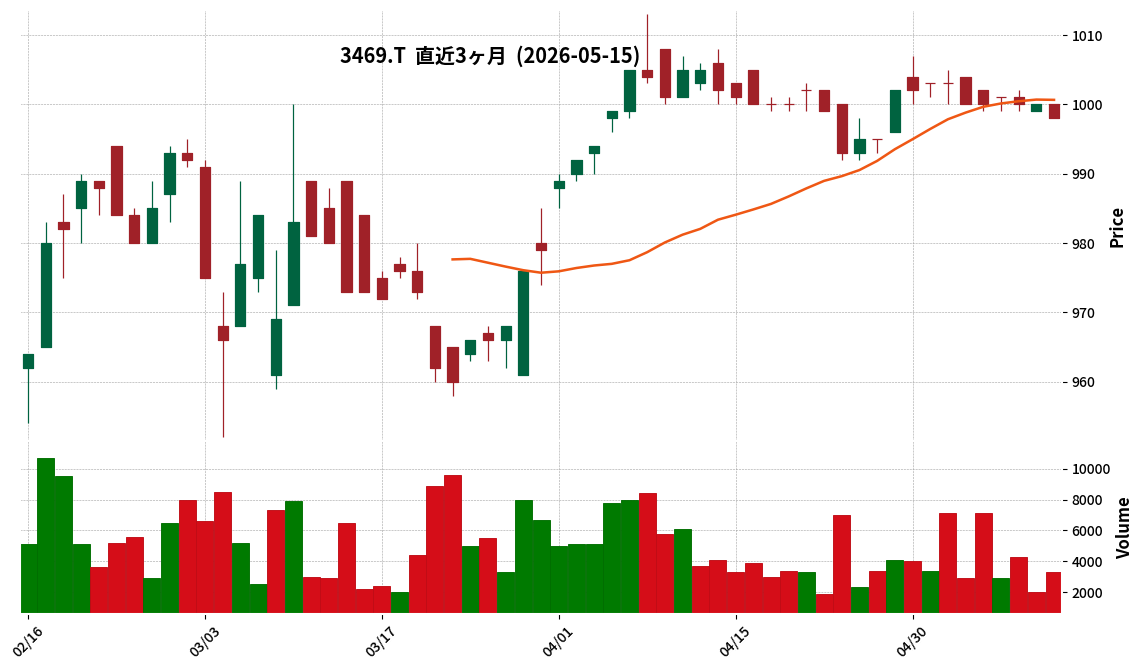
📎 Source:デュアルタップ Official IR →
This article is an AI-generated summary and analysis of official IR disclosures.
📄 Announcement (AI-Reviewed)
- Dualtap Co., Ltd. announced its consolidated financial results for the third quarter of the fiscal year ending June 2026.
- For the cumulative third quarter, net sales totaled ¥4,710 million, representing a 2.7% increase year-over-year.
- Operating profit reached ¥78 million, a significant 904.3% increase from the prior year, and ordinary profit turned positive at ¥22 million (compared to an ordinary loss of ¥40 million in the previous year).
- Profit attributable to owners of parent was ¥1 million, an 86.3% decrease from the previous year.
- The Real Estate Sales segment reported sales of ¥3,544 million (up 1.1%) and a segment profit of ¥44 million (compared to a segment loss of ¥41 million in the previous year).
- The Real Estate Management segment recorded sales of ¥868 million (up 5.0%) and a segment profit of ¥57 million (up 3.9%).
- The Overseas Real Estate segment posted sales of ¥297 million (up 17.4%) and a segment loss of ¥13 million (unchanged from the previous year).
- Asahi Kanri Co., Ltd. was newly added to the scope of consolidation.
🤖 AI Perspective
Dualtap’s Q3 FY2026 results show a modest increase in net sales but a substantial improvement in operating profit and a positive turnaround in ordinary profit, which is a key highlight. This performance appears to be driven by the recovery in the Real Estate Sales segment’s profit and the steady growth of the Real Estate Management segment. However, the decrease in profit attributable to owners of parent and the continued losses in the Overseas Real Estate segment are aspects that warrant ongoing monitoring by investors.
3652|G-DMP
3320.0
▼ -1.04%
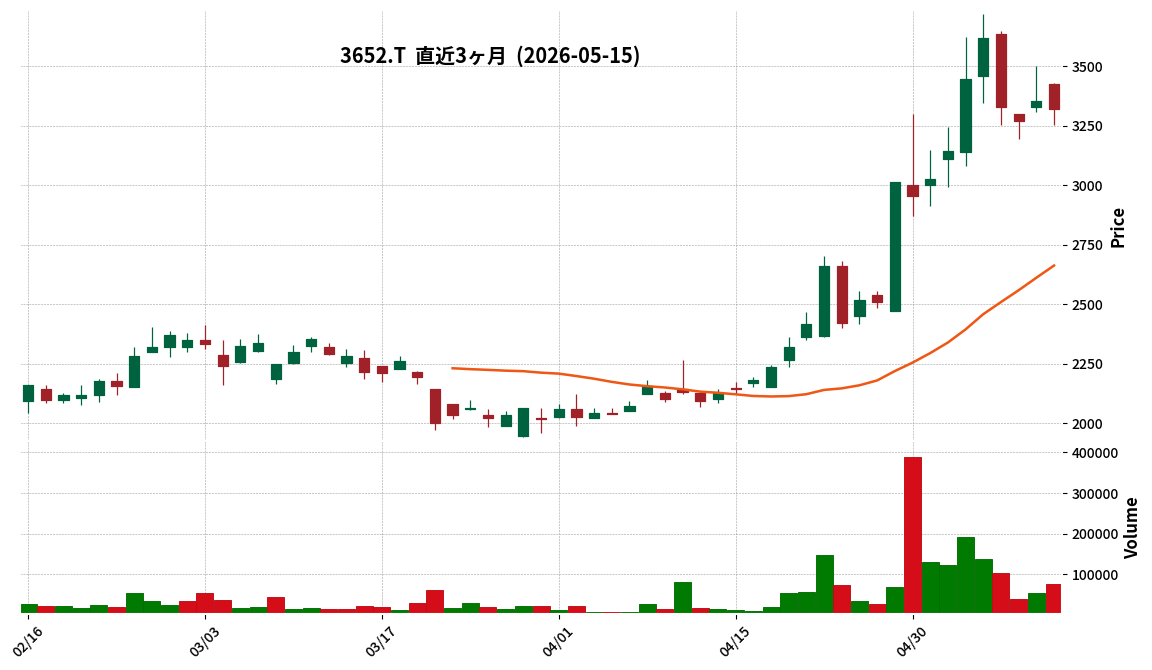
This article is an AI-generated summary and analysis of official IR disclosures.
📄 Announcement (AI-Reviewed)
- For the fiscal year ended March 2026, net sales were ¥2,432 million, a 21.0% decrease from the previous year.
- Operating income was a loss of ¥311 million, ordinary income a loss of ¥293 million, and net income a loss of ¥327 million, marking a shift from profit to loss compared to the prior period.
- Net loss per share was ¥104.28.
- As of March 2026, the equity ratio was 85.3%, and net assets per share were ¥1,038.69.
- For the fiscal year ending March 2027, the company forecasts net sales of ¥3,640 million (a 49.6% increase YoY), operating income of ¥30 million, ordinary income of ¥45 million, and net income of ¥30 million.
🤖 AI Perspective
G-DMP’s FY2026/3 results showed a decline in sales and a shift to losses across key profit metrics. This can be partly attributed to the transition to non-consolidated financial reporting following the cessation and transfer of its consolidated subsidiary. However, the company’s projection of increased revenue and a return to profitability for FY2027/3 suggests an anticipated recovery, making the execution of its future business strategies a key area for investors to monitor.
3667|enish
42.0
▼ -6.67%
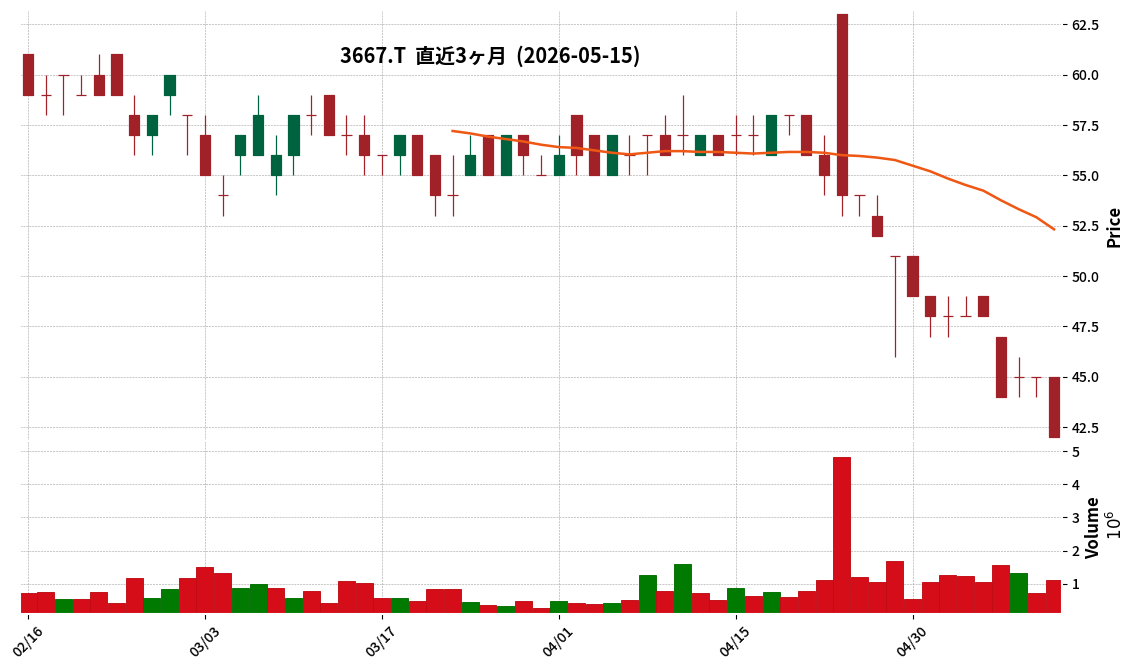
This article is an AI-generated summary and analysis of official IR disclosures.
📄 Announcement (AI-Reviewed)
- enish reported net sales of 476 million yen for Q1 FY2026, marking a 29.3% decrease compared to the same period last year.
- The company recorded an operating loss of 278 million yen, an ordinary loss of 306 million yen, and a net loss for the quarter of 307 million yen. This compares to an operating loss of 146 million yen, an ordinary loss of 156 million yen, and a net loss of 158 million yen in the prior year’s first quarter.
- Sales from existing native app titles continue to decline due to intensified market competition and shifts in user preferences.
- enish plans to release multiple new titles in FY2026, including “Yowamushi Pedal Resonance Pedalism” and “Yuru Camp△ Minna de Wacha Wacha! Camping Cook!”.
- The company intends to propose an amendment to its articles of incorporation at an extraordinary general meeting of shareholders, scheduled for early June 2026, to add business objectives related to investment, operation, acquisition, holding, management, and operation of crypto assets.
🤖 AI Perspective
The decline in sales and expanded losses reflect ongoing challenges within the existing native app portfolio due to competitive market conditions. However, the planned release of multiple new titles and the pursuit of structural reforms, alongside the exploration of new financial strategies involving crypto assets, suggest a multifaceted approach to address these challenges. The impact of these initiatives on future performance may be a key area for investors to monitor.
3670|協立情報通信
1551.0
▲ +0.39%
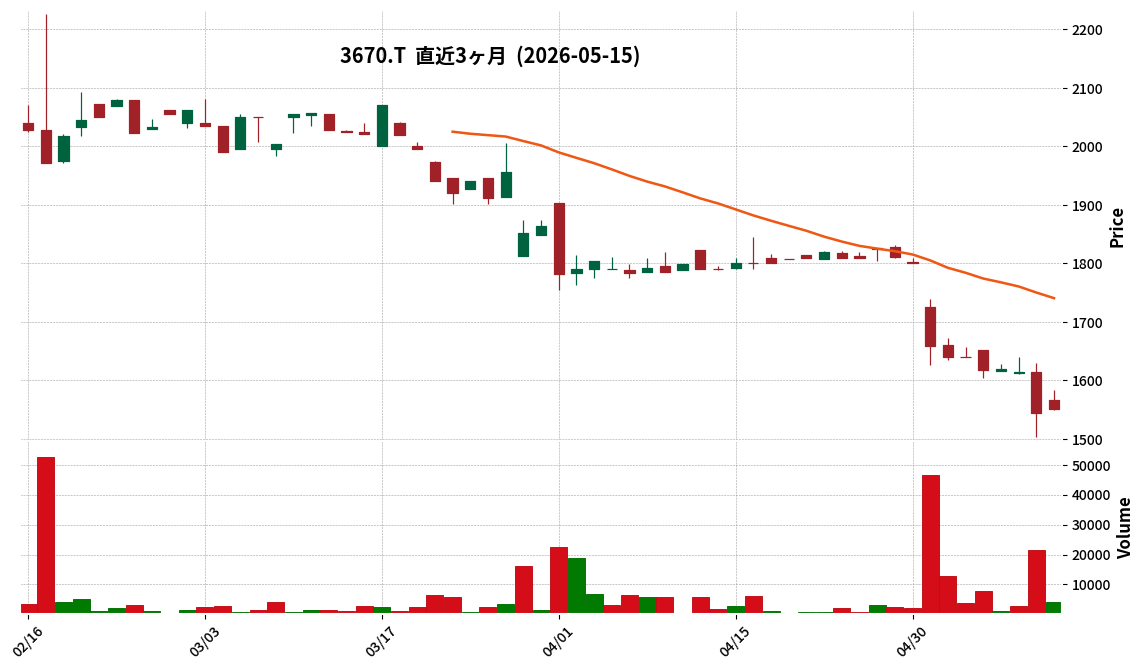
This article is an AI-generated summary and analysis of official IR disclosures.
📄 Announcement (AI-Reviewed)
- Kyoritsu Computer & Communication reported full-year results for the fiscal year ended March 2026: Revenue of JPY 5,140 million (up 14.8% year-on-year), operating profit of JPY 474 million (up 59.0% YoY), ordinary profit of JPY 476 million (up 57.8% YoY), and net profit of JPY 316 million (up 84.0% YoY).
- All full-year performance indicators, including revenue, operating profit, ordinary profit, and net profit, exceeded the initial forecasts.
- Factors contributing to the strong performance include expanded services through cloud migration of core business software and mobile integration, acquisition of incentive and stock revenues, and external factors such as product support and service terminations in various businesses.
- The number of employees at the end of March 2026 was 207, with revenue per employee significantly increasing.
- Regarding the business portfolio, corporate-related sales surpassed consumer-related sales from FY2024, and in FY2026/3, corporate-related sales accounted for 58.9% of the sales composition.
🤖 AI Perspective
Kyoritsu Computer & Communication’s FY2026/3 results indicate substantial growth in both revenue and profit, with an 84.0% increase in net profit being a notable highlight. This strong performance may suggest the successful execution of strategies focusing on digitalization, such as cloud migration and mobile integration, alongside the effective capture of incentive revenues. The ongoing shift towards corporate-related businesses could also be a key factor supporting sustained growth.
3719|AIストーム
203.0
▲ +1.00%
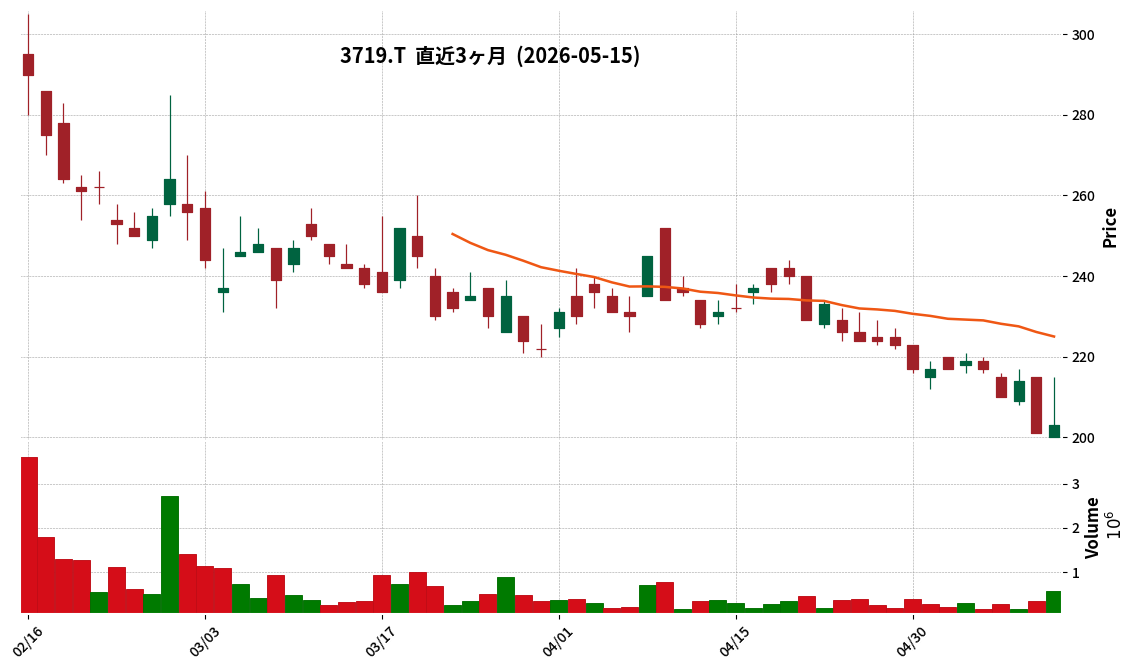
This article is an AI-generated summary and analysis of official IR disclosures.
📄 Announcement (AI-Reviewed)
- AI Storm Inc. announced its financial results for the first quarter of the fiscal year ending December 2026 (January 1, 2026 – March 31, 2026).
- During this first quarter, net sales totaled ¥553.36 million, representing a 30.1% increase compared to the same period of the previous year.
- Operating profit reached ¥133.08 million (up 146.3% year-on-year), ordinary profit was ¥118.73 million (up 138.7% year-on-year), and net income for the quarter was ¥109.52 million (up 105.3% year-on-year).
- By business segment, AI Advisory business reported sales of ¥123.51 million (down 55.3% year-on-year) and operating profit of ¥23.99 million (down 63.8% year-on-year).
- AI & Mortar business recorded sales of ¥424.13 million (up 184.4% year-on-year) and operating profit of ¥195.37 million (up 372.8% year-on-year). The AI New Business segment posted sales of ¥5.67 million and an operating loss of ¥10.04 million.
🤖 AI Perspective
AI Storm achieved significant revenue and profit growth in Q1, primarily driven by the strong performance of its AI & Mortar business, which suggests a successful execution in this segment. The decrease in revenue for the AI Advisory business and the loss in the AI New Business segment may be areas that investors monitor for future developments. The company’s stated intent to pursue business expansion through active capital and business alliances, including M&A, indicates a strategic focus on future growth and restructuring.
3763|プロシップ
1630.0
▲ +2.71%
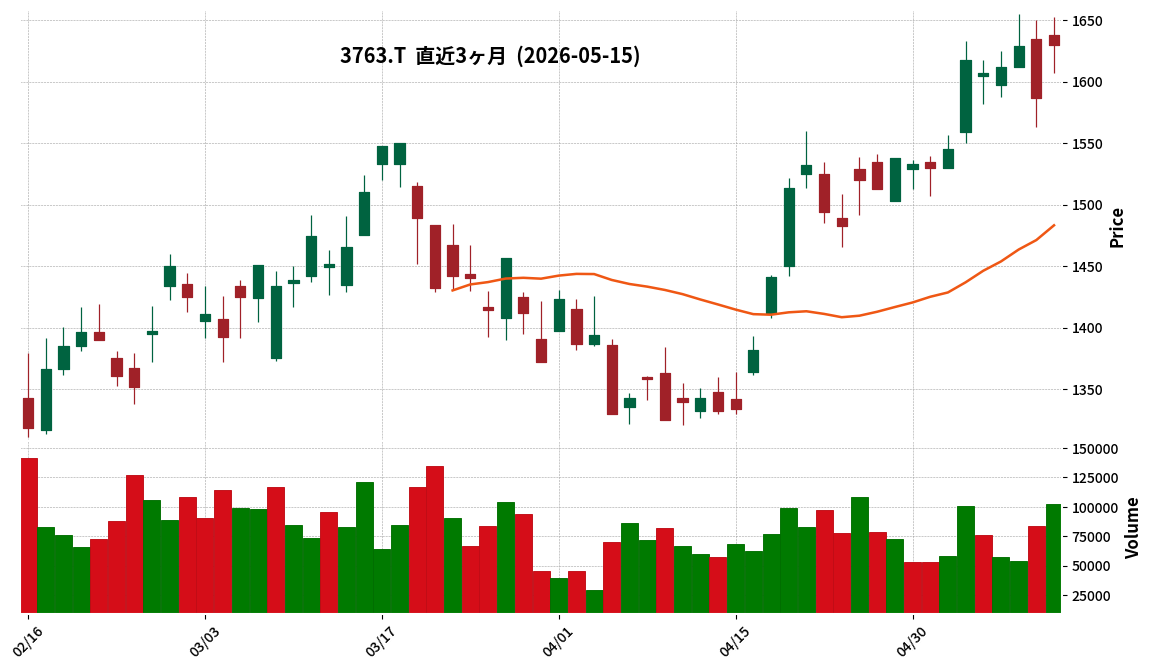
This article is an AI-generated summary and analysis of official IR disclosures.
📄 Announcement (AI-Reviewed)
- ProShip Co., Ltd. announced its consolidated financial results for the fiscal year ended March 31, 2026.
- Consolidated net sales reached ¥8,374 million, marking a 10.7% increase compared to the previous fiscal year.
- Consolidated operating profit was ¥2,925 million, a 26.7% increase year-over-year.
- Net profit attributable to owners of parent increased by 15.2% to ¥2,224 million.
- For the fiscal year ending March 31, 2027, the company forecasts consolidated net sales of ¥10,000 million (up 19.4%), operating profit of ¥3,250 million (up 11.1%), and net profit attributable to owners of parent of ¥2,350 million (up 5.7%).
- The year-end dividend for FY2026 was ¥40.00 (ordinary dividend ¥35.00,記念配当 ¥5.00), with a total annual dividend of ¥1,029 million. The forecasted annual dividend for FY2027 is ¥42.00.
🤖 AI Perspective
ProShip’s FY2026 results show robust growth across all key metrics, with operating profit notably outpacing sales growth, which may suggest improved operational efficiency. The company’s forecast for FY2027 indicates an expectation of continued revenue and profit expansion, which could be a point of interest for investors monitoring sustained business performance. The announced dividend for FY2026 and the forecast for FY2027 might also be worth monitoring for those evaluating shareholder returns.
3772|ウェルス
1066.0
▲ +1.04%
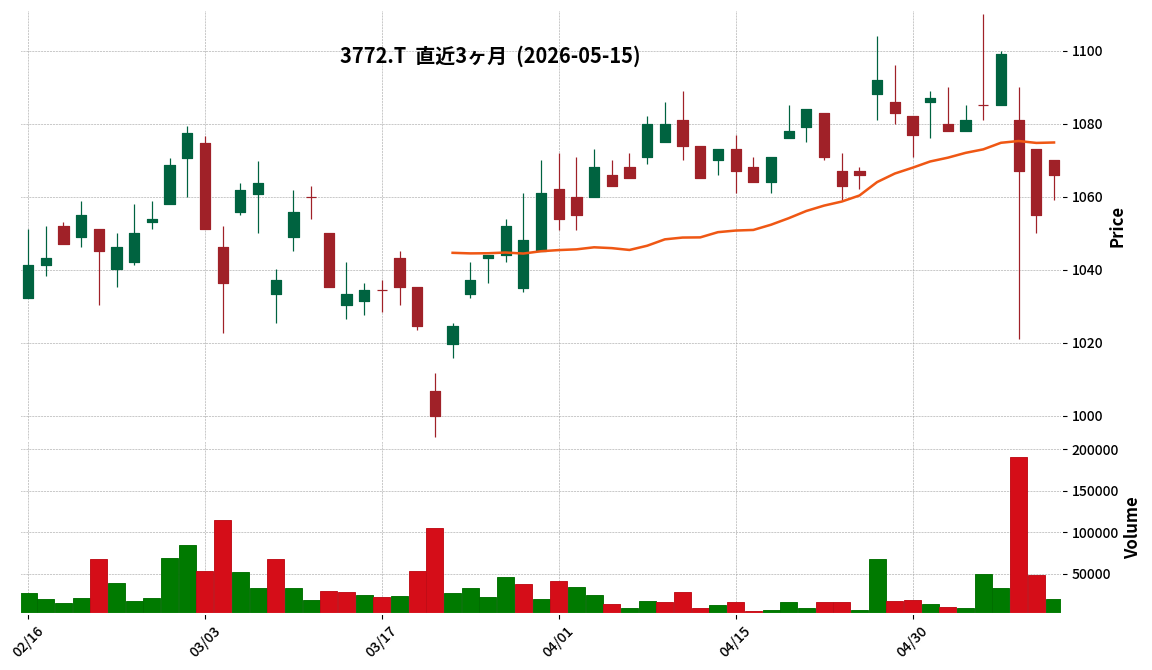
This article is an AI-generated summary and analysis of official IR disclosures.
📄 Announcement (AI-Reviewed)
- Wealth Management Inc. announced its financial results presentation for the fiscal year ended March 2026 on May 15, 2026.
- For the fiscal year ended March 2026, consolidated results included net sales of ¥15.1 billion (initial forecast: ¥29.0 billion), operating income of ¥-0.1 billion (initial forecast: ¥4.5 billion), ordinary income of ¥-2.0 billion (initial forecast: ¥3.5 billion), and net income attributable to owners of the parent of ¥-1.1 billion (initial forecast: ¥2.5 billion).
- The company cited project delays for multiple deals, underperformance in asset management revenue against plans, and Value-up revenue falling short due to development project delays as key reasons for operating income and all subsequent profit stages not reaching positive figures.
- For the fiscal year ending March 2027, the company forecasts net sales of ¥21.0 billion and net income attributable to owners of the parent of ¥1.8 billion. Operating income and ordinary income forecasts were not provided.
- Regarding shareholder returns, the dividend for the fiscal year ended March 2026 is undecided, and the company announced an enhancement to its shareholder benefit program, including a new category for 400-600 shares and an increased benefit amount for 600-1,000 shares.
🤖 AI Perspective
Wealth Management’s FY2026 March results significantly missed initial forecasts across sales and profit metrics, with operating income and subsequent stages posting losses. This outcome was largely attributed to delays in multiple projects and development, suggesting the substantial impact that the progress of large-scale real estate projects can have on the company’s performance.
For FY2027, the company is focusing on stabilizing hotel operations, strengthening sourcing capabilities, and accelerating short-term recovery projects, indicating a strategic shift towards diversifying its revenue streams. The extent to which these initiatives will contribute to achieving the company’s FY2027 financial targets will be a key area for investors to monitor.
2652|まんだらけ
346.0
▲ +2.06%
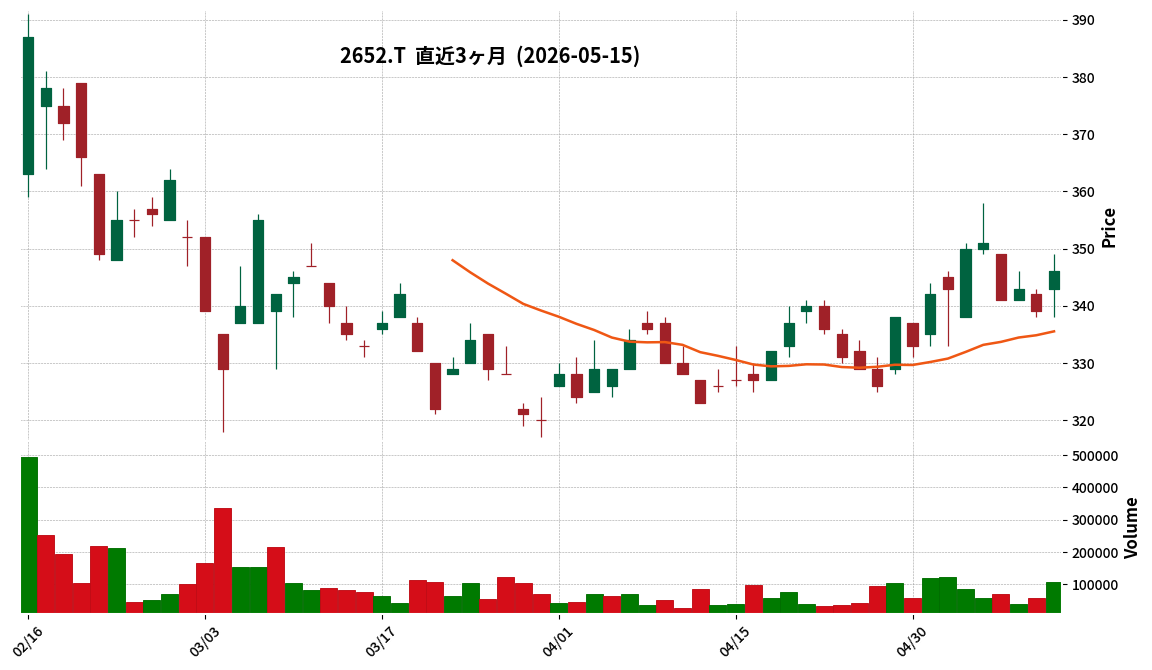
This article is an AI-generated summary and analysis of official IR disclosures.
📄 Announcement (AI-Reviewed)
- Mandarake Inc. announced its non-consolidated financial results for the second quarter (interim period) of the fiscal year ending September 2026.
- For the interim period (October 1, 2025 – March 31, 2026), net sales reached 8,324 million yen, an 8.8% increase compared to the prior interim period.
- Operating profit was 1,317 million yen (up 40.9%), ordinary profit was 1,287 million yen (up 40.5%), and interim net profit was 865 million yen (up 56.2%).
- As for financial position, total assets at the end of the interim period stood at 20,073 million yen (up 1,166 million yen from the previous fiscal year-end), and net assets were 12,656 million yen (up 833 million yen).
- The full-year forecast for FY2026 remains unchanged from the announcement on November 14, 2025, projecting net sales of 15,837 million yen, operating profit of 2,087 million yen, ordinary profit of 2,055 million yen, and net profit of 1,390 million yen.
🤖 AI Perspective
Mandarake’s Q2 FY2026 results show significant year-over-year growth across key financial metrics. This strong performance appears to be primarily driven by the successful opening of “Complex 2” in August and the expanded relocation of “PUCK2” in October, alongside robust performance in web auctions. The company’s ability to generate solid profits while actively pursuing strategic investments in human resources and inventory procurement could indicate a sustainable growth trajectory.
7699|G-OPS
719.0
▲ +0.00%
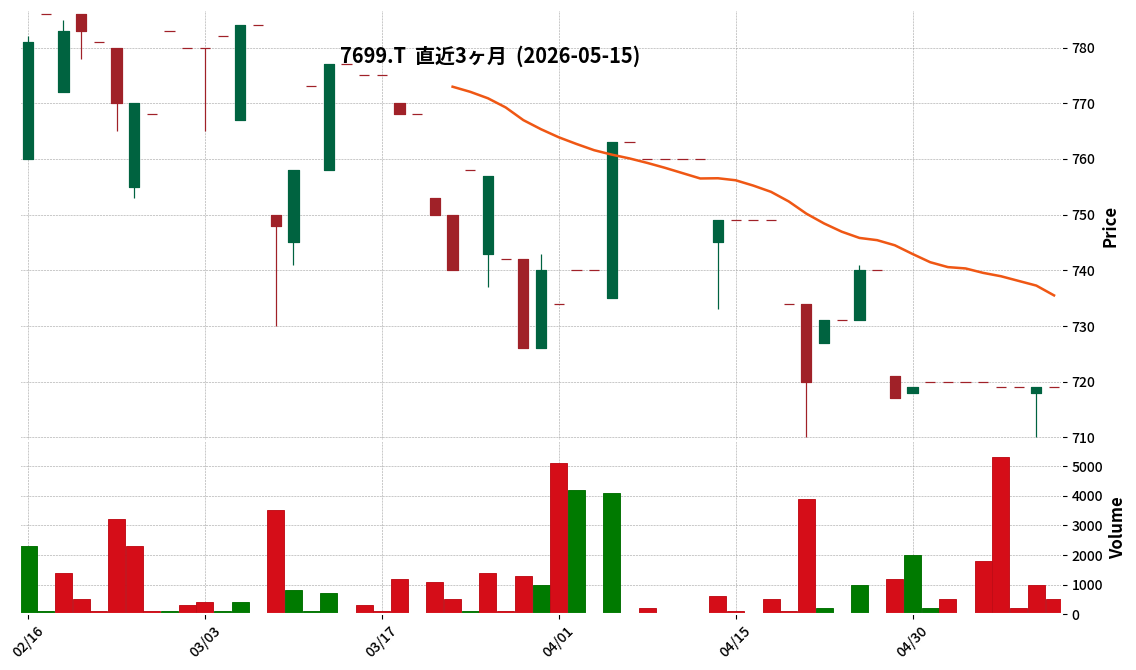
This article is an AI-generated summary and analysis of official IR disclosures.
📄 Announcement (AI-Reviewed)
- OMNI-PLUS SYSTEM LIMITED (G-OPS, 7699) announced a correction to its “Consolidated Financial Results for the Fiscal Year Ended March 31, 2025 [SFRS] (Consolidated)” on May 15, 2026.
- The reason for the correction is that the financial results disclosed on May 15, 2025, were preliminary figures before audit, and the subsequent audit results finalized the figures on August 2, 2025.
- The corrected consolidated financial performance for the fiscal year (April 1, 2024 – March 31, 2025) shows revenue of US$371,586 thousand and profit attributable to owners of the parent of US$16,658 thousand.
- Compared to the fiscal year ended March 31, 2024, revenue increased by 19.8%, and profit attributable to owners of the parent increased by 58.8%.
- Basic earnings per share for the fiscal year ended March 31, 2025, were finalized at US$0.7910, and diluted earnings per share also at US$0.7910.
- The consolidated earnings forecast for the fiscal year ending March 31, 2026, remains unchanged, projecting revenue of US$476,300 thousand and profit attributable to owners of the parent of US$18,100 thousand.
🤖 AI Perspective
This correction reflects the finalized figures after the completion of the audit process, which will draw attention to any discrepancies between the preliminary and final reported numbers. The finalization of key profitability metrics, such as profit attributable to parent company shareholders and earnings per share, provides crucial information for investors evaluating the company’s financial health. Furthermore, the unchanged earnings forecast for the fiscal year ending March 31, 2026, even after the correction, could suggest the company’s confidence in its future business outlook.
3664|G-WIZE
33.0
▲ +0.00%
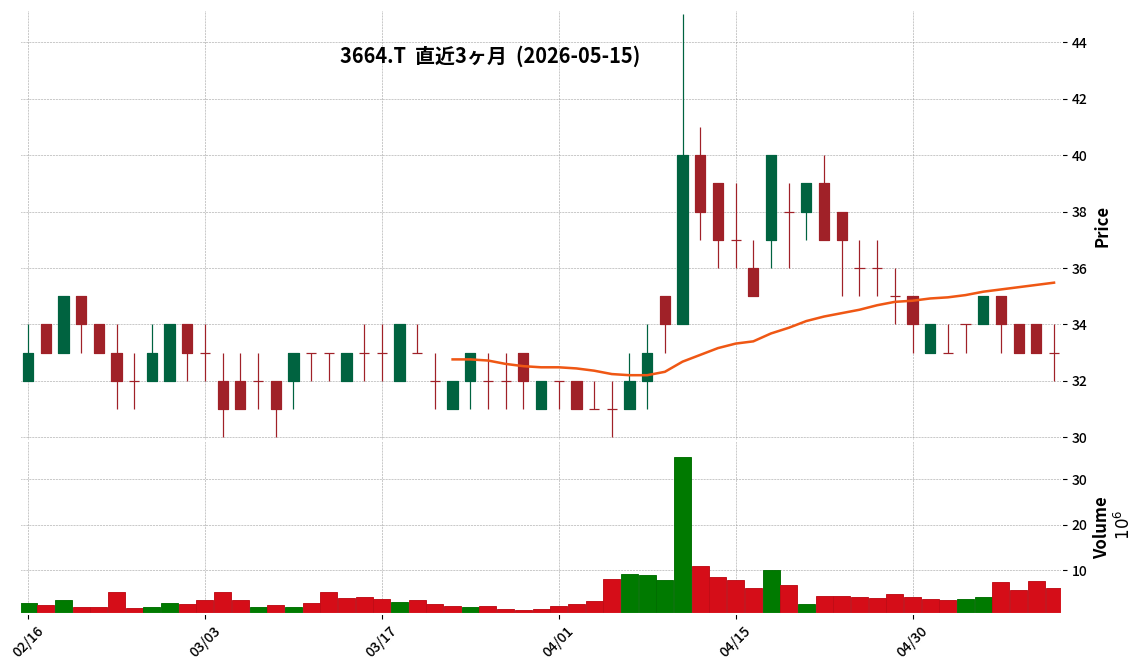
This article is an AI-generated summary and analysis of official IR disclosures.
📄 Announcement (AI-Reviewed)
- G-WIZE announced its corporate name change to “WIZE Inc.” effective April 1, 2026, positioning this as its “Second Founding.”
- The company’s new strategy focuses on building a “WIZE ecosystem” centered on Solana holdings and operations, linking with entertainment, apps/content, and SIAP.
- For Q1 FY2026, in addition to J-GAAP metrics, new management KPIs were disclosed, including Adjusted EBITA (¥-77.1 million), Solana Operating Revenue (¥4.6 million), and Operating CF (¥-41 million).
- J-GAAP results for Q1 showed Net Sales of ¥689 million (down ¥28 million YoY), Operating Income of ¥-89 million (¥11 million improvement YoY), and Ordinary Income of ¥-206 million (down ¥110 million YoY, including ¥114.8 million in crypto asset valuation loss).
- The Solana Treasury strategy completed its first phase with approximately ¥500 million in acquisitions, reaching a global Top 15 Solana holding position and projecting over ¥30 million in annual staking rewards.
🤖 AI Perspective
WIZE’s strategic shift from a traditional entertainment company to one centered on Solana operations marks a significant change in its business model. The introduction of proprietary management KPIs, such as “Adjusted EBITA” which incorporates Solana operating revenue, suggests a redefinition of how the company’s value should be assessed. Investors may find the expansion of Solana holdings, the generation of operating revenue from these assets, and the commitment to shareholder returns to be key aspects to monitor for future performance.
Disclaimer: This article is for informational purposes only and does not constitute investment advice.
2323|fonfun
343.0
▲ +0.00%
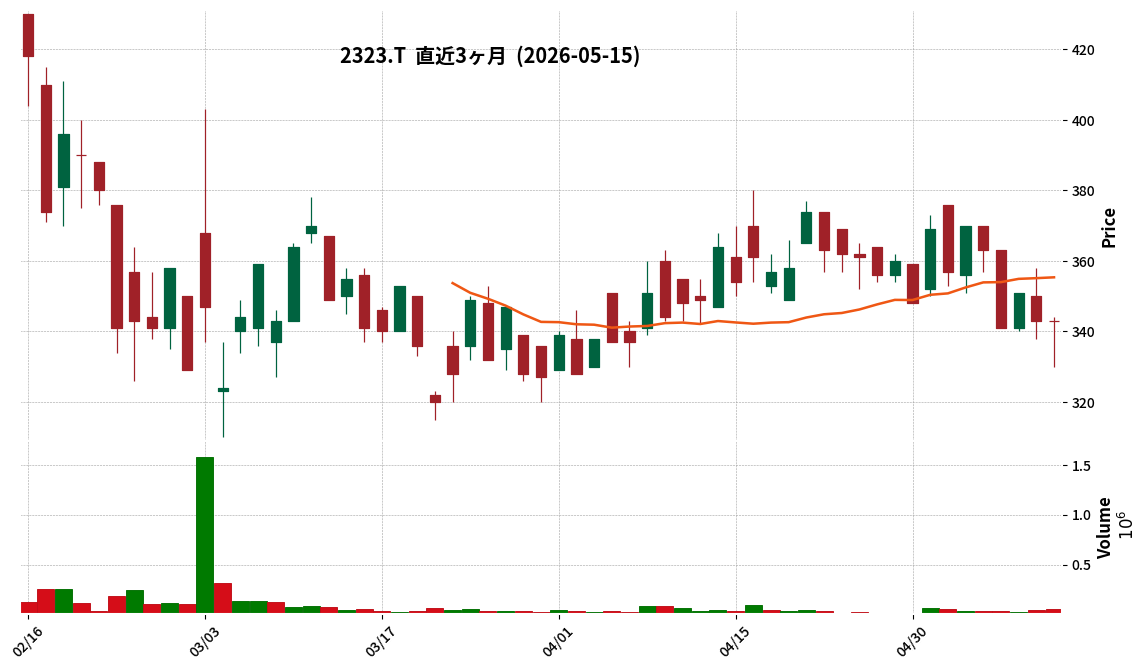
This article is an AI-generated summary and analysis of official IR disclosures.
📄 Announcement (AI-Reviewed)
- For the full fiscal year ended March 2026, fonfun reported consolidated net sales of 2,111 million JPY (up 66.4% year-on-year) and adjusted operating income (EBITDA) of 453 million JPY (up 61.9% year-on-year).
- Operating income reached 242 million JPY (up 61.9% year-on-year), ordinary income 271 million JPY (up 65.6% year-on-year), and net income attributable to owners of the parent 424 million JPY (up 150.8% year-on-year), marking record-high profits since the company’s establishment.
- All targets of the new medium-term management plan “Project Phoenix,” including “consolidated net sales of 2 billion JPY,” “EBITDA of 400 million JPY,” “100 engineers,” and “market capitalization of 10 billion JPY,” were achieved.
- The company executed 5 M&A deals in FY2026/3, bringing the cumulative total to 11 M&A transactions since the organizational change.
- The equity ratio was maintained at 40.7%, with net assets increasing by 456 million JPY from the previous fiscal year-end to 1,413 million JPY.
🤖 AI Perspective
fonfun’s FY2026/3 results show significant growth, with sales and various profit metrics reaching historical highs, which may suggest the success of its M&A strategy and the transition to a stock/recurring revenue business model. The achievement of all medium-term management plan targets could indicate a solid foundation for continued future growth, making the company’s trajectory worth monitoring.
Disclaimer: This article is for informational purposes only and does not constitute investment advice.
6566|要興業
1281.0
▲ +1.43%
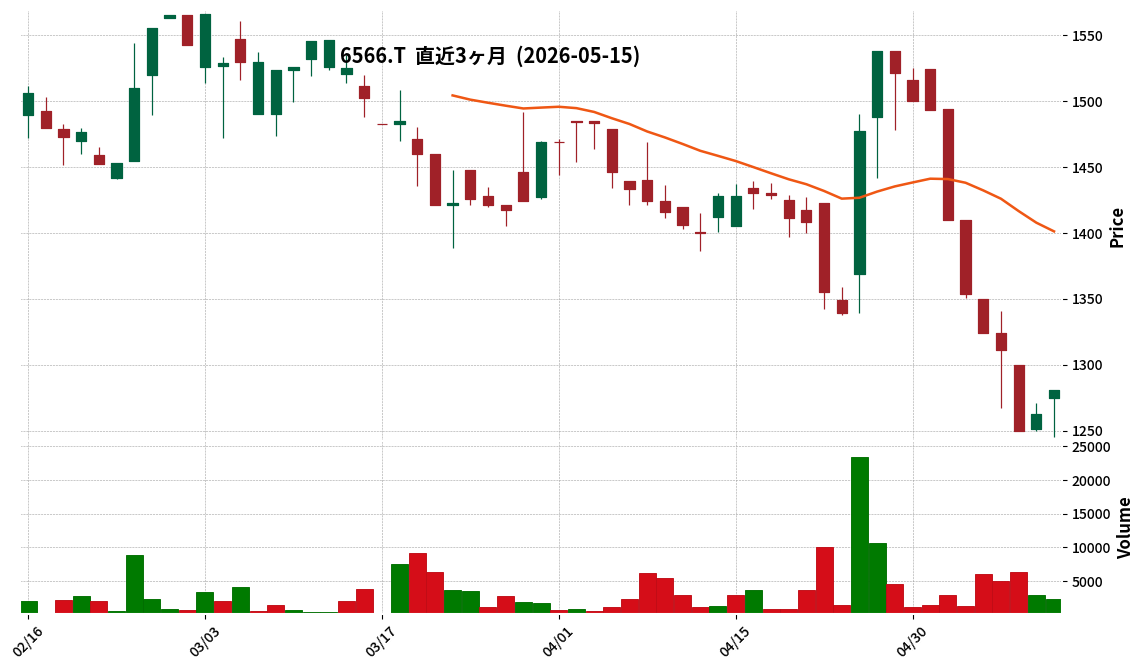
This article is an AI-generated summary and analysis of official IR disclosures.
📄 Announcement (AI-Reviewed)
- Kaname Kogyo announced its consolidated financial results for the fiscal year ended March 2026, with net sales of ¥14,949 million, representing a 3.0% increase year-on-year.
- Operating profit was ¥2,113 million (up 0.2%), ordinary profit was ¥2,264 million (up 4.5%), and profit attributable to owners of parent was ¥1,579 million (up 4.3%).
- Diluted earnings per share for the fiscal year ended March 2026 were ¥99.53, with a year-end dividend of ¥29.00 per share.
- For the fiscal year ending March 2027 (forecast), consolidated net sales are projected at ¥15,575 million (up 4.2% year-on-year for the full year), and profit attributable to owners of parent is expected to be ¥1,536 million (down 2.7%).
- The consolidated financial position shows total assets of ¥25,746 million, net assets of ¥20,837 million, and an equity ratio of 80.9%.
🤖 AI Perspective
Kaname Kogyo’s consolidated financial results for the fiscal year ended March 2026 show an increase in both net sales and profits, signaling a solid performance. This was likely driven by strong performance in its collection, transport, and disposal business, as well as administrative entrusted operations. However, while the company forecasts increased net sales for the fiscal year ending March 2027, a slight decrease in profit attributable to owners of parent is projected, which may draw attention to future business strategies and cost management.
7837|アールシーコア
317.0
▼ -0.63%
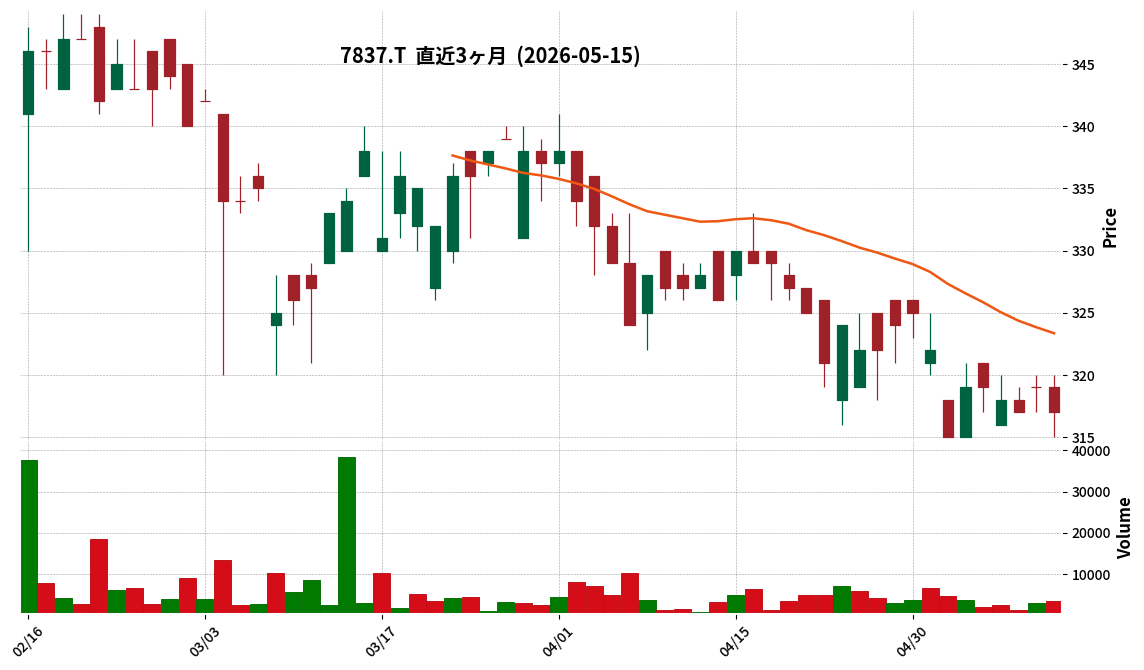
📎 Source:アールシーコア Official IR →
This article is an AI-generated summary and analysis of official IR disclosures.
📄 Announcement (AI-Reviewed)
- RCCore reported consolidated net sales of ¥10,547 million for the fiscal year ended March 2026, representing a 4.0% decrease year-over-year.
- The company recorded an operating loss of ¥594 million, an ordinary loss of ¥515 million, and a net loss attributable to parent company shareholders of ¥816 million.
- Basic earnings per share for the fiscal year ended March 2026 was △¥197.38.
- For the fiscal year ending March 2027, the company forecasts consolidated net sales of ¥13,600 million (a 28.9% increase year-over-year), operating income of ¥10 million, ordinary income of ¥10 million, and net income attributable to parent company shareholders of ¥510 million.
- Dividends per share were ¥0.00 for both FY2025/3 and FY2026/3, with ¥0.00 also forecasted for FY2027/3.
- During the fiscal year, the company celebrated its 40th anniversary, restructured the brand philosophy of its BESS business, expanded its non-residential construction (BtoB) business, and formed a capital and business alliance with Asahi Kasei Homes Corporation.
🤖 AI Perspective
RCCore’s FY2026/3 results showed a decline in revenue and significant losses across operating, ordinary, and net income, reflecting a challenging business environment. However, the company projects a return to profitability and revenue growth for FY2027/3, suggesting that strategic initiatives such as the BESS business restructuring, expansion of non-residential construction (BtoB), and the alliance with Asahi Kasei Homes may be central to its recovery. Investors may focus on the execution of these strategies and the company’s ability to achieve its forward-looking targets.
8771|Eギャランティ
1667.0
▼ -0.89%
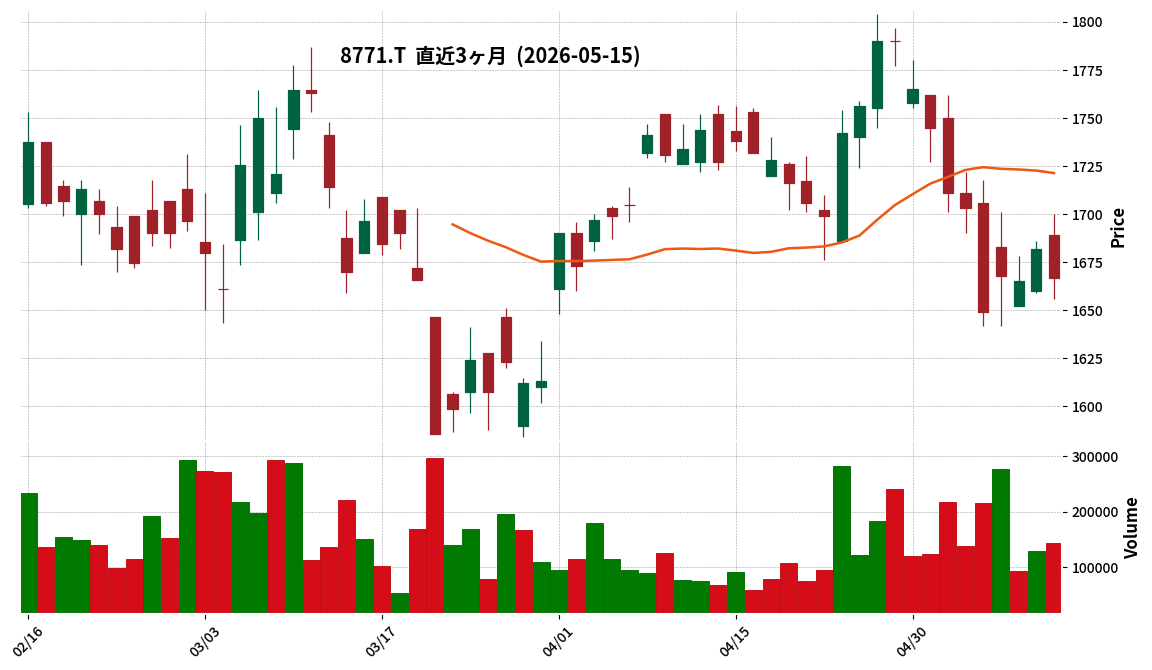
📎 Source:Eギャランティ Official IR →
This article is an AI-generated summary and analysis of official IR disclosures.
📄 Announcement (AI-Reviewed)
- eGuarantee announced its full-year financial results for the fiscal year ended March 2026, meeting its initial forecasts and achieving its ordinary profit target for the 19th consecutive year since listing.
- The company recorded its 24th consecutive year of increased revenue and ordinary profit.
- The dividend policy was revised, setting the dividend payout ratio at approximately 100%.
- Guarantee outstanding balance exceeded JPY 2.7 trillion, with guarantee obligations over JPY 900 billion, projected to reach JPY 1 trillion within the current fiscal year.
- The company leverages proprietary big data from over 580,000 corporate transactions and captures/registers 2.6 million data items daily as a source of competitive advantage.
🤖 AI Perspective
eGuarantee’s achievement of 24 consecutive years of revenue and ordinary profit growth, along with consistently meeting ordinary profit targets, may suggest the stability of its business model. The decision to raise the dividend payout ratio to 100% could indicate a strong commitment to shareholder returns and a specific approach to balancing future growth investments with cash flow. Furthermore, the strategy of business expansion utilizing proprietary big data is worth monitoring as a potential future revenue driver.
3358|Trailhead
105.0
▲ +3.96%
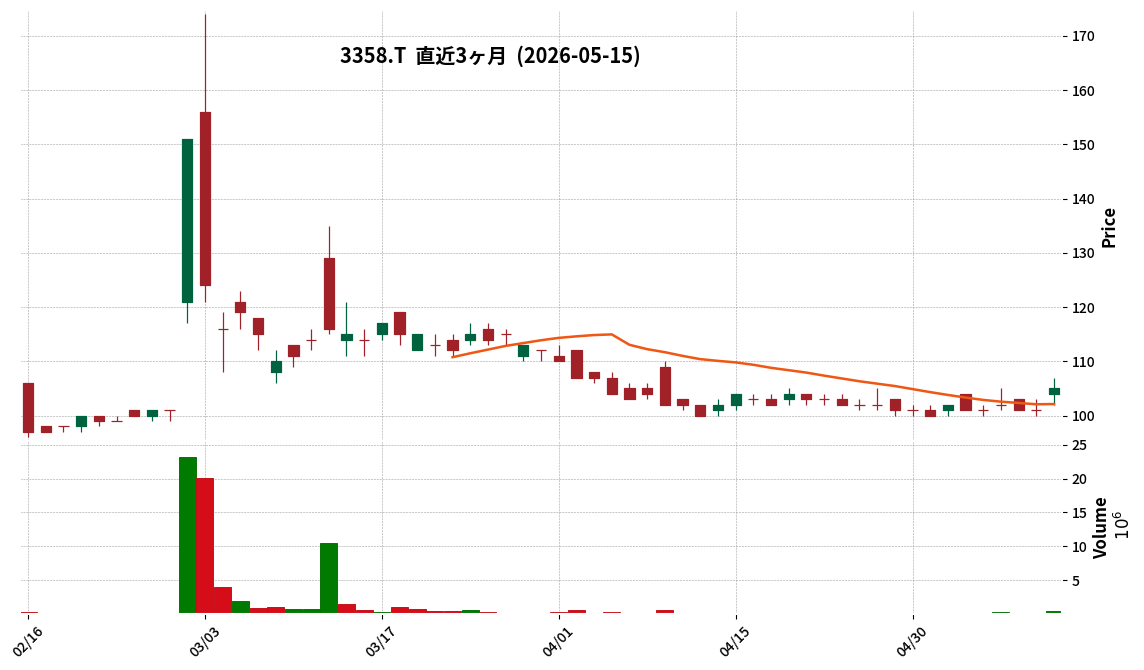
📎 Source:Trailhead Official IR →
This article is an AI-generated summary and analysis of official IR disclosures.
📄 Announcement (AI-Reviewed)
- Trailhead Global Holdings announced its consolidated financial results for the fiscal year ended March 2026, reporting net sales of ¥1,826 million, operating loss of ¥11 million, ordinary income of ¥82 million, and net income attributable to owners of the parent of ¥64 million.
- Consolidated financial statements began in the fiscal year ended March 2026, so no consolidated figures for the fiscal year ended March 2025 are provided.
- The equity ratio stood at 66.5%, and net assets per share were ¥57.33.
- For the fiscal year ending March 2027, the company forecasts consolidated net sales of ¥3,600 million (an increase of 97.1% year-on-year), operating income of ¥136 million, ordinary income of ¥111 million, and net income attributable to owners of the parent of ¥53 million.
- The annual dividend for the fiscal year ended March 2026 was ¥0, while for the fiscal year ending March 2027 (forecast), an annual dividend of ¥2 (interim ¥1, year-end ¥1) is planned.
- During the consolidated fiscal year, four new companies were added to the scope of consolidation: Yappa Inc., KINKA FAMILY JAPAN Inc., Burger Revolution Inc., and THG Nest Inc.
4771|エフアンドエム
2487.0
▲ +3.62%
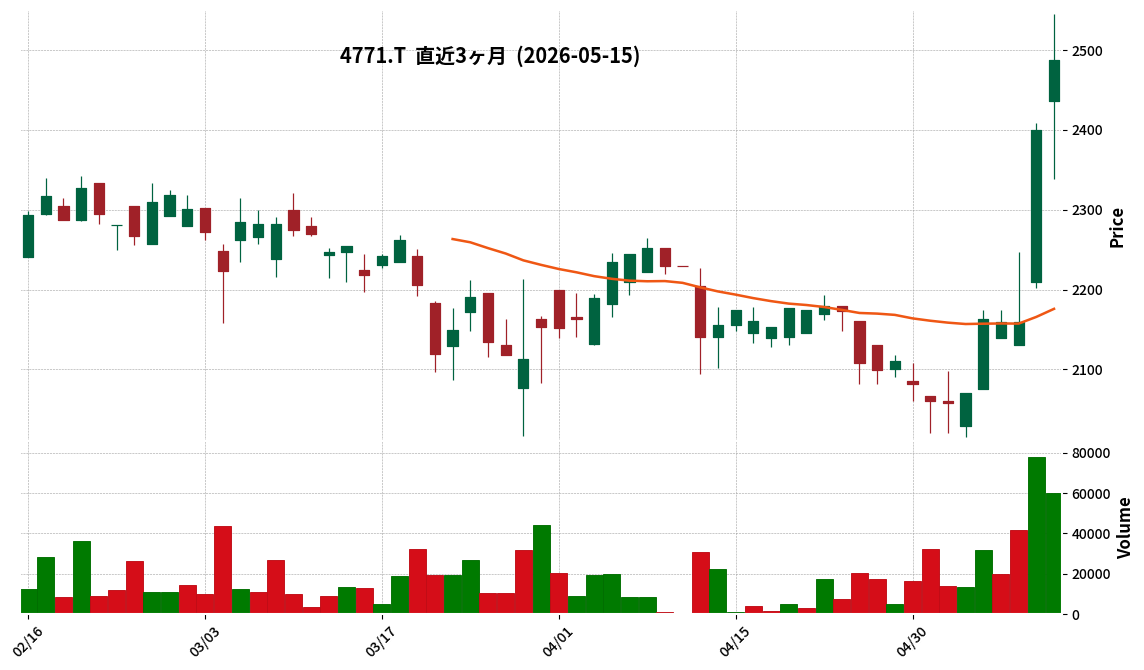
📎 Source:エフアンドエム Official IR →
This article is an AI-generated summary and analysis of official IR disclosures.
📄 Announcement (AI-Reviewed)
- F&M Co., Ltd. reported consolidated results for Q4 FY2026: net sales of JPY 20,807 million (down 0.3% vs. budget), operating profit of JPY 3,858 million (up 23.2% vs. budget), ordinary profit of JPY 3,900 million (up 23.5% vs. budget), and net profit of JPY 2,825 million (up 35.3% vs. budget).
- Year-over-year, net sales increased by 21.9% from JPY 17,066 million to JPY 20,807 million, operating profit increased by 42.0% from JPY 2,716 million to JPY 3,858 million, and net profit increased by 55.7% from JPY 1,814 million to JPY 2,825 million.
- By segment, the Consulting Services business showed the strongest growth, with net sales of JPY 8,192 million (up 23.8% YoY) and operating profit of JPY 2,592 million (up 55.9% YoY). This segment included JPY 237 million in adoption fees for subsidies such as the Monozukuri Subsidy.
- The “Office Station” series in the Business Solutions segment surpassed 56,000 users and was rated No. 1 in labor management cloud shipments for the sixth consecutive year in the HRTech Cloud market.
- For the full year FY2027, the company forecasts net sales of JPY 24,694 million (up 18.7% YoY), operating profit of JPY 4,156 million (up 7.7% YoY), and ordinary profit of JPY 4,197 million (up 7.6% YoY).
🤖 AI Perspective
F&M’s Q4 FY2026 results indicate that while net sales were largely in line with budget, significant cost controls in cost of sales and selling, general and administrative expenses led to profits substantially exceeding projections. The 23.2% increase in operating profit against budget is particularly notable. Year-over-year, the company achieved substantial gains across all profit metrics, suggesting that robust membership growth in each business segment contributed positively to performance. The success of the Consulting Services business, driven by subsidy adoption fees, and the expansion of the “Office Station” series within the Business Solutions segment appear to be key drivers of the overall strong results.
6554|G-エスユーエス
1010.0
▲ +0.40%
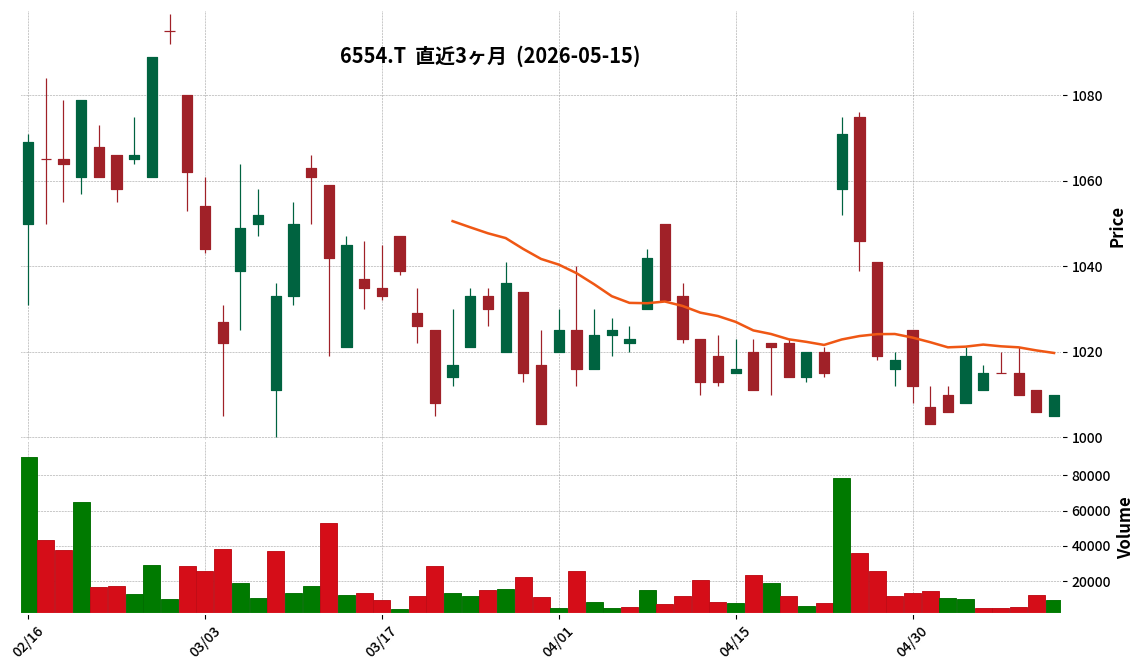
📎 Source:G-エスユーエス Official IR →
This article is an AI-generated summary and analysis of official IR disclosures.
📄 Announcement (AI-Reviewed)
- SUS Co., Ltd. reported for the first half of FY2026: net sales of ¥8,034 million (up 0.2% from initial forecast), operating profit of ¥871 million (up 37.4% from initial forecast), ordinary profit of ¥911 million (up 36.9% from initial forecast), and net profit attributable to parent company of ¥679 million (up 39.7% from initial forecast).
- The interim earnings forecast was revised upwards, but the full-year earnings forecast and dividend forecast remain unchanged.
- Compared to the same period of the previous year, consolidated net sales increased by 7.7% to ¥8,034 million, and operating profit increased by 6.6% to ¥871 million.
- The Solution business was a key driver, with net sales of ¥7,471 million (up 12.1% year-on-year) and segment profit of ¥855 million (up 17.4% year-on-year).
- The AR/VR business saw a decrease in revenue and profit due to the absence of large projects from the previous year, but the AI-related segment maintained revenue growth.
🤖 AI Perspective
G-SUS’s H1 FY2026 results exceeded initial expectations, showing significant profit growth, particularly in operating income. This performance appears to be driven by improved gross profit margins and the deferral of certain selling, general, and administrative expenses, including generative AI investments and recruitment advertising costs, suggesting effective cost management. The strong performance of the core Solution business, which achieved record-high sales and profit for an interim period, underscores the robustness of the company’s foundational operations.
6794|フォスター電
2947.0
▲ +1.62%
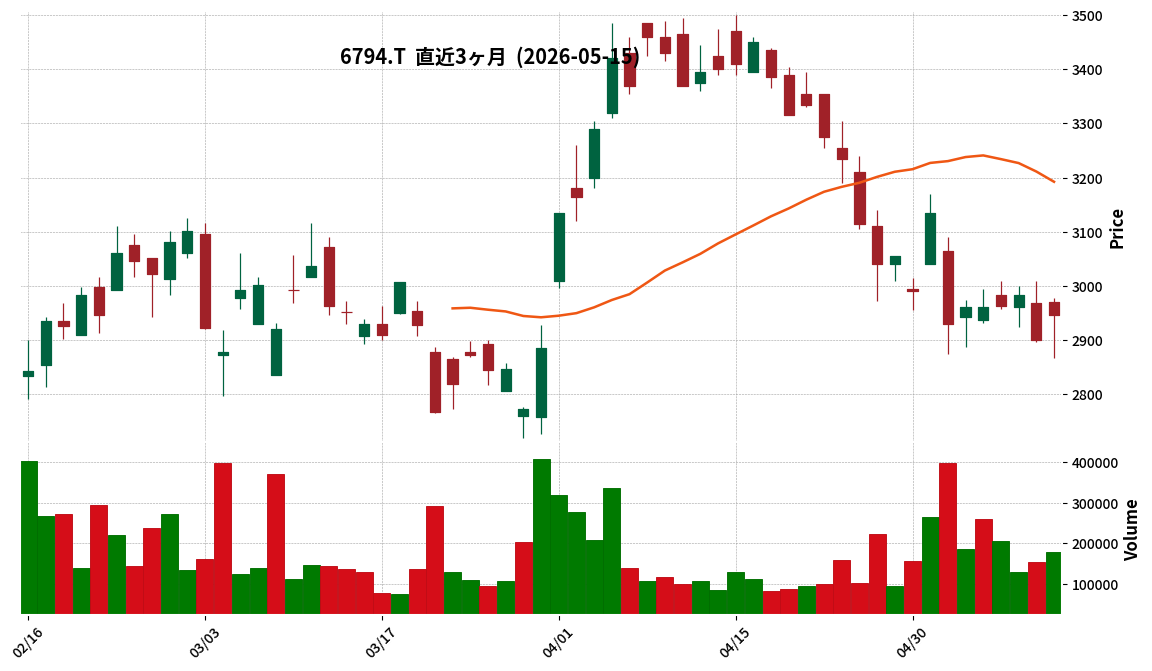
This article is an AI-generated summary and analysis of official IR disclosures.
📄 Announcement (AI-Reviewed)
- Foster Electric Company, Limited announced its financial results for the fiscal year ended March 31, 2026 (April 1, 2025 – March 31, 2026).
- Consolidated net sales for FY2026/3 were ¥134,910 million (down 2.0% year-on-year), operating profit was ¥7,670 million (up 12.9% year-on-year), ordinary profit was ¥8,002 million (up 3.6% year-on-year), and net profit attributable to owners of the parent was ¥4,951 million (up 26.9% year-on-year).
- By segment, the SP (Speaker) business reported net sales of ¥111,869 million (down 2.3% year-on-year) and operating profit of ¥6,522 million (up 2.5% year-on-year). The MA (Mobile Audio) business recorded net sales of ¥12,469 million (down 3.3% year-on-year) and operating profit of ¥672 million (up 4.9% year-on-year). The Other business reported net sales of ¥10,572 million (up 3.7% year-on-year) and an operating profit of ¥475 million (reversing a loss of ¥207 million in the previous year).
- The operating profit margin was 5.7% (4.9% in the previous year), and the equity ratio was 60.3% (57.0% at the end of the previous year).
- Earnings per share stood at ¥221.04 (¥174.98 in the previous year), and the per-share dividend was ¥80.00 (¥60.00 in the previous year).
🤖 AI Perspective
Foster Electric’s FY2026/3 results show a notable increase in operating and net profits despite a slight decline in net sales. This performance may suggest the effectiveness of the company’s branded and premium sales strategy, an increase in sales of higher-margin products, and the positive impact of structural reforms. The improved profitability in the SP business and the return to profitability in the Other business could indicate a strengthened earnings structure.
8252|丸井G
3019.0
▲ +1.24%
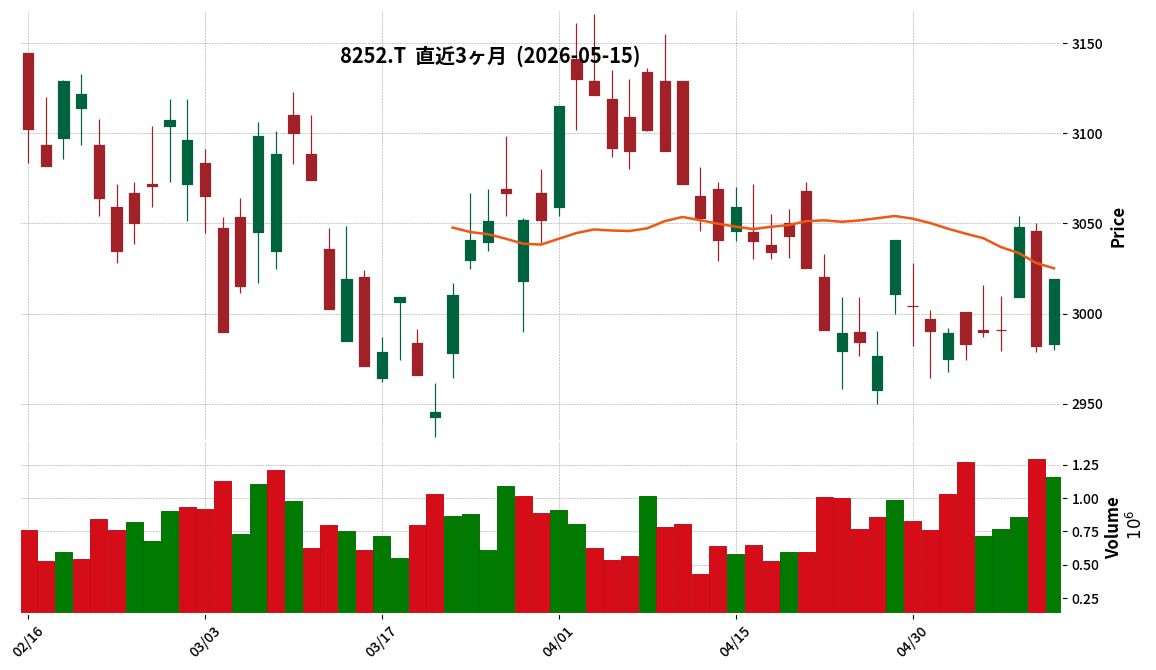
This article is an AI-generated summary and analysis of official IR disclosures.
📄 Announcement (AI-Reviewed)
- For the fiscal year ended March 2026, consolidated EPS increased by 11% to ¥158.4, ROE reached 11.6% (up 1.0% YoY), and ROIC was 4.0% (up 0.2% YoY). All three key KPIs met targets and achieved record highs.
- Consolidated operating profit rose by 13% year-on-year to ¥50.2 billion (up ¥5.7 billion YoY), marking the fifth consecutive year of profit growth and achieving the planned target.
- Net income increased by 7% year-on-year to ¥28.5 billion (up ¥1.9 billion YoY), exceeding the planned target by ¥0.5 billion.
- By segment, the Retail business recorded an operating profit of ¥11.2 billion (up ¥2.6 billion YoY), and the FinTech business recorded an operating profit of ¥47.0 billion (up ¥3.0 billion YoY).
- Existing store transaction volume in the Retail business surpassed prior year levels for 44 consecutive months, and the area composition of non-merchandise tenants expanded to 70% as of March 2026.
- In the FinTech business, new EPOS card enrollments reached a record high of 870,000 (up 40,000 YoY), and the total number of cardholders reached a record high of 8.3 million.
🤖 AI Perspective
Marui Group’s FY2026 results, demonstrating record highs across key financial indicators and five consecutive years of profit growth, suggest that the company’s strategic initiatives are yielding positive outcomes. The expansion of non-merchandise tenants in the Retail segment and the growth in EPOS cardholders in the FinTech segment indicate successful business model transformation and growth strategies. These factors could potentially contribute to further strengthening the company’s sustainable revenue base going forward.
9211|G-エフ・コード
1425.0
▼ -1.86%
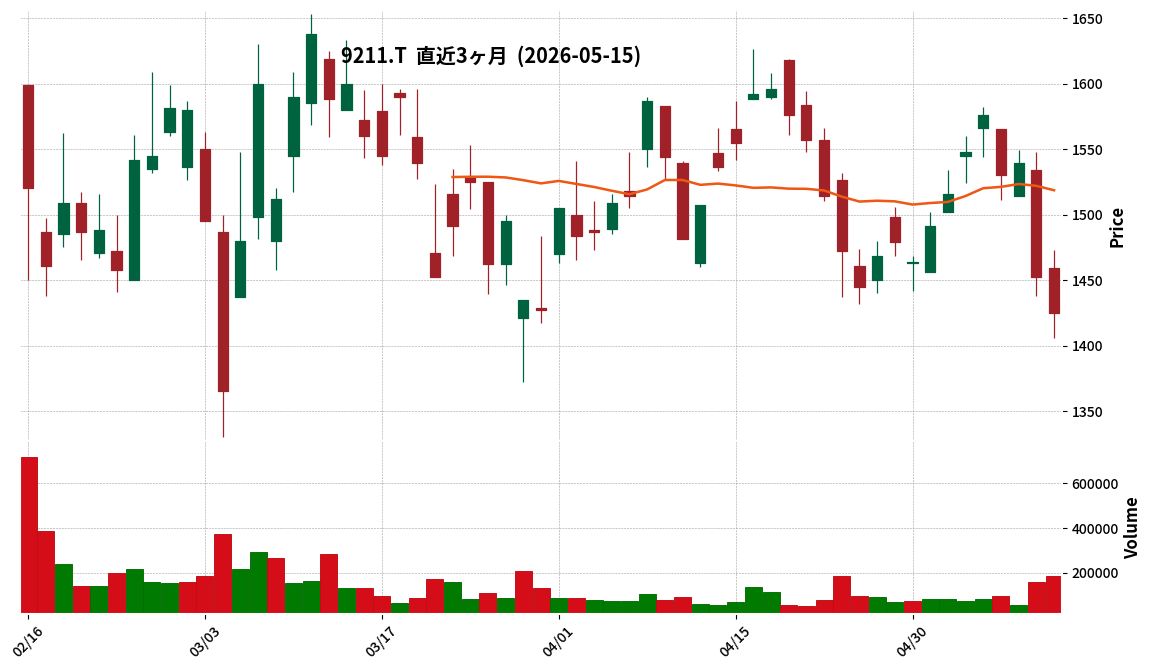
📎 Source:G-エフ・コード Official IR →
This article is an AI-generated summary and analysis of official IR disclosures.
📄 Announcement (AI-Reviewed)
- G-f-code reported Q1 FY2026 revenue of ¥3.90 billion (approximately 1.6 times higher than the previous year) and operating income of ¥785 million (approximately 1.4 times higher).
- During Q1 FY2026, the company executed 3 M&A deals with a total investment of approximately ¥1.4 billion, adding approximately ¥600 million to operating income on a full-year basis.
- As of today, one additional M&A deal with a total investment of approximately ¥430 million and an expected operating income contribution of ¥60 million (full-year basis) has been completed in Q2 FY2026.
- The full-year FY2026 forecast projects revenue of ¥14.50 billion and operating income of ¥3.30 billion. As of Q1, revenue progress is 26.9%, and operating income progress is 23.8%.
- For the full-year forecast, the Marketing&School segment’s business profit is expected to grow by approximately 1.2 times, and the AI・Technology segment’s business profit by approximately 1.6 times.
🤖 AI Perspective
G-f-code’s Q1 results show significant year-over-year growth in both revenue and operating profit, which may suggest the company’s M&A-driven growth strategy is continuing. While revenue progress towards the full-year forecast appears steady, the operating profit progress aligns with expectations given upfront investments in the AI・Technology segment. The ongoing M&A activities and the performance of existing businesses, particularly within the AI・Technology segment, will be worth monitoring for the achievement of full-year targets.
4258|G-網屋
2795.0
▼ -3.15%
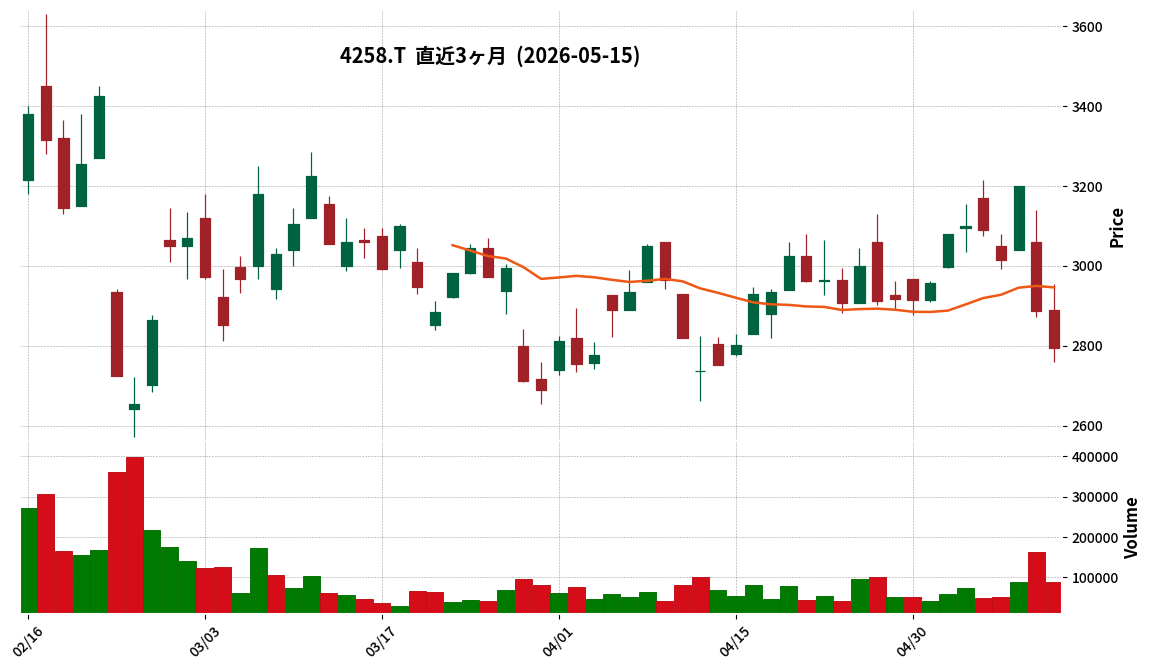
This article is an AI-generated summary and analysis of official IR disclosures.
📄 Announcement (AI-Reviewed)
- G-Amita Inc. announced a partial correction to its “Consolidated Financial Results for the First Quarter of the Fiscal Year Ending December 2026 [Japanese GAAP]” on May 15, 2026.
- The correction was made due to an error in the “Dividends per Share” figures within “2. Overview of Consolidated Subsidiary (Ample Inc.) Subject to Change” under “Significant Subsequent Events” in the financial report released on May 13, 2026.
- Specifically, the “Dividends per Share” for Ample Inc. for the fiscal periods ending September 2023, September 2024, and September 2025 were corrected.
- The original disclosure stated “0 yen” for each period, which has been corrected to “25 yen” for each period.
- All other financial figures, including net assets, total assets, net assets per share, net sales, operating income, ordinary income, net income, and net income per share, remain unchanged.
🤖 AI Perspective
This correction pertains to specific financial figures, particularly the past dividend performance of Ample Inc., a subsidiary subject to change, which investors may note when evaluating the accuracy of disclosures related to M&A or other subsequent events. While there is no impact on the overall financial results, this action could be viewed as the company’s commitment to ensuring the accuracy of its reported information.
3392|デリカフーズHD
848.0
▼ -0.82%
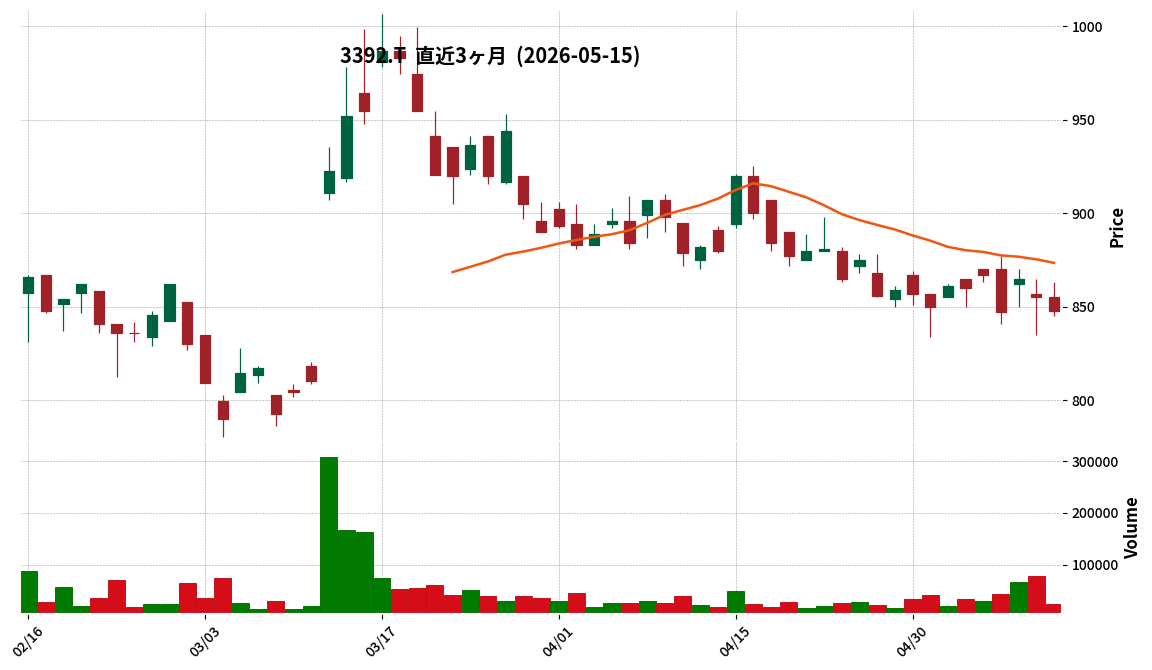
📎 Source:デリカフーズHD Official IR →
This article is an AI-generated summary and analysis of official IR disclosures.
📄 Announcement (AI-Reviewed)
- Delica Foods Holdings Co., Ltd. announced a correction to a part of its “Notice Regarding Capital and Business Alliance with Development Bank of Japan Inc. and the Offering of the 1st Unsecured Convertible Bond with Stock Acquisition Rights and the 1st Stock Acquisition Rights Issued by Way of Third-Party Allotment”, initially disclosed on May 13, 2026.
- The correction pertains to “11. Period during which the Stock Acquisition Rights may be exercised” in the attached “Terms and Conditions for Issuance of Delica Foods Holdings Co., Ltd. 1st Stock Acquisition Rights.”
- The start date for the exercise period was changed from “May 29, 2026, to May 22, 2031” to “June 1, 2026, to May 22, 2031.”
- The end date of the exercise period, May 22, 2031, remains unchanged.
🤖 AI Perspective
This correction modifies the start date for the exercise of stock acquisition rights related to the capital and business alliance with the Development Bank of Japan. Investors may need to note this slight shift in the exercise period’s commencement. Such detailed date changes could potentially influence the valuation and exercise strategies of the issued stock acquisition rights, making it a point for close observation.
4499|Speee
2570.0
▼ -3.67%
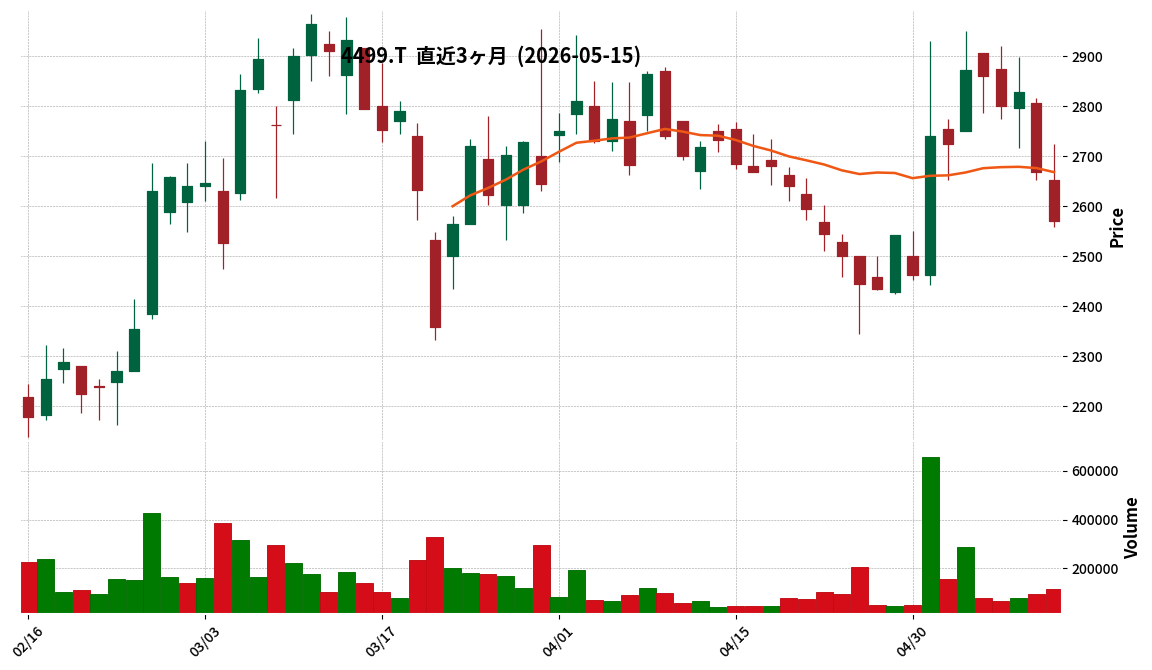
This article is an AI-generated summary and analysis of official IR disclosures.
📄 Announcement (AI-Reviewed)
- Speee Co., Ltd. released its Q2 FY2026 earnings presentation (video) and Q&A report on May 15, 2026.
- The earnings presentation video featured explanations by Representative Director Hideki Otsuka and Director Hisada, covering the earnings presentation materials, a presentation made at the LDP Digital Society Promotion Headquarters “Next-Generation AI / On-Chain Financial Concept PT” on April 7, 2026, and a Q&A session.
- The Q&A section detailed “Datachain Privacy,” emphasizing the importance of privacy protection technology that satisfies anonymity, confidentiality, and unlinkability, along with the necessity of “selective disclosure” for corporate use.
- “Datachain Wallet” is described as the “industry’s first (according to Datachain) Japanese corporate wallet compatible with privacy features,” offering proprietary privacy technology, robust key management, approval authority management, evidential output, and gasless support.
- Speee’s business scope includes Financial DX, Legacy Industry DX, and DX Consulting, and it is listed on the Tokyo Stock Exchange Standard Market (security code: 4499).
🤖 AI Perspective
Speee’s latest announcement underscores its commitment to blockchain technology within its Financial DX business. The focus on developing privacy protection technology, crucial for enterprise blockchain adoption, and the “Datachain Wallet” may position the company uniquely in a rapidly evolving market. The inclusion of details from the LDP Digital Society Promotion Headquarters presentation could also suggest the company’s efforts to align with policy directions and enhance its industry presence.
5856|エルアイイーエイチ
22.0
▲ +0.00%
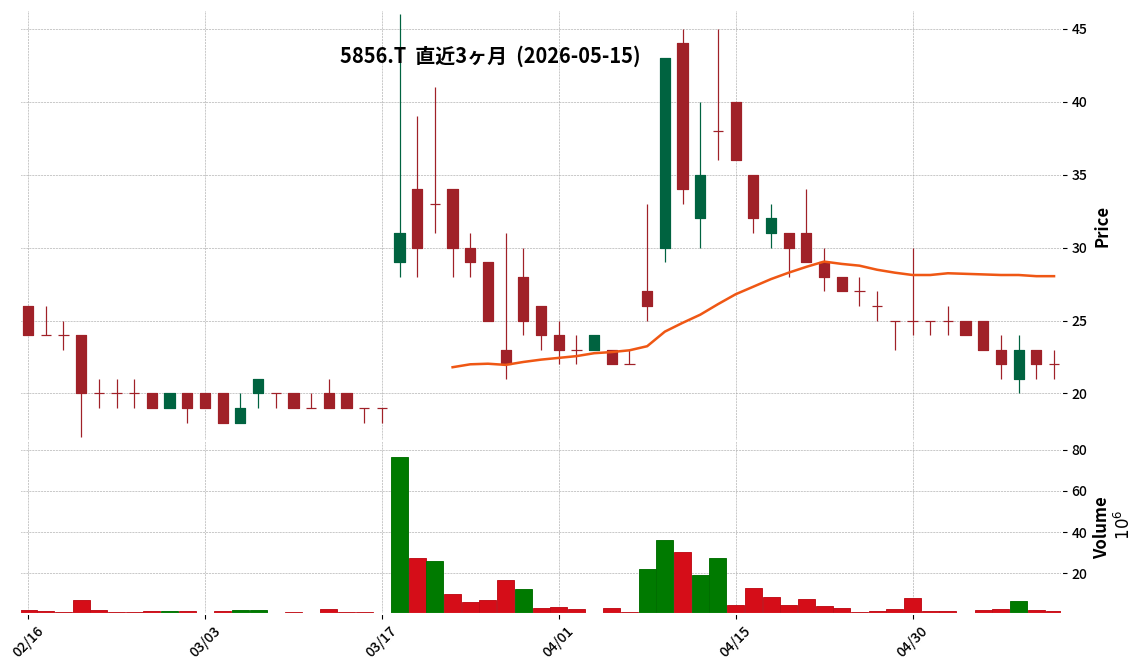
📎 Source:エルアイイーエイチ Official IR →
This article is an AI-generated summary and analysis of official IR disclosures.
📄 Announcement (AI-Reviewed)
- LIEH Co., Ltd. announced a further postponement of its Q3 FY2026 financial results report.
- The disclosure of the FY2026 full-year financial results report will also be postponed from the initially scheduled date of May 15, 2026, exceeding 45 days after the fiscal year-end.
- The reason for the delay is the discovery of an ongoing lawsuit involving its consolidated subsidiary, Nagomi Sekkei Co., Ltd., which was previously unknown to LIEH.
- A special investigation committee was established to verify the facts of this lawsuit and the appropriateness of the subsidiary’s accounting treatment, and this investigation is ongoing.
- The company announced that it received an interim report from the special investigation committee on May 15, 2026.
🤖 AI Perspective
This announcement indicates that not only the Q3 results, which were already delayed, but also the full-year results will be postponed. It suggests that the legal issue at a consolidated subsidiary is having a continuous impact on the financial disclosure schedule. While an interim report from the special investigation committee has been received, the final investigation is not yet complete, and future progress of the investigation will be a key point for investors to monitor.
5868|ロココ
1073.0
▼ -0.28%
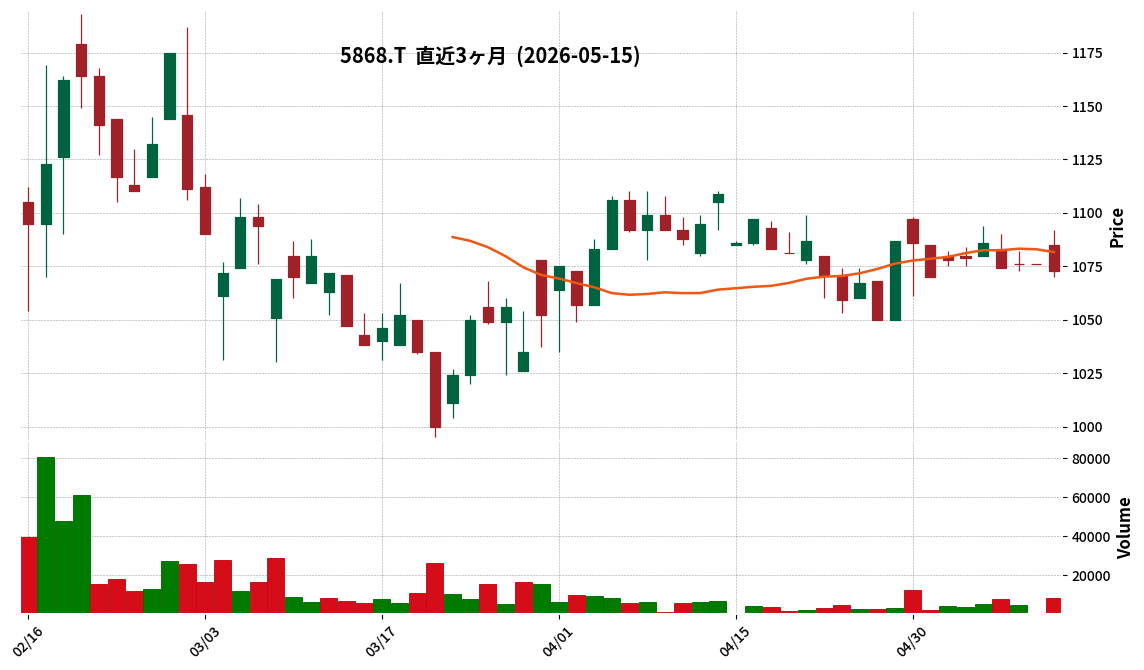
This article is an AI-generated summary and analysis of official IR disclosures.
📄 Announcement (AI-Reviewed)
- Rococo Co., Ltd. announced its consolidated financial results for the first quarter of the fiscal year ending December 2026 (January 1, 2026, to March 31, 2026).
- Net sales reached ¥2,388 million, marking a 12.8% increase compared to the same period in the previous year.
- Operating profit was ¥93 million (down 52.6% year-on-year), ordinary profit was ¥94 million (down 54.1% year-on-year), and net profit attributable to parent company shareholders was ¥43 million (down 69.5% year-on-year).
- By segment, the ITO & BPO business reported sales of ¥1,622 million (up 18.7% year-on-year) and segment profit of ¥85 million (down 31.7% year-on-year). The Cloud Solutions business recorded sales of ¥750 million (up 4.8% year-on-year) and segment profit of ¥24 million (down 65.5% year-on-year).
- The full-year consolidated earnings forecast remains unchanged from the most recent public announcement: sales of ¥10,304 million (up 12.1% year-on-year), operating profit of ¥610 million (up 16.3% year-on-year), ordinary profit of ¥603 million (up 19.5% year-on-year), and net profit attributable to parent company shareholders of ¥409 million (up 29.0% year-on-year).
🤖 AI Perspective
Rococo’s Q1 FY2026 results show solid revenue growth, but a significant decline in profitability. This appears to be influenced by factors such as amortization of goodwill from newly acquired subsidiaries, establishment of new R&D centers, increased recruitment costs, and higher cost ratios in some business segments. The balance between revenue growth and the impact of these upfront investments on profitability will be a key area for investors to monitor going forward.
Disclaimer: This article is for informational purposes only and does not constitute investment advice.
6579|G-ログリー
271.0
▼ -8.75%
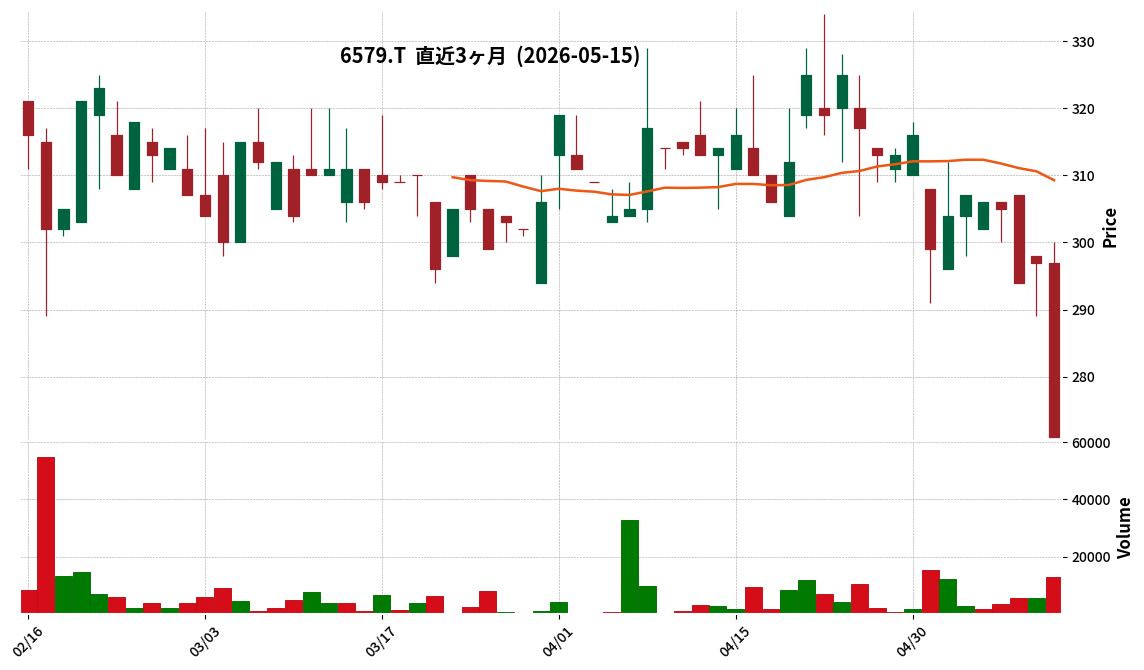
This article is an AI-generated summary and analysis of official IR disclosures.
📄 Announcement (AI-Reviewed)
- Logly Inc. resolved at its Board of Directors meeting on May 15, 2026, to absorb its wholly-owned subsidiary, moto Corporation.
- The purpose of this merger is to concentrate management resources and improve the efficiency of the Logly Group.
- The effective date of the merger is scheduled for June 30, 2026.
- Logly Inc. will be the surviving company in this absorption merger, and moto Corporation will be dissolved. As Logly Inc. owns 100% of moto Corporation’s shares, no shares or other financial consideration will be allotted.
- This merger qualifies as a simplified merger for Logly Inc. under Article 796, Paragraph 2 of the Companies Act, and a short-form merger for moto Corporation under Article 784, Paragraph 1 of the same act, thus requiring no shareholder approval.
🤖 AI Perspective
This merger appears to be a strategic move to optimize management resources and enhance operational efficiency within the Logly Group. While the announcement states a minor impact on consolidated financial performance due to it being a merger with a wholly-owned subsidiary, it may indicate an underlying intent to strengthen the long-term management foundation through business portfolio restructuring. The realization of synergistic effects in future operations will be worth monitoring.
6912|菊水HD
2500.0
▼ -1.38%
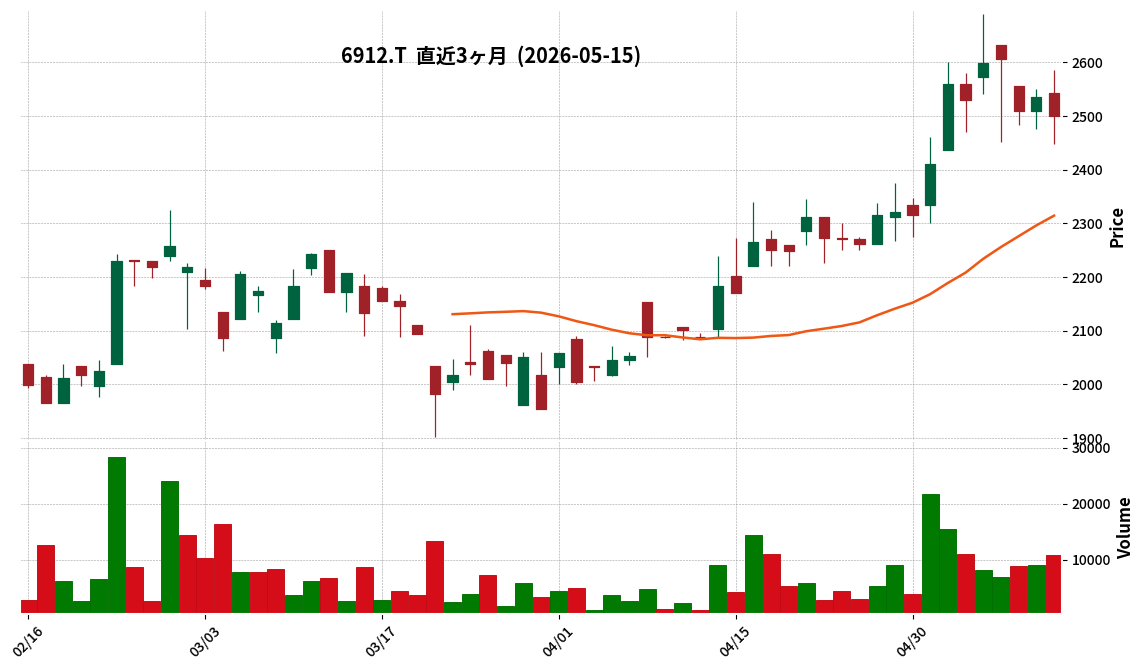
This article is an AI-generated summary and analysis of official IR disclosures.
📄 Announcement (AI-Reviewed)
- Kikusui HD announced that its actual consolidated financial results for the full year ended March 2026 exceeded the forecasts announced on May 15, 2025.
- Sales reached JPY 14,687 million against a forecast of JPY 13,500 million (an 8.8% increase), and operating profit was JPY 2,135 million against a forecast of JPY 2,050 million (a 4.1% increase).
- Ordinary profit recorded JPY 2,270 million against a forecast of JPY 2,150 million (a 5.6% increase), and profit attributable to owners of parent was JPY 1,609 million against a forecast of JPY 1,450 million (an 11.0% increase).
- Basic earnings per share (EPS) was JPY 193.38 compared to the forecast of JPY 174.28.
- The discrepancies were attributed to capturing capital investment demand in automotive-related, energy-related, semiconductor-related, and data center-related markets, with significant sales growth of power supply equipment and custom-made products in Q4.
- The year-end dividend forecast for March 2026 was revised from the previous forecast of JPY 63.00 (ordinary dividend JPY 53.00, commemorative dividend JPY 10.00) to the revised forecast of JPY 69.00 (ordinary dividend JPY 59.00, commemorative dividend JPY 10.00), representing a JPY 6 increase in ordinary dividend per share.
🤖 AI Perspective
This upward revision highlights that Kikusui HD’s actual results surpassed previous forecasts across all revenue and profit metrics, driven by expanding capital investment demand in key markets. The increase in ordinary dividends, based on the company’s dividend policy of a DOE (Dividend on Equity) of 2% or more and a consolidated payout ratio of 30% or more, could indicate a proactive stance towards shareholder returns. Investors may find it worthwhile to monitor future market conditions and the ongoing progress of Kikusui HD’s business strategies.
7383|ネットプロHD
437.0
▼ -0.68%
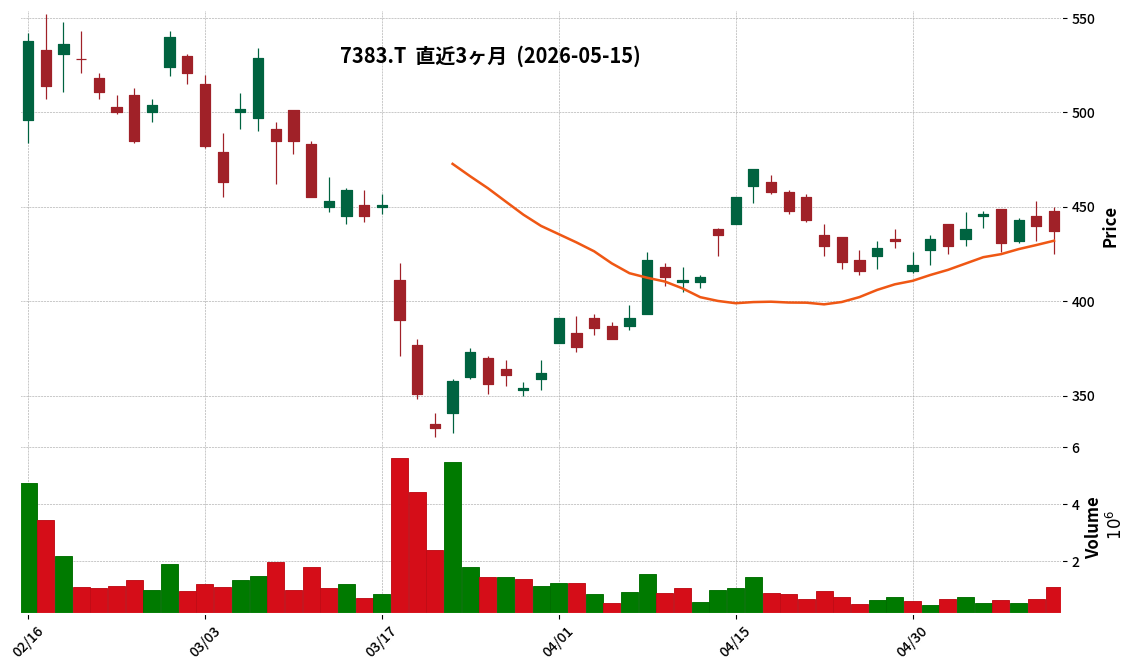
📎 Source:ネットプロHD Official IR →
This article is an AI-generated summary and analysis of official IR disclosures.
📄 Announcement (AI-Reviewed)
- Net Protections Holdings announced its full-year results for the fiscal year ended March 2026, reporting a company-wide GMV increase of 19.1% year-over-year to ¥764.3 billion, an operating profit increase of 35.4% to ¥2.84 billion, and net profit attributable to parent company shareholders up 28.3% to ¥1.73 billion.
- By service, atone’s GMV grew 55.4% year-over-year to ¥62.0 billion, and NP Kakebarai’s GMV increased 38.5% to ¥343.8 billion, driving overall growth.
- The full-year operating profit for FY2026 was approximately ¥0.6 billion below the initial forecast, attributed to a decline in operating revenue ratio (¥230 million) and an increase in marketing expenses (approximately ¥60 million).
- For the fiscal year ending March 2027, the company forecasts GMV to increase by 16.4% to ¥890.0 billion and operating profit to grow by 26.4% to ¥3.6 billion.
- The rolled-over three-year business plan (final year March 2029) targets a GMV of ¥1.4 trillion and an operating profit of ¥6.0 billion, with average annual growth rates projected at 60% for atone, 25% for B2B, and 10% for NP Kakebarai and other services.
🤖 AI Perspective
The FY2206 results highlight a significant increase in operating profit, driven by gross profit growth exceeding the rise in selling, general, and administrative expenses. The strong performance of atone and NP Kakebarai suggests that the company’s key growth drivers are functioning as planned. The robust growth projections for FY2027 and the mid-term plan indicate continued confidence in these growth strategies, alongside potential new ventures like external provision of credit scoring services.
7790|バルコス
—
▲ +0.00%
This article is an AI-generated summary and analysis of official IR disclosures.
📄 Announcement (AI-Reviewed)
- BARCOS Co., Ltd. has revised its consolidated earnings forecast upward for the fiscal year ending December 2026 (January 1, 2026 to December 31, 2026).
- Net profit attributable to owners of parent is revised from the previous forecast of ¥115 million to ¥389 million, representing a 238.4% increase.
- Sales, operating profit, and ordinary profit remain unchanged from the previous forecast.
- The primary reason for the upward revision is the recording of an extraordinary gain of ¥274 million (gain on negative goodwill) in the first quarter of the fiscal year ending December 2026, following the acquisition of all shares of Toyo Bussan Co., Ltd. and T.H. Management Co., Ltd. on January 30, 2026.
- This revision is expected to result in the highest net profit attributable to owners of parent since consolidated accounting began.
- The impact on full-year performance from the transfer of shares of Fashion News Tsushin Co., Ltd., announced on April 10, 2026, is currently under review and not included in this revised forecast.
🤖 AI Perspective
The upward revision of BARCOS’s earnings forecast is primarily driven by an extraordinary gain from M&A, rather than a shift in core business profitability, which investors may wish to note. The projection of a record-high net profit attributable to owners of parent since consolidated accounting began could be seen as a positive development for shareholder value. Investors may also want to monitor further announcements regarding the impact of the Fashion News Tsushin share transfer on future earnings.
6890|フェローテック
9460.0
▼ -3.47%
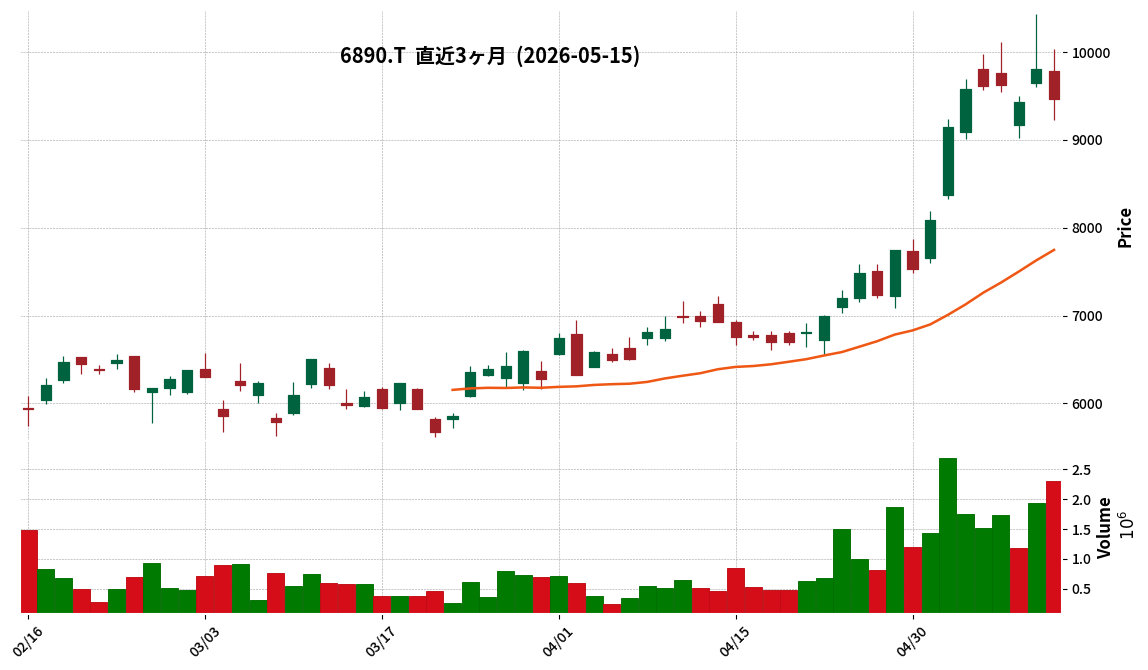
📎 Source:フェローテック Official IR →
This article is an AI-generated summary and analysis of official IR disclosures.
📄 Announcement (AI-Reviewed)
- Ferrotec Corporation resolved to change its fiscal year end at a Board of Directors meeting held on May 15, 2026.
- The change is conditional on approval at the 46th Ordinary General Meeting of Shareholders, scheduled for June 26, 2026.
- The current fiscal year end is March 31 annually, which will change to December 31 annually.
- Reasons for the change include unifying fiscal year ends within the group, improving efficiency of group business operations through timely performance management, and enhancing management transparency via timely and accurate disclosure of management information.
- The transitional 47th fiscal year will be a 9-month period, from April 1, 2026, to December 31, 2026.
- Consolidated financial forecasts for the 47th fiscal year are referenced in the “Consolidated Financial Results for the Fiscal Year Ended March 31, 2026” disclosed today.
🤖 AI Perspective
Ferrotec’s decision to change its fiscal year end appears to be a strategic move to standardize reporting across its group entities, potentially streamlining internal operations and enhancing external transparency for investors. This alignment with a December 31 year-end is common among global companies and may facilitate easier comparisons with international peers. Investors may want to note the upcoming 9-month transitional fiscal year, which could impact year-over-year growth comparisons for that specific period.
4192|G-スパイダープラス
273.0
▼ -14.15%
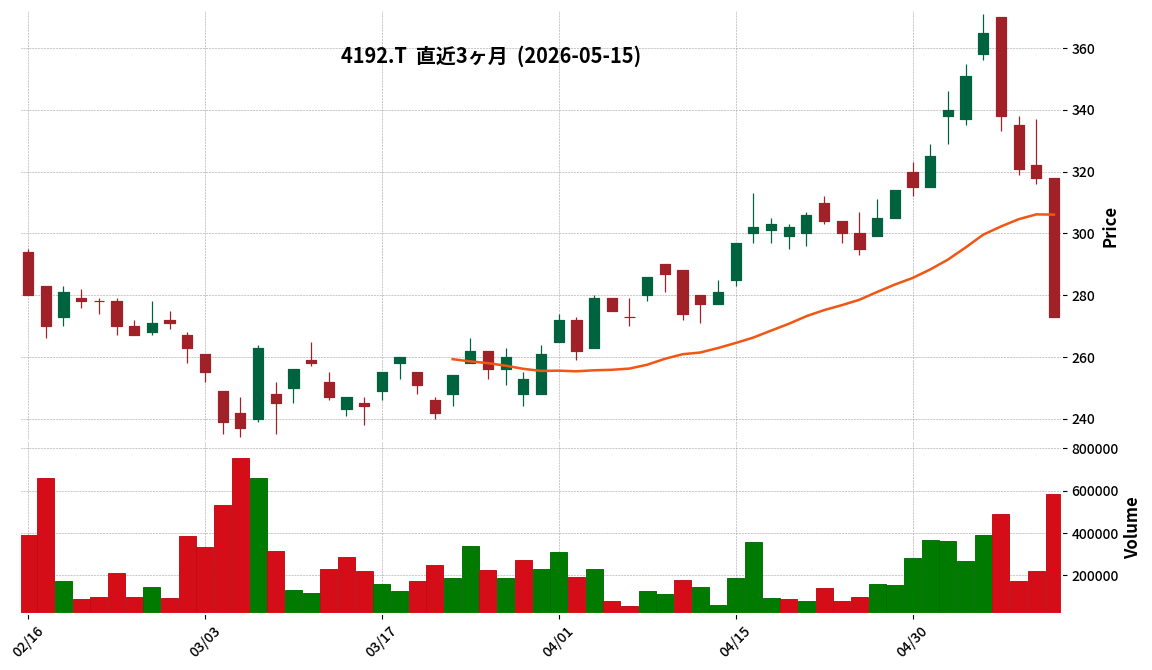
📎 Source:G-スパイダープラス Official IR →
This article is an AI-generated summary and analysis of official IR disclosures.
📄 Announcement (AI-Reviewed)
- G-SpiderPlus reported net sales of ¥1.2 billion and operating profit of ¥5 million for the first quarter of the fiscal year ending December 2026.
- Sales progress was in line with previous years, and operating profit achieved a quarterly black figure.
- ARR (Annual Recurring Revenue) landed within the expected range, with anticipated acceleration in growth from existing customers in Q2 and beyond.
- The company initiated handling of “SPIDER+” with Daiwabo Information System Co., Ltd., a major domestic IT trading company, to strengthen its sales network.
- A new service, “S+Trace” (equipment and materials management service), under the Workspace concept was launched, supervised by Takasago Thermal Engineering Co., Ltd.
🤖 AI Perspective
G-SpiderPlus’s Q1 results indicate steady progress in sales and a positive shift to operating profit, which may suggest a strengthening of profitability towards their full-year black forecast. The partnership with a major IT trading firm and the launch of the new “S+Trace” service are strategic moves that could contribute to future business expansion and are worth monitoring.
9984|ソフトバンクグループ
5745.0
▼ -0.43%
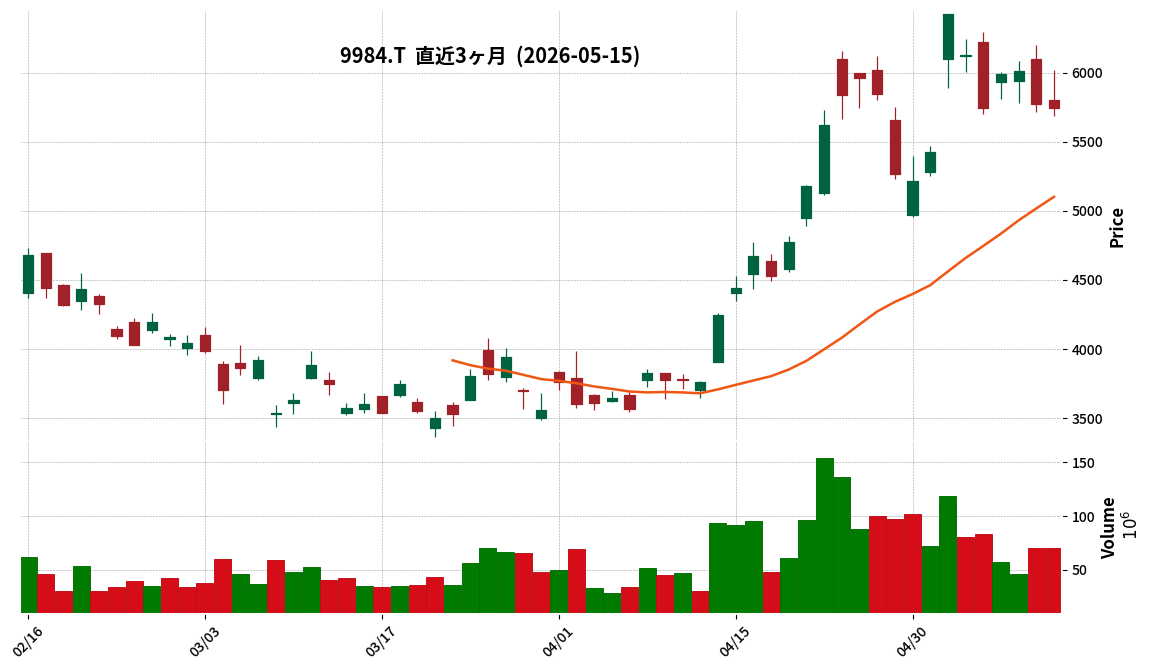
📎 Source:ソフトバンクグループ Official IR →
This article is an AI-generated summary and analysis of official IR disclosures.
📄 Announcement (AI-Reviewed)
- SoftBank Group announced on May 15, 2026, a partial correction to its “Consolidated Financial Results for the Fiscal Year Ended March 31, 2026.”
- The reason for the correction was the discovery of an error in a part of the previously released financial results, published on May 13, 2026.
- The correction specifically pertains to the “Expected date of commencement of dividend payment” in the summary information.
- The date was corrected from “June 30, 2026” to “June 25, 2026.”
🤖 AI Perspective
This correction addresses a minor clerical error regarding the dividend payment start date in the previously released financial results, with no changes to the company’s performance or the dividend amount itself. For investors, this means the dividend payment will commence five days earlier than initially stated. Such minor revisions are typically made to ensure the accuracy and reliability of disclosed information.
8591|オリックス
5772.0
▼ -0.26%
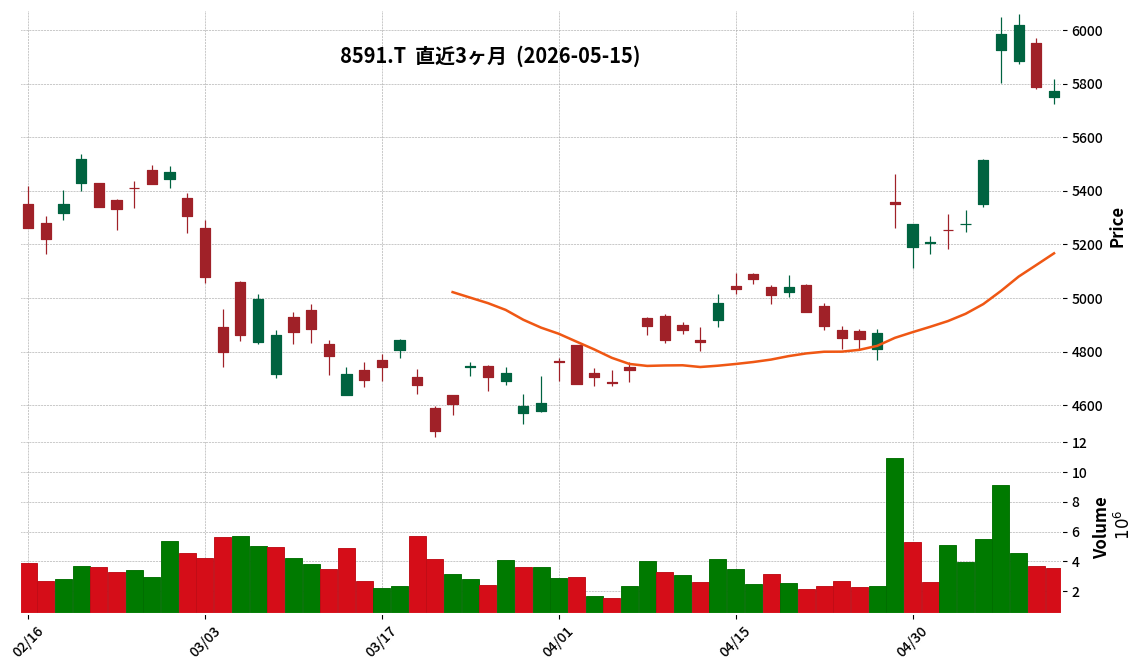
This article is an AI-generated summary and analysis of official IR disclosures.
📄 Announcement (AI-Reviewed)
- Orix Corporation announced that the full-year financial results of Toshiba Corporation for the fiscal year ended March 2026 are expected to impact Orix’s consolidated earnings for the first quarter of the fiscal year ending March 2027.
- Toshiba’s full-year results for March 2026 include ¥2.277 trillion in related gains/losses concerning Kioxia Holdings Corporation.
- Orix indirectly holds a portion of Toshiba’s shares through TB Investment Limited Partnership, an equity-method affiliate.
- The financial results of said partnership for the fourth quarter of the fiscal year ended March 2026, including the related gains/losses on securities, are expected to be reflected in Orix’s consolidated earnings for the first quarter of the fiscal year ending March 2027.
- Orix states it is currently evaluating the impact of these results on its “net income attributable to Orix Corporation shareholders” for the full fiscal year ending March 2027 and will disclose further details once a reasonable calculation is possible.
🤖 AI Perspective
This announcement indicates that Orix’s consolidated earnings for Q1 FY2027/3 will be affected by Toshiba’s recent financial results, specifically the significant Kioxia-related gains/losses. As Orix indirectly holds Toshiba shares via an equity-method affiliate, the flow-through of these results is a natural consequence. Investors may wish to monitor the upcoming disclosure from Orix regarding the quantified impact on its full-year consolidated net income, which could provide further clarity on the overall financial implications for the company.
💡 Start investing with IR insights
※ 本ページには広告が含まれます(PR)
Disclaimer: This article is for informational purposes only and does not constitute investment advice. All investment decisions are at your own risk.

コメント