
📌 Today’s Highlights
Today we cover 75 IR announcements. Notable among them: G-ノースサンド (446A), MX日株高配SMAR (461A), G-エルテス (3967). Use the table of contents below to navigate to each company.
- 446A|G-ノースサンド
- 461A|MX日株高配SMAR
- 3967|G-エルテス
- 560A|P-オカダコーポ
- 7604|梅の花グループ
- 5966|京都機械工具
- 6497|ハマイ
- 296A|G-令和AH
- 7810|クロスフォー
- 267A|P-トワライズ
- 2776|新都HD
- 3143|オーウイル
- 3195|ジェネパ
- 3399|山岡家
- 3419|アートグリーン
- 3988|SYSHD
- 5248|G-テクノロジーズ
- 5531|P-エヌバイテクノ
- 7355|P-一寸房
- 5025|G-マーキュリー
- 5071|ヴィス
- 9235|G-売れるネットG
- 1383|ベルグアース
- 1444|G-ニッソウ
- 168A|G-イタミアート
- 1840|土屋HD
- 218A|G-リベラウェア
- 2301|学情
- 2315|CAICA D
- 2480|シスロケ
- 2971|R-エスコンジャパン
- 2984|ヤマイチ
- 2997|G-ストレージ王
- 3134|Hamee
- 3234|R-森ヒルズ
- 324A|G-ブッキングR
- 3415|トウキョウベース
- 3459|R-サムティレジ
- 3468|R-スターアジア
- 3475|グッドコムアセット
- 3491|G-GA TECH
- 3565|アセンテック
- 391A|山忠
- 4053|サンアスタリスク
- 4174|アピリッツ
- 441A|G-NE
- 442A|G-クラシコ
- 4592|G-サンバイオ
- 4811|G-ドリーム・アーツ
- 4934|G-Pアンチエイジ
- 278A|G-テラドローン
- 2391|プラネット
- 184A|G-学びエイド
- 212A|フィットイージー
- 246A|G-アスア
- 2933|紀文食品
- 3169|ミサワ
- 3282|R-コンフォリア
- 3441|山王
- 4431|G-スマレジ
- 588A|S-アットマークテク
- 6309|巴工業
- 7050|G-フロンティアI
- 7811|中本パックス
- 8894|REVOLUTION
- 9237|G-笑美面
- 6838|多摩川HD
- 4446|Link-Uグループ
- 5598|P-Yottavia
- 7098|P-エージェント
- 9223|G-ASNOVA
- 3930|G-はてな
- 4378|G-CINC
- 4380|G-Mマート
- 525A|P-manebi
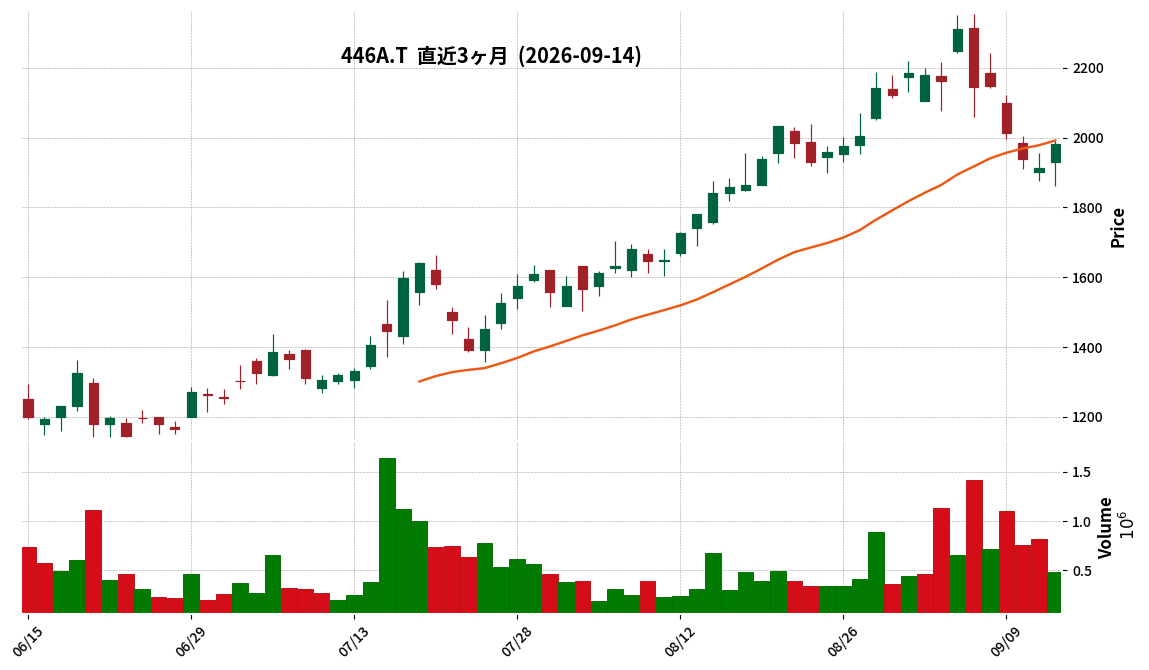
446A|G-ノースサンド
1981.0
▲ +3.50%
📎 Source:G-ノースサンド Official IR →
This article is an AI-generated summary and analysis of official IR disclosures.
📄 Announcement (AI-Reviewed)
- Northsand, Inc. announced on September 14, 2026, an addendum to its “Q2 FY2027 Earnings Presentation Material.”
- The addendum includes pages explaining the breakdown of cost of sales and selling, general & administrative (SG&A) expenses following the revised earnings forecast for FY2027.
- These new pages are added from page 15 onwards in the existing earnings presentation material.
- The IR document indicates that for Q2 FY2027 (cumulative), net sales were ¥18,445 million (up 60.2% year-on-year) and operating income was ¥3,766 million (up 68.7% year-on-year).
- The full-year earnings forecast was revised upwards, with net sales projected at ¥40,560 million (up 5.4% from the initial forecast) and operating income at ¥9,207 million (up 6.7% from the initial forecast).
🤖 AI Perspective
This addendum provides investors with more granular data on the company’s cost structure following its upward revision of earnings forecasts. The detailed breakdown of cost of sales and SG&A expenses could offer insights into the operational efficiencies and cost management strategies contributing to the improved profitability. Such specific financial details are often valuable for stakeholders in assessing the sustainability of the company’s performance and the underlying drivers of its financial outlook.
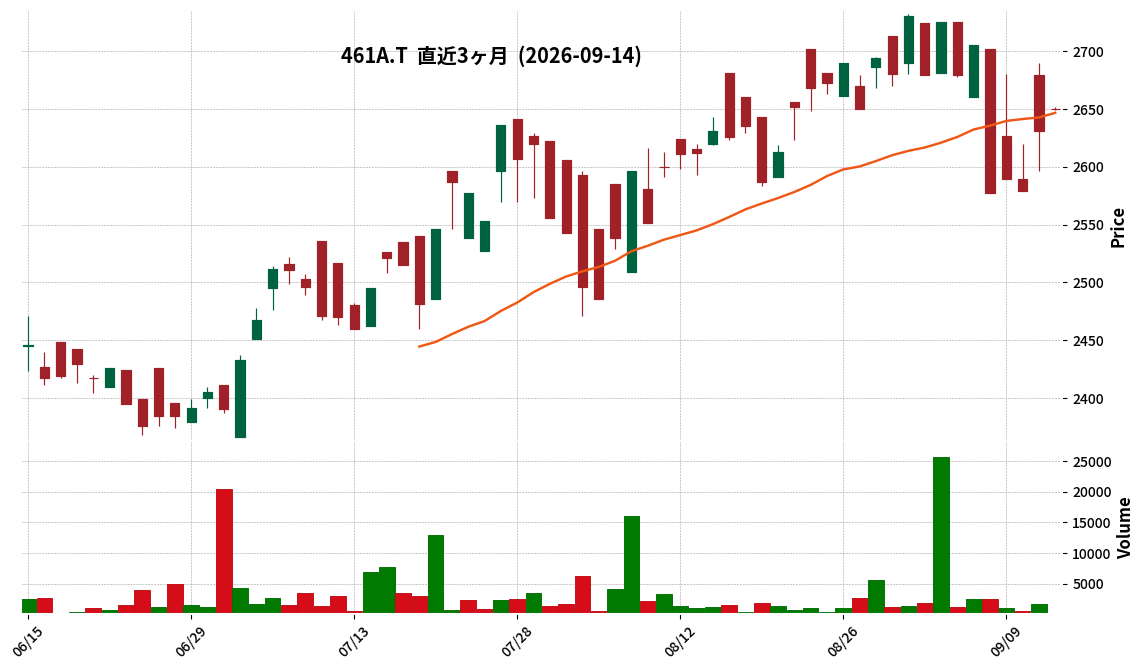
461A|MX日株高配SMAR
2650.0
▲ +0.72%
📎 Source:MX日株高配SMAR Official IR →
This article is an AI-generated summary and analysis of official IR disclosures.
📄 Announcement (AI-Reviewed)
- MAXIS Japan Equity High Dividend SMART50 ETF (Code: 461A) announced its financial results for the 2026 August term (February 11, 2026 – August 10, 2026).
- Net assets for the current term reached ¥1,582 million, an increase from ¥1,293 million in the previous term (2026 February term).
- The number of outstanding units at the end of the current term was 606 thousand units, up from 522 thousand units at the end of the previous term.
- The net asset value per 10 units increased to ¥26,113, compared to ¥24,747 in the previous term.
- The dividend per unit for the current term is ¥33. The dividend per unit for the previous term was ¥2.
🤖 AI Perspective
This financial report indicates growth in the ETF’s net assets, outstanding units, and NAV per 10 units compared to the previous period. The substantial increase in the dividend per unit from ¥2 to ¥33 for the current term may be a notable point for investors. These figures objectively present the fund’s operational status and the demand for its beneficiary certificates.
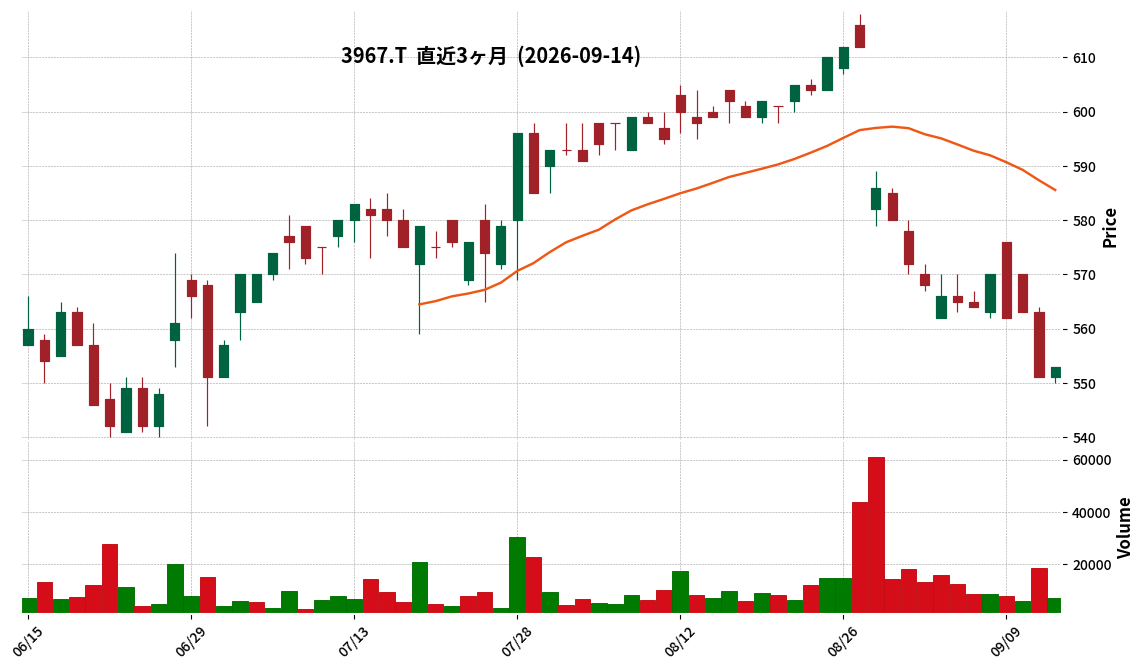
3967|G-エルテス
553.0
▲ +0.36%
This article is an AI-generated summary and analysis of official IR disclosures.
📄 Announcement (AI-Reviewed)
- ELTES Co., Ltd. announced on September 14, 2026, that it has revised its consolidated earnings forecast for the fiscal year ending February 2027 upwards.
- Net sales remain unchanged at 8,500 million yen from the previous forecast.
- Operating profit is revised upwards by 20 million yen (4.3%) from 460 million yen to 480 million yen.
- Profit attributable to owners of parent is revised upwards by 80 million yen (80.0%) from 100 million yen to 180 million yen.
- Reasons for the revision include better-than-expected performance in the Digital Security Business and Physical Security Business, growing track record of “MyGuard Pro,” and the recording of extraordinary gains from the sale of investment securities (47 million yen) and extinguishment of treasury stock acquisition rights (12 million yen).
🤖 AI Perspective
This upward revision to the earnings forecast is notable for the significant increase in profit items despite unchanged net sales. The 80% increase in profit attributable to owners of parent, combined with extraordinary gains, may suggest an improvement in corporate profitability. The steady progress in core businesses and accelerated growth investments could indicate positive implications for future business development, warranting continued monitoring by investors.
560A|P-オカダコーポ
1123.0
▲ +0.00%
📎 Source:P-オカダコーポ Official IR →
This article is an AI-generated summary and analysis of official IR disclosures.
📄 Announcement (AI-Reviewed)
- P-Okada Corp. announced its consolidated financial results for the fiscal year ended July 2026.
- Sales reached ¥3,411 million (up 7.6% year-on-year), operating income was ¥80 million (up 16.2%), and ordinary income was ¥36 million (up 7.4%).
- Net profit attributable to parent company shareholders was ¥12 million (down 54.6% year-on-year).
- The company was newly listed on the Tokyo Stock Exchange TOKYO PRO Market on April 15, 2026.
- It entered the fitness business (“FIT-EASY” brand) as a new venture during the consolidated fiscal year.
- For the fiscal year ending July 2027, the company forecasts consolidated sales of ¥3,388 million (down 0.7% year-on-year), operating income of ¥126 million (up 56.6%), and net profit attributable to parent company shareholders of ¥41 million (up 231.7%).
🤖 AI Perspective
P-Okada Corp.’s fiscal year 2026 results show an increase in sales and operating income, while net profit attributable to parent company shareholders decreased. This divergence may suggest an impact from increased costs associated with business expansion or other one-off factors. Given the active corporate transformation, including the new listing and entry into the fitness business, and the strong profit recovery projected for the next fiscal year, the company’s future business developments could be worth monitoring.
Disclaimer: This article is for informational purposes only and does not constitute investment advice.
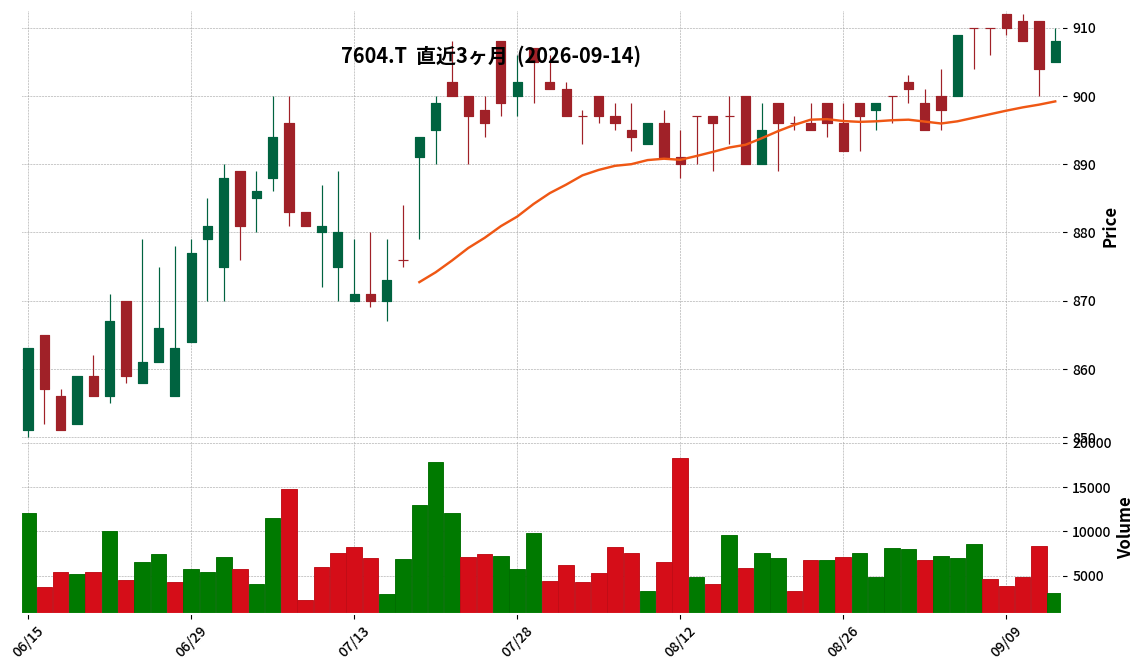
7604|梅の花グループ
908.0
▲ +0.44%
📎 Source:梅の花グループ Official IR →
This article is an AI-generated summary and analysis of official IR disclosures.
📄 Announcement (AI-Reviewed)
- For the first quarter of fiscal year 2027 (May 1, 2026 – July 31, 2026), consolidated net sales were ¥7,005 million, a 0.3% decrease compared to the same period last year.
- Consolidated operating income reached ¥83 million, turning profitable from an operating loss of ¥(17) million in the prior year’s first quarter.
- Consolidated ordinary loss improved to ¥(11) million, compared to an ordinary loss of ¥(92) million in the previous year.
- Net loss attributable to owners of parent was ¥(50) million, an improvement from a net loss of ¥(119) million in the prior year’s first quarter.
- Total assets stood at ¥22,547 million, net assets at ¥2,006 million, and the equity ratio was 8.9%.
- The dividend forecast for common shares remains unchanged at ¥5.00 for the year-end, totaling ¥10.00 annually.
🤖 AI Perspective
Umenohana Group’s Q1 FY2027 results show a notable shift to operating profitability despite nearly flat sales. This suggests that internal efforts such as menu revisions, price adjustments, and manufacturing process efficiencies are having a positive impact. However, the rise in interest expenses due to increased interest rates is weighing on ordinary income, indicating that financial market conditions could influence future performance and are worth monitoring.
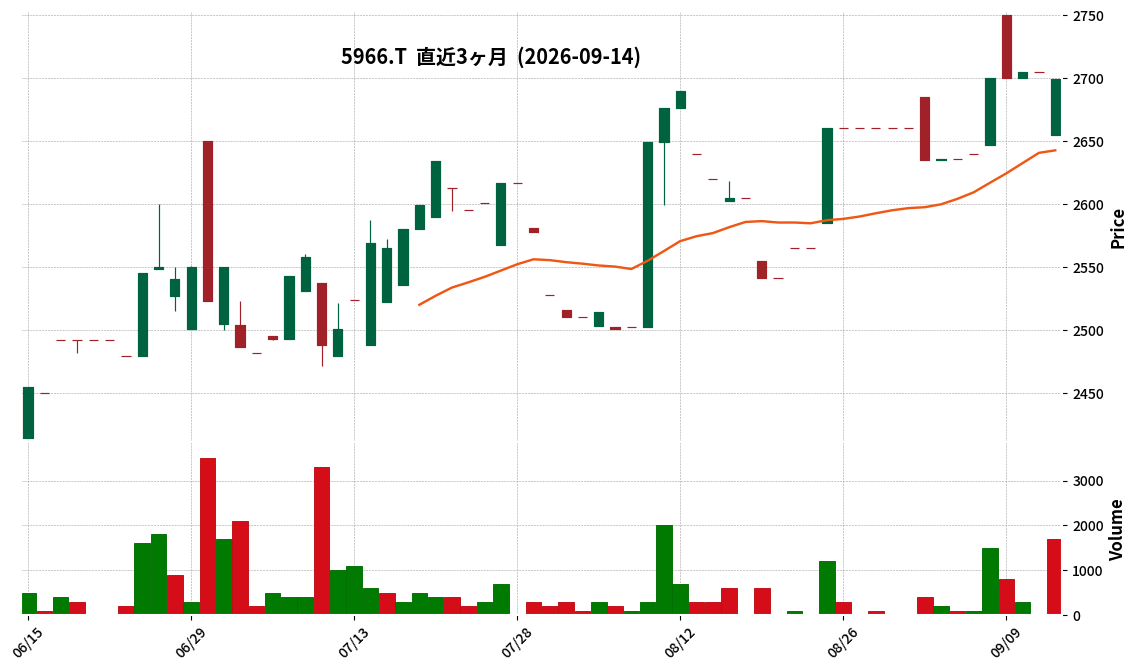
5966|京都機械工具
2699.0
▼ -0.22%
This article is an AI-generated summary and analysis of official IR disclosures.
📄 Announcement (AI-Reviewed)
- Kyoto Tool Co. (KTC) announced its transition to non-consolidated financial statements starting from the third quarter of the fiscal year ending March 2027 (from October 1, 2026).
- This transition is due to the absorption merger of its wholly-owned subsidiaries, Hokuriku KTC Tool Co., Ltd. and HI-TOOL Co., Ltd., effective October 1, 2026.
- The full-year individual performance forecast for the fiscal year ending March 2027 has been revised. Sales are revised upward from JPY 8,200 million to JPY 8,300 million (+1.2%).
- Operating profit is revised downward from JPY 690 million to JPY 650 million (△5.8%), ordinary profit from JPY 730 million to JPY 690 million (△5.5%), and net profit from JPY 510 million to JPY 480 million (△5.9%).
- The upward revision in sales is attributed to the inclusion of the merged subsidiaries’ sales in individual results, while the downward revision in profits is due to remaining business losses at Hokuriku KTC.
- There are no changes to the performance forecasts for the second quarter (cumulative) of FY2027 or to the dividend forecast (JPY 40 per share for interim and JPY 40 per share for year-end).
🤖 AI Perspective
This announcement from Kyoto Tool Co. informs the market about a change in accounting treatment due to an internal corporate restructuring and the resulting adjustments to its performance forecasts. The transition to non-consolidated statements, as the company will no longer have consolidated subsidiaries, reflects the progress of its corporate reorganization. While sales are projected to increase post-merger, the impact of the subsidiary’s business losses on overall profitability may be a point of interest for investors.
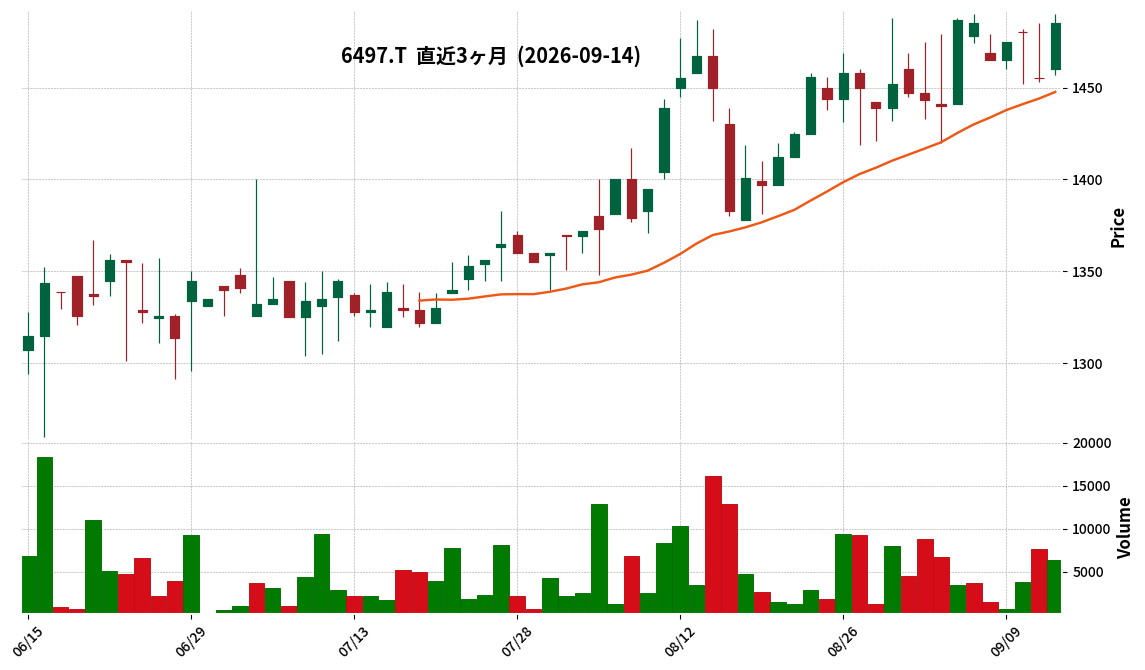
6497|ハマイ
1485.0
▲ +2.06%
This article is an AI-generated summary and analysis of official IR disclosures.
📄 Announcement (AI-Reviewed)
- Hamai Co., Ltd. announced on September 14, 2026, the submission of restated annual securities reports and other filings to the Kanto Local Finance Bureau, along with corrections to past financial highlights.
- The primary reason for the restatement is the discovery of overstatement in inventory balances due to a change in inventory valuation policy, approved by the Board of Directors on June 29, 2026, to calculate inventory turnover on an individual item basis rather than by large inventory groups.
- The corrections cover a broad range of documents, including Annual Securities Reports, Semi-Annual Reports, Quarterly Reports, and Financial Highlights from the fiscal years ending December 2021 through December 2025.
- Specific adjustments include recording inventory valuation losses, cancelling increases in estimated surrender value of insurance reserves (miscellaneous income) from FY2021 to FY2025, and cancelling a reduction in share-based payment expenses related to the gratuitous acquisition of treasury shares in FY2025.
- The impact on consolidated performance includes, for the full year of FY2021, a decrease in operating profit by 83,546 thousand yen (16.4%) and net profit attributable to parent company shareholders by 80,389 thousand yen (18.5%), with total assets decreasing by 493,610 thousand yen (2.7%). For Q1 FY2025, operating profit decreased by 194,600 thousand yen (56.7%) and net profit attributable to parent company shareholders by 192,365 thousand yen (94.8%).
🤖 AI Perspective
This restatement, stemming from a revised inventory valuation method, significantly impacts Hamai’s financial statements and highlights across multiple past fiscal periods. Investors will note that key financial metrics such as operating profit, net profit attributable to parent company shareholders, total assets, and net assets have been revised, necessitating a re-evaluation of historical performance and future projections based on these updated figures. The context of a change in accounting auditors leading up to these corrections may also warrant attention regarding the company’s corporate governance framework.
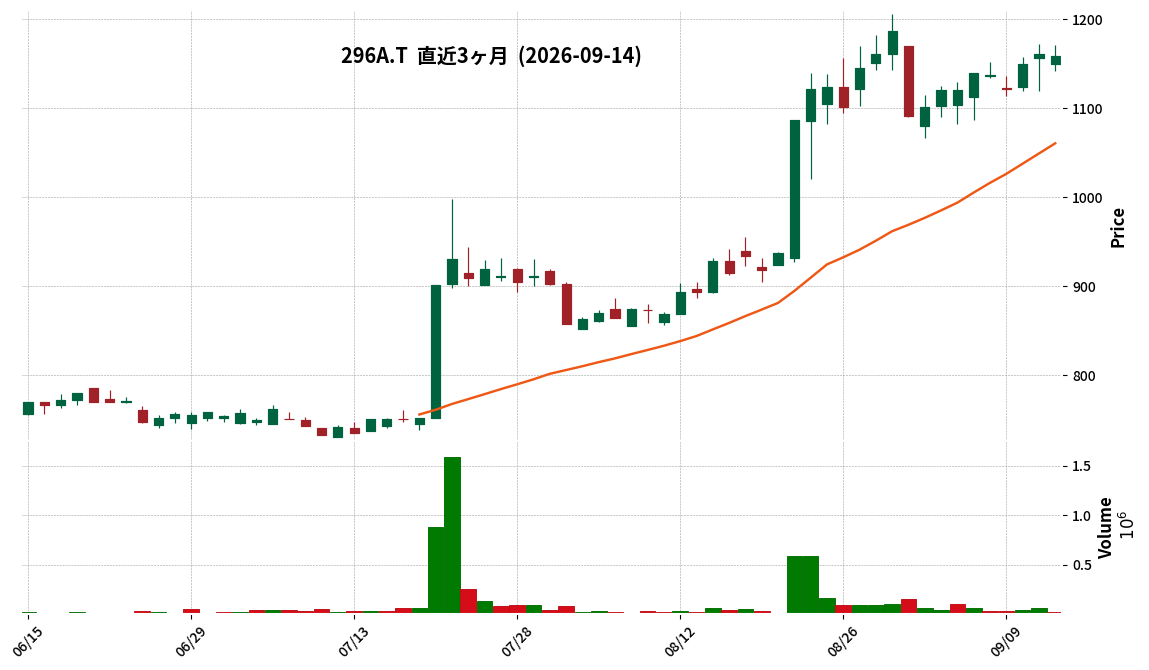
296A|G-令和AH
1159.0
▼ -0.17%
This article is an AI-generated summary and analysis of official IR disclosures.
📄 Announcement (AI-Reviewed)
- G-Reiwa AH announced on September 14, 2026, revisions to its Q2 FY2027 (interim period) earnings forecast and dividend forecast.
- The consolidated earnings forecast was revised upwards, with revenue moving from ¥2,920 million to ¥2,960 million, operating profit from ¥878 million to ¥1,054 million, ordinary profit from ¥875 million to ¥1,051 million, and net income attributable to owners of parent from ¥575 million to ¥679 million.
- The revision percentages are an increase of 1.4% for revenue, 20.0% for operating profit, 20.1% for ordinary profit, and 18.1% for net income attributable to owners of parent.
- The company attributed the revision to steady revenue growth and improved profitability, primarily due to enhanced operational efficiency leading to faster project completion.
- The interim dividend forecast was revised upwards from ¥13.00 per share to ¥16.50 per share, consequently increasing the total annual dividend from ¥33.00 to ¥36.50.
- The basic dividend policy is a standalone payout ratio of 80%, with an additional 1% to 10% in lieu of shareholder benefits, targeting an annual payout ratio of 81% to 90%. The current increase was decided based on an approximate standalone payout ratio of 85%.
🤖 AI Perspective
The upward revision of the earnings forecast suggests not only robust revenue performance but also potential improvements in the company’s profitability through operational efficiencies. This could indicate a strengthening of the company’s core business structure. Furthermore, the increased interim dividend, aligned with a stable performance trend and an active shareholder return policy, may be a point of interest for investors to monitor.
7810|クロスフォー
162.0
▲ +3.18%
This article is an AI-generated summary and analysis of official IR disclosures.
📄 Announcement (AI-Reviewed)
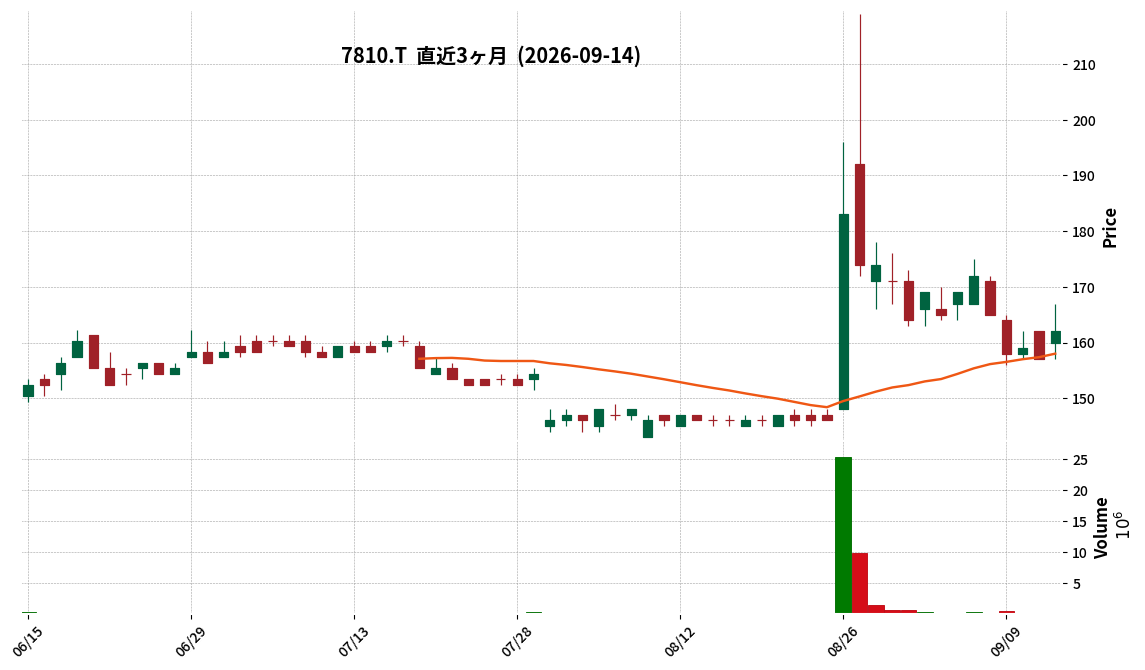
- Crossfor Co., Ltd. has announced its consolidated financial results for the fiscal year ended July 2026.
- Net sales reached ¥5,536 million (an increase of 47.3% year-on-year), operating profit was ¥94 million (an increase of 71.2% year-on-year), ordinary profit was ¥61 million (an increase of 157.9% year-on-year), and profit attributable to owners of parent was ¥26 million (an increase of 18.8% year-on-year).
- The increase in sales was primarily attributed to strong domestic performance in product proposals for live sales, exhibition sales, and bullion-related products.
- The year-end dividend for the fiscal year ended July 2026 was ¥0.63 per share (annual total ¥0.63), an increase from ¥0.35 per share in the previous fiscal year.
- For the fiscal year ending July 2027, the company forecasts consolidated net sales of ¥5,920 million (an increase of 6.9% year-on-year), operating profit of ¥120 million (an increase of 26.4% year-on-year), ordinary profit of ¥75 million (an increase of 21.7% year-on-year), and profit attributable to owners of parent of ¥50 million (an increase of 90.5% year-on-year).
🤖 AI Perspective
Crossfor’s FY2026 results indicate significant revenue growth and profitability across all income stages, driven by robust domestic sales. While domestic operations performed strongly, international sales saw a slight decline, potentially influenced by rising precious metal prices, suggesting that the progress of global expansion could be a key area to monitor. The increased dividend and positive outlook for FY2027 may reflect management’s confidence in future performance.
267A|P-トワライズ
1815.0
▲ +0.00%
📎 Source:P-トワライズ Official IR →
This article is an AI-generated summary and analysis of official IR disclosures.
📄 Announcement (AI-Reviewed)
- P-TOWARISE Co., Ltd. has announced its consolidated financial results for the fiscal year ended July 2026.
- For FY2026, consolidated operating revenue was ¥7,533 million (up 5.3% year-on-year), operating profit was ¥927 million (up 22.3%), and ordinary profit was ¥958 million (up 13.3%).
- Net income attributable to owners of the parent was ¥657 million (up 63.5% year-on-year).
- The annual dividend per share increased from ¥10.00 in the previous fiscal year to ¥20.00 (interim ¥0.00, year-end ¥20.00).
- For the fiscal year ending July 2027, the company forecasts consolidated operating revenue of ¥7,942 million (up 5.4% year-on-year), but anticipates a decrease in profit: operating profit of ¥776 million (down 16.3%), ordinary profit of ¥786 million (down 18.0%), and net income attributable to owners of the parent of ¥532 million (down 18.9%).
🤖 AI Perspective
The FY2026 results show significant profit growth driven by increased revenue and profit in both the credit finance and mobile phone segments. The increased dividend payout reflects the strong performance of the past fiscal year. However, despite projecting higher revenue for FY2027, the company forecasts a decline in profits, which may prompt investors to monitor the factors influencing this outlook, such as changes in the operating environment or strategic shifts.
2776|新都HD
103.0
▼ -0.96%
This article is an AI-generated summary and analysis of official IR disclosures.
📄 Announcement (AI-Reviewed)
- Shinto Holdings Co., Ltd. announced its consolidated financial results for the second quarter (interim) of the fiscal year ending January 2027.
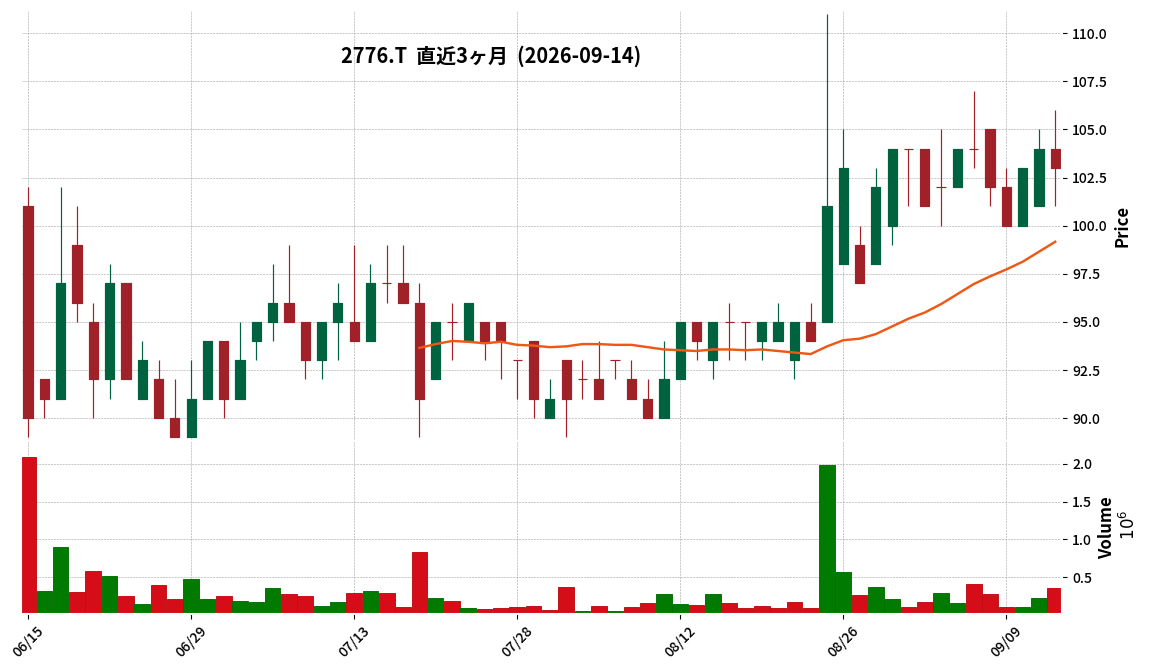
- Consolidated net sales reached ¥31,323 million, marking a 214.15% increase compared to the same period of the previous fiscal year.
- Consolidated operating profit was ¥412 million (vs. an operating loss of ¥7 million in the prior interim period), and consolidated ordinary profit was ¥394 million (vs. an ordinary loss of ¥61 million in the prior interim period).
- Net profit attributable to owners of parent stood at ¥48 million (vs. a net loss of ¥128 million in the prior interim period).
- The metal recycling business segment reported sales of ¥29,544 million (up 227.53% YoY) and segment profit of ¥625 million (up 344.82% YoY).
🤖 AI Perspective
Shinto Holdings’ interim results show a significant turnaround, with revenue more than doubling and key profit metrics moving from losses to positive figures. The robust performance of the metal recycling business appears to be a primary driver of this growth and profitability improvement. Investors may find it worthwhile to monitor how this momentum translates into the company’s full-year outlook and further strategic developments.
3143|オーウイル
707.0
▼ -0.42%
This article is an AI-generated summary and analysis of official IR disclosures.
📄 Announcement (AI-Reviewed)
- OWIL announced on September 14, 2026, the detailed specifics of its shareholder benefit program.
- Eligible shareholders are those recorded in the company’s shareholder register as of the end of September each year, holding 300 shares or more.
- The benefits are: a ¥1,000 original QUO card for shareholders holding 300 shares to less than 1,000 shares, and food products worth ¥5,000 for shareholders holding 1,000 shares or more.
- Benefits will be distributed annually in early December, with a “Shareholder Benefit Guide” mailed to eligible shareholders. Recipients of gift products will select their desired item via a special website or by mail.
- The gift product selection includes nine items such as a yakitori/tuna/side dish canned food variety set, Kishu Nanko ume plums “Sankei,” and Shinshu apple juice assortment.
🤖 AI Perspective
This announcement finalizes the specific details of the shareholder benefit program initially disclosed on May 11, 2026. The choice of food products from the company’s group and key business partners for shareholders holding 1,000 shares or more reflects OWIL’s focus on the food sector. This approach could offer shareholders a direct connection to the company’s core business and product offerings, potentially enhancing engagement.
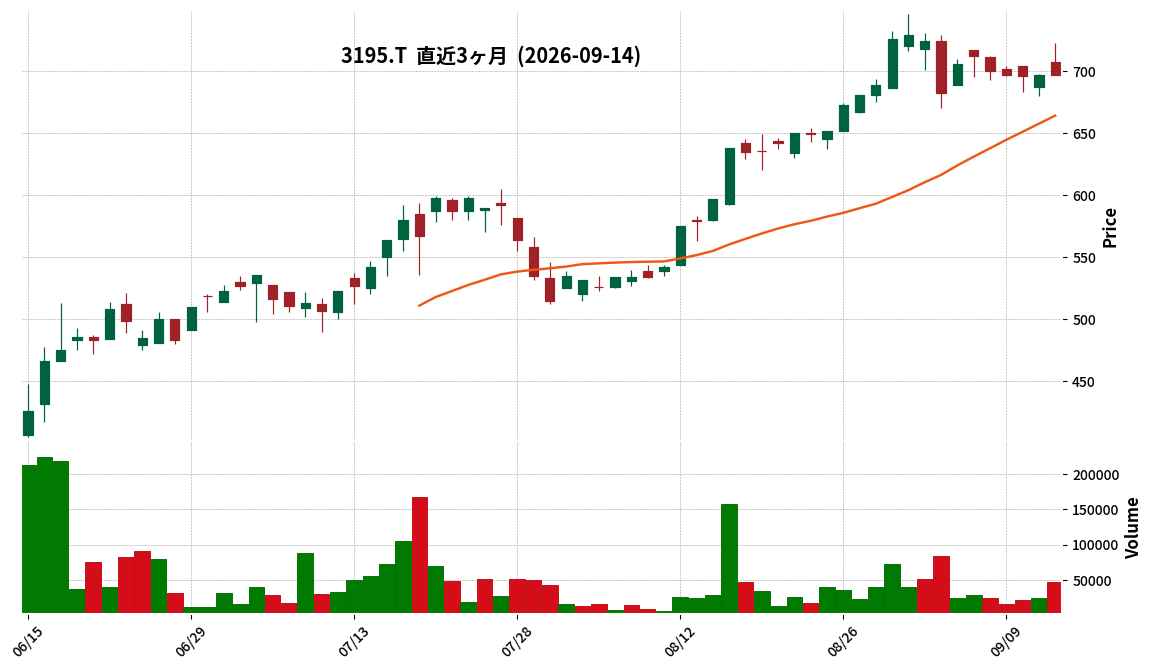
3195|ジェネパ
697.0
▲ +0.00%
This article is an AI-generated summary and analysis of official IR disclosures.
📄 Announcement (AI-Reviewed)
- For the nine months ended July 31, 2026, Genepa reported consolidated net sales of ¥15,852 million, a 26.8% increase compared to the same period last year.
- Operating profit for the period was ¥170 million, marking a 59.2% increase year-over-year. Ordinary profit reached ¥144 million, up 19.9%.
- Net profit attributable to owners of the parent decreased by 51.5% to ¥56 million.
- Basic earnings per share for the quarter were ¥6.89.
- The full-year consolidated earnings forecast for FY2026 remains unchanged, projecting net sales of ¥18,600 million (up 12.4%), operating profit of ¥250 million (up 118.6%), ordinary profit of ¥240 million (up 34.4%), and net profit attributable to owners of the parent of ¥180 million (up 11.5%).
- Total assets at the end of the third quarter stood at ¥7,183 million, with net assets at ¥2,072 million, and an equity ratio of 28.9%.
🤖 AI Perspective
Genepa’s Q3 FY2026 results show robust growth in sales and operating profit, which may indicate strength in its core business operations. However, the notable decrease in net profit attributable to owners of the parent, largely due to a ¥49 million extraordinary loss from business restructuring at Kannart Co., Ltd., suggests that one-off factors have impacted profitability. Investors may wish to monitor the ongoing effects of these restructuring initiatives and their potential impact on future earnings.
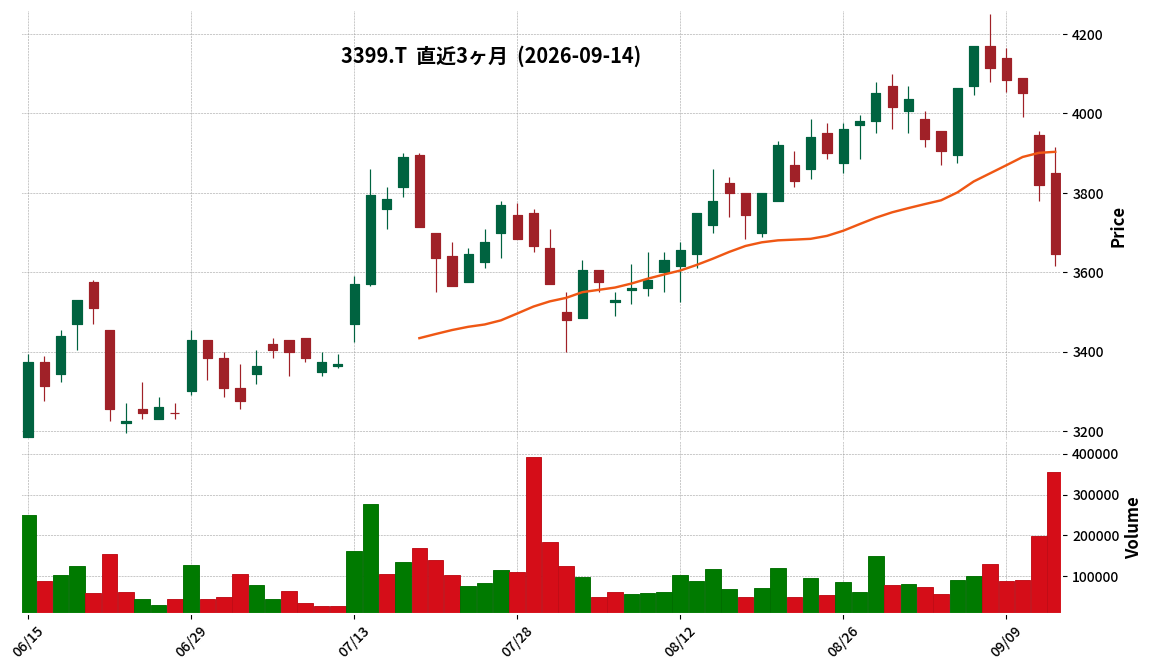
3399|山岡家
3645.0
▼ -4.58%
This article is an AI-generated summary and analysis of official IR disclosures.
📄 Announcement (AI-Reviewed)
- Maruchiyo Yamaokaya Co., Ltd. reported record-high interim results for the fiscal year ending January 2027, with sales of ¥22,868 million (+15.4% YoY), ordinary profit of ¥2,538 million (+26.8% YoY), and net income attributable to owners of parent of ¥1,778 million (+29.3% YoY).
- Both sales and ordinary profit exceeded initial plans by ¥429 million and ¥492 million, respectively.
- Existing store sales increased by 9.5% YoY, and customer traffic by 7.6% YoY, marking 52 consecutive months of year-over-year growth.
- During the interim period, the company opened 5 new stores, including “Ramen Yamaokaya Takamatsu Chuo Inter Store,” and 1 relocation store. Interim periodic bonuses totaling ¥154 million were paid.
- Cost of sales ratio was 31.0% (0.6 percentage points worse YoY), but selling, general, and administrative (SG&A) expenses ratio improved to 58.1% (1.6 percentage points better YoY), absorbing the increase in raw material costs.
🤖 AI Perspective
Yamaokaya’s interim financial results demonstrate strong performance, with record-high sales and profits, significantly surpassing initial forecasts. The sustained growth in existing store sales, coupled with new store openings, appears to be driving revenue expansion. The ability to offset rising raw material costs through improved SG&A efficiency may suggest effective cost management. Investors may monitor the company’s progress towards its full-year targets and its continued new store rollout strategy.
3419|アートグリーン
—
▲ +0.00%
📎 Source:アートグリーン Official IR →
This article is an AI-generated summary and analysis of official IR disclosures.
📄 Announcement (AI-Reviewed)
- Art Green announced its consolidated financial results for the third quarter of the fiscal year ending October 2026 (November 1, 2025, to July 31, 2026).
- Consolidated net sales reached ¥2,042 million, marking a 6.0% increase compared to the same period last year.
- Operating profit was ¥35 million (down 8.2% YoY), ordinary profit was ¥34 million (down 6.4% YoY), and net income attributable to owners of the parent was ¥20 million (down 3.5% YoY).
- Diluted earnings per share for the quarter were ¥17.35.
- The full-year consolidated earnings forecast (net sales ¥2,565 million, net income ¥3 million) and the annual dividend forecast (¥0.00) remain unchanged.
- As of the end of the third quarter, total assets stood at ¥1,309 million, net assets at ¥546 million, and the equity ratio at 41.8%.
- By business segment, sales in the Flower Business Support segment increased to ¥1,460 million (up 10.9% YoY), while Nursery Support segment sales decreased to ¥419 million (down 2.5% YoY) and Funeral Business segment sales decreased to ¥162 million (down 19.1% YoY).
🤖 AI Perspective
Art Green achieved a revenue increase in Q3, but rising logistics costs, personnel expenses, and material prices reportedly pressured profits. The strong performance in the Flower Business Support segment drove overall sales growth, while the Nursery Support and Funeral Business segments experienced declines, indicating a divergence in segment performance. With the full-year forecast unchanged, investors may monitor the company’s performance in the remaining period.
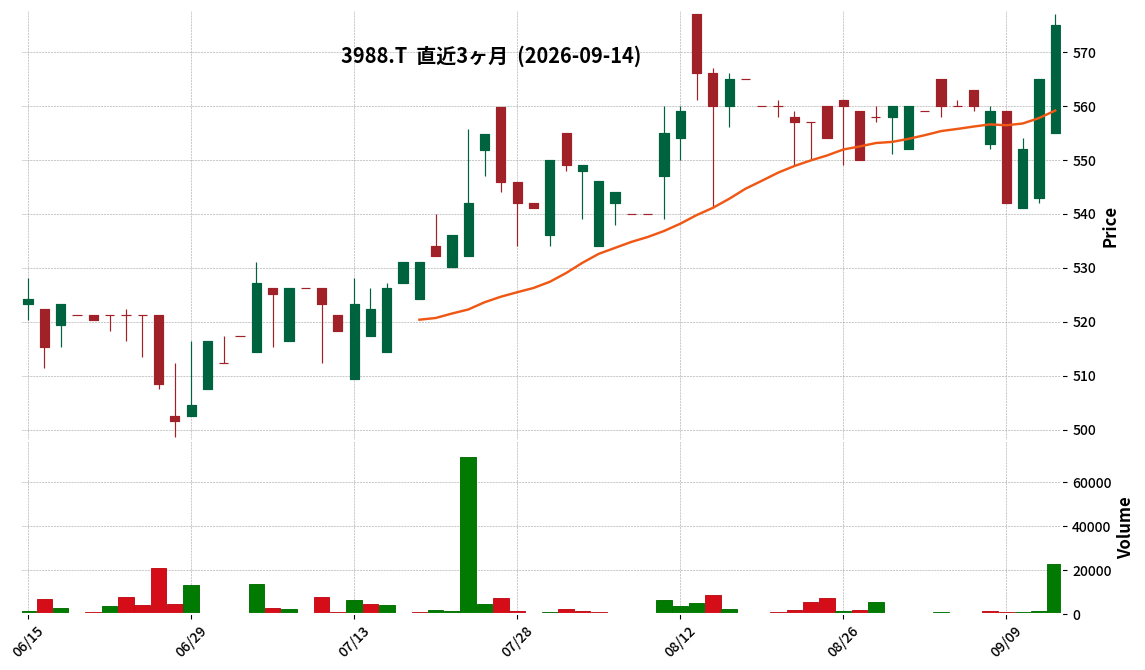
3988|SYSHD
575.0
▲ +1.77%
This article is an AI-generated summary and analysis of official IR disclosures.
📄 Announcement (AI-Reviewed)
- For the fiscal year ended July 2026, SYSHD reported consolidated net sales of ¥15,673 million (up 11.5% year-on-year), operating income of ¥797 million (up 13.1%), ordinary income of ¥857 million (up 17.0%), and net income attributable to owners of parent of ¥548 million (up 29.5%).
- Net sales, operating income, ordinary income, and net income attributable to owners of parent for the current consolidated fiscal year all reached record highs.
- For the fiscal year ending July 2027, the company forecasts consolidated net sales of ¥18,000 million (up 14.8% year-on-year), operating income of ¥1,133 million (up 42.1%), ordinary income of ¥1,119 million (up 30.5%), and net income attributable to owners of parent of ¥664 million (up 21.2%).
- The year-end dividend for the fiscal year ended July 2026 was ¥8.00 per share (compared to ¥7.00 in the previous fiscal year), and the forecast for the fiscal year ending July 2027 is ¥9.00 per share.
- Sales for the Global Manufacturing Solutions segment were ¥5,844 million (up 12.0% year-on-year), and for the Social Information Infrastructure Solutions segment were ¥9,565 million (up 11.6%).
🤖 AI Perspective
SYSHD achieved record-high sales and profits across all major metrics for the fiscal year ended July 2026. This performance appears to be driven by the integration of new consolidated subsidiaries from M&A activities and robust order intake from social information infrastructure clients. The company’s forecast for the next fiscal year suggests continued strong growth, with a particularly notable projected increase of over 40% in operating income, which may indicate confidence in their strategic initiatives.
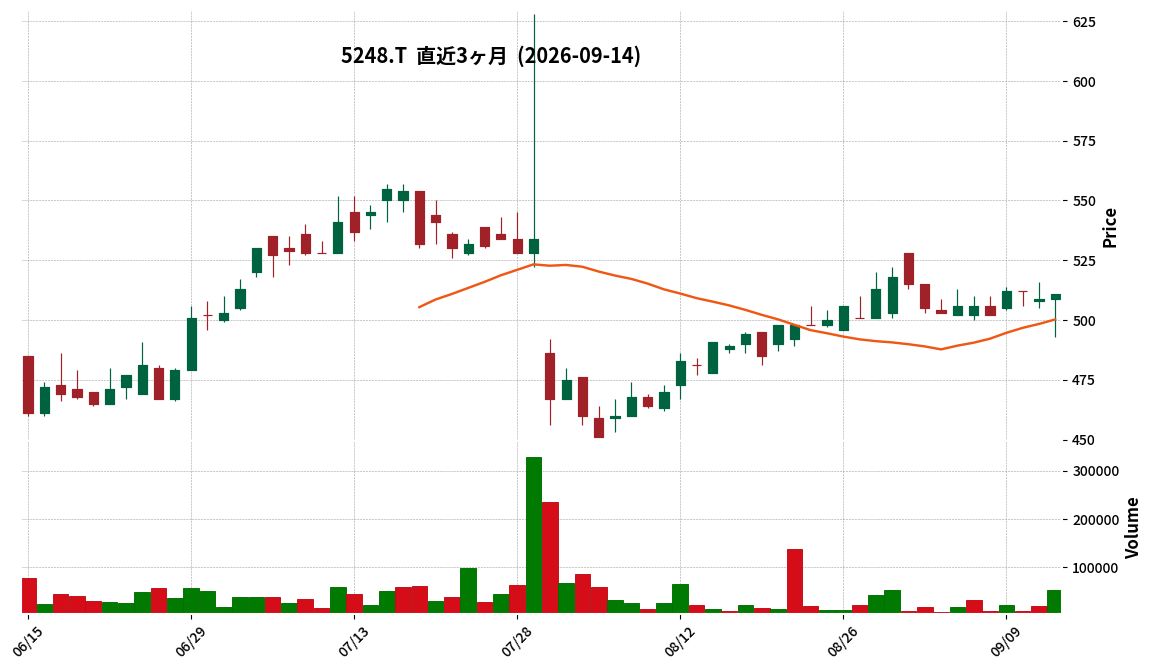
5248|G-テクノロジーズ
511.0
▲ +0.39%
📎 Source:G-テクノロジーズ Official IR →
This article is an AI-generated summary and analysis of official IR disclosures.
📄 Announcement (AI-Reviewed)
- Consolidated net sales for the second quarter (interim period) of the fiscal year ending January 2027 reached ¥5.297 billion, an increase of 28.5% compared to the same period of the previous year.
- Consolidated operating profit was ¥533 million (down 41.5% YoY), and consolidated ordinary profit was ¥342 million (down 60.4% YoY).
- Net income attributable to parent company shareholders shifted from a profit of ¥147 million in the prior interim period to a loss of ¥10 million in the current period.
- By segment, Renewable Energy Solutions recorded the largest sales at ¥4.730 billion (up 32.2% YoY), with segment profit of ¥651 million (down 32.7% YoY).
- IT Solutions segment reported sales of ¥325 million (down 26.5% YoY) and a segment loss of ¥106 million. SaaS segment reported sales of ¥154 million (up 54.4% YoY) and a segment loss of ¥17 million.
- The consolidated full-year earnings forecast for the fiscal year ending January 2027 is not provided at this time, as a proper and reasonable calculation is deemed difficult.
🤖 AI Perspective
While G-Technologies reported a substantial increase in net sales compared to the prior interim period, the significant decline in operating and ordinary profit, culminating in a net loss attributable to parent shareholders, is a key point for investors to monitor. The Renewable Energy Solutions segment’s decreased profit despite higher sales, and the SaaS segment’s growth in sales but continued segment loss after corporate overhead allocation, could indicate challenges in profitability or cost structures. The absence of a full-year earnings forecast suggests ongoing uncertainties that may warrant close attention to future disclosures on business strategies and profit improvement initiatives.
5531|P-エヌバイテクノ
—
▲ +0.00%
📎 Source:P-エヌバイテクノ Official IR →
This article is an AI-generated summary and analysis of official IR disclosures.
📄 Announcement (AI-Reviewed)
- P-Nbytec Technologies Co., Ltd. announced its interim financial results for the fiscal year ending January 2027 (February 1, 2026 – July 31, 2026).
- Net sales reached ¥3,231 million, marking a 55.8% increase compared to the same period last year.
- Operating profit was ¥178 million (vs. an operating loss of ¥153 million in the prior year), ordinary profit was ¥71 million (vs. an ordinary loss of ¥205 million), and interim net profit was ¥42 million (vs. an interim net loss of ¥136 million), all showing improvement from the previous year.
- Total assets amounted to ¥7,360 million (an increase of ¥2,716 million from the end of the previous fiscal year), and net assets were ¥462 million (an increase of ¥13 million from the end of the previous fiscal year).
- The full-year forecast for FY2027 remains unchanged, projecting net sales of ¥8,835 million, operating profit of ¥501 million, ordinary profit of ¥301 million, and net profit of ¥195 million.
🤖 AI Perspective
P-Nbytec demonstrated substantial growth in net sales and a turnaround from losses to profits across all key income categories in the interim period, primarily driven by progress in income property sales. With the full-year performance forecast remaining unchanged despite the strong interim results, investors may monitor for any potential future revisions.
7355|P-一寸房
—
▲ +0.00%
This article is an AI-generated summary and analysis of official IR disclosures.
📄 Announcement (AI-Reviewed)
- P-Issunbo reported non-consolidated financial results for the fiscal year ended July 2026, with net sales of ¥1,166 million (down 1.3% year-on-year), operating profit of ¥24 million (down 15.0%), ordinary profit of ¥23 million (down 23.0%), and net profit of ¥11 million (down 42.1%).
- Diluted earnings per share were ¥20.80, and the equity ratio was 22.1%.
- Cash flow from operating activities resulted in an outflow of ¥24 million (compared to an inflow of ¥75 million in the prior fiscal year).
- For the fiscal year ending July 2027, the company forecasts net sales of ¥1,175 million (up 0.8% year-on-year), operating profit of ¥15 million (down 37.7%), ordinary profit of ¥15 million (down 34.2%), and net profit of ¥12 million (up 4.8%).
- Dividends per share for both the interim and fiscal year-end periods were ¥0.00 for FY2025 and FY2026 July. The company also projects ¥0.00 for FY2027 July.
🤖 AI Perspective
P-Issunbo’s fiscal year 2026 July saw a decline in both revenue and profit. However, the company projects an increase in net sales and net profit for fiscal year 2027 July, despite an anticipated decrease in operating and ordinary profits. The company’s initiatives to improve profitability and the impact of its strategic focus on BIM/CIM, XR, and AI technologies on achieving its future forecasts may be key areas for investors to monitor.
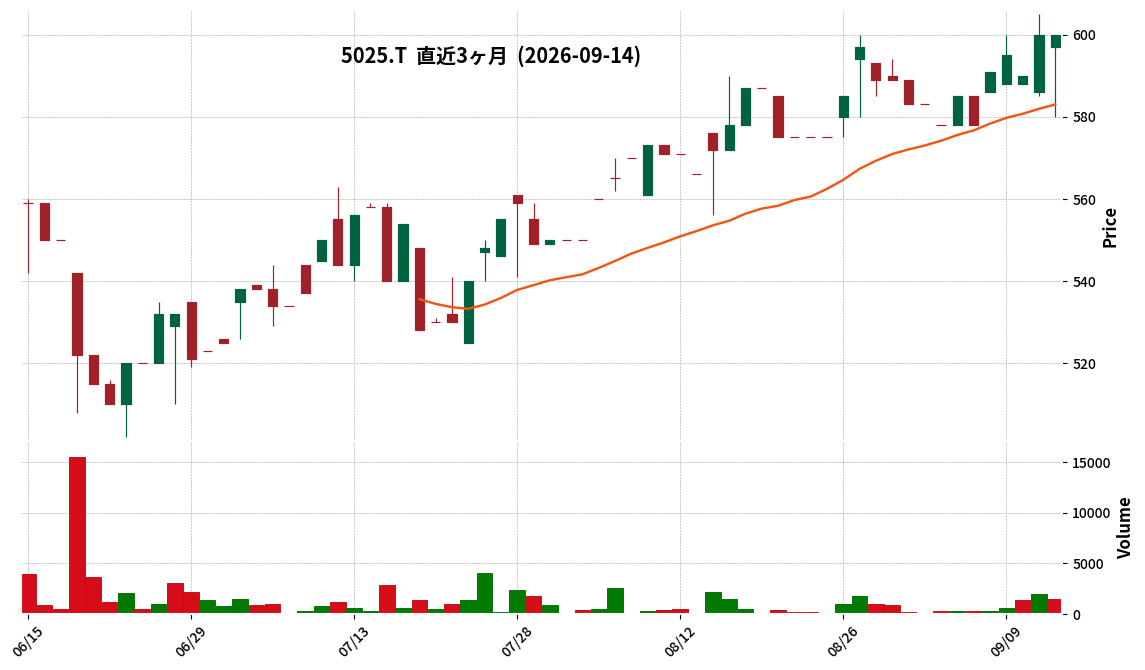
5025|G-マーキュリー
600.0
▲ +0.00%
📎 Source:G-マーキュリー Official IR →
This article is an AI-generated summary and analysis of official IR disclosures.
📄 Announcement (AI-Reviewed)
- G-Mercury announced the disclosure of its parent company, GA technologies Co., Ltd.’s Q3 FY2026 financial results and explanatory materials.
- G-Mercury’s own performance figures were released as estimates (approximate) and were not finalized as of July 31, 2026, the end of the parent company’s Q3.
- GA technologies holds a 53.36% voting rights ownership in G-Mercury as of February 28, 2026.
- The reason for the estimated figures is the difference in fiscal year-ends between G-Mercury (February) and its parent company (October), preventing the finalization of G-Mercury’s results at the time of the parent company’s Q3 announcement.
- G-Mercury’s full-year financial results are scheduled to be disclosed in mid-April 2027 and will be announced promptly once finalized.
🤖 AI Perspective
The disclosure of G-Mercury’s performance as an estimate in conjunction with its parent company’s earnings release is a standard practice for consolidated subsidiaries. The discrepancy in fiscal year-ends necessitates an approximate disclosure, suggesting investors may need to monitor the forthcoming official full-year results for G-Mercury. This approach provides preliminary insight while awaiting finalized figures, which is common in situations of differing reporting periods.
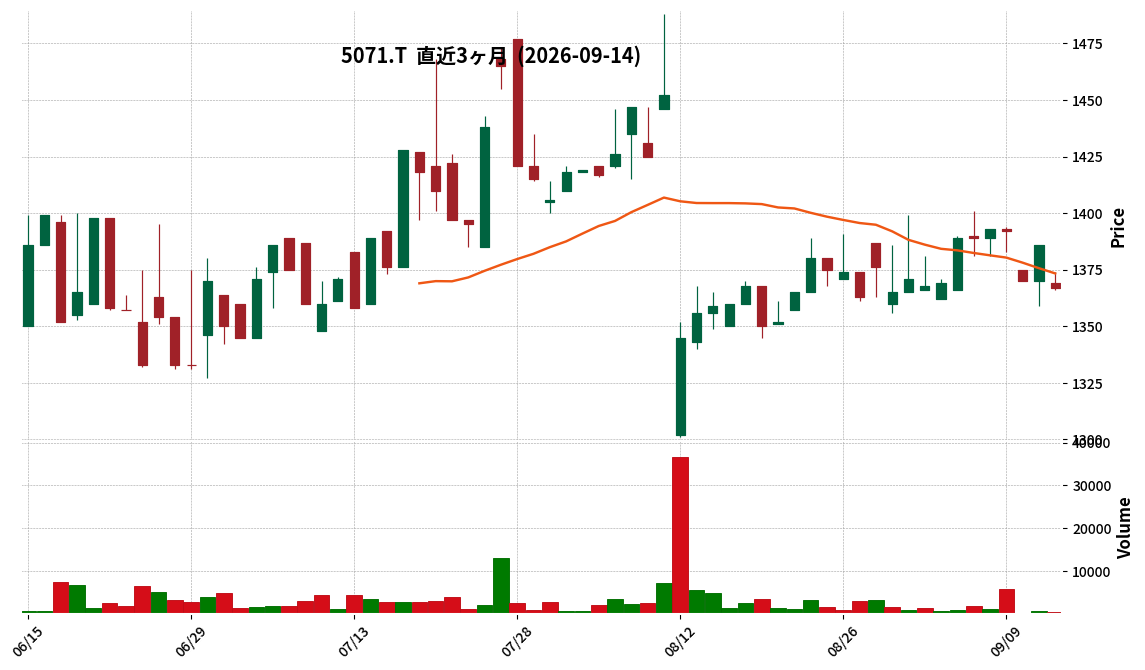
5071|ヴィス
1367.0
▼ -1.37%
This article is an AI-generated summary and analysis of official IR disclosures.
📄 Announcement (AI-Reviewed)
- VIS Co., Ltd. resolved to establish a new shareholder benefit program as of September 14, 2026.
- Eligibility for the program starts from shareholders recorded in the company’s shareholder registry with 200 (2 units) or more shares as of September 30th each year. The initial eligibility will be based on shareholders as of September 30, 2026.
- The shareholder benefit will be provided through “Digital Yutai Club,” offering shareholder benefit points (1 point ≈ 1 yen equivalent) based on the number of shares held.
- Points will be awarded around November each year, ranging from 1,000 points for 200-299 shares to 35,000 points for 1,500 or more shares.
- The awarded points can be exchanged for e-money, various products, or services. They can also be converted into “WILLsCoin,” a common shareholder benefit coin that can be combined with points from other companies’ programs.
🤖 AI Perspective
The establishment of this new shareholder benefit program by VIS appears to aim at strengthening shareholder returns, increasing market recognition of the company’s shares, and enhancing stock liquidity. Furthermore, by utilizing the “Digital Yutai Club,” the company intends to actively leverage its shareholder database for IR information dissemination and surveys, thereby strengthening dialogue with shareholders. This approach could appeal to individual investors and suggests a focus on building stronger shareholder relationships.
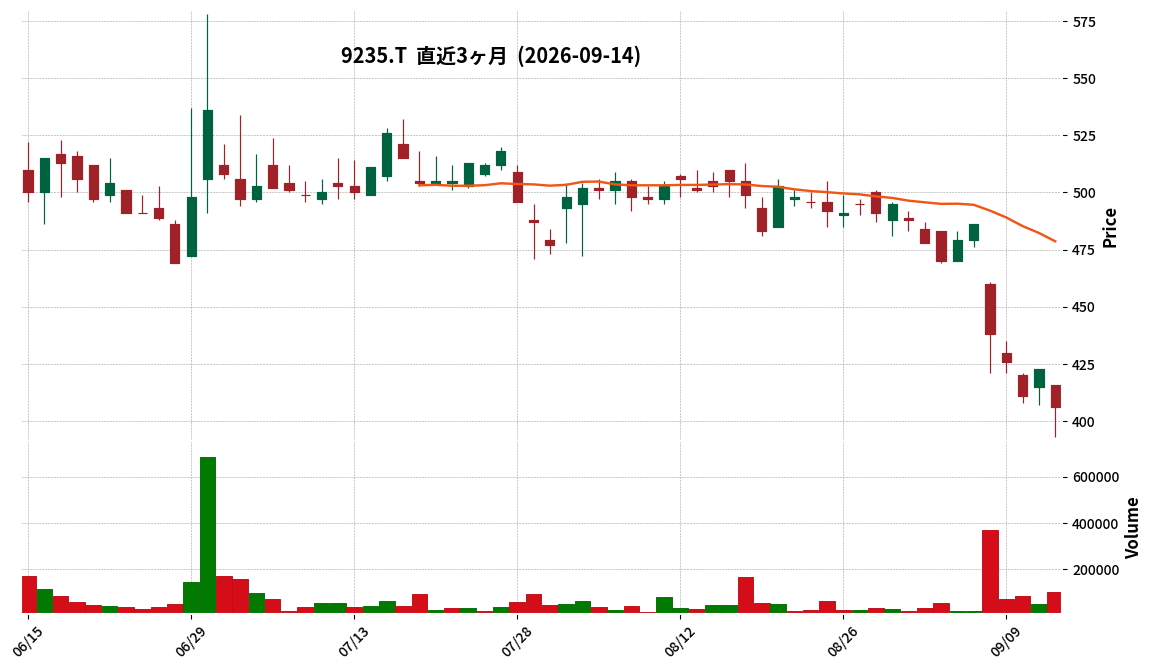
9235|G-売れるネットG
406.0
▼ -4.02%
📎 Source:G-売れるネットG Official IR →
This article is an AI-generated summary and analysis of official IR disclosures.
📄 Announcement (AI-Reviewed)
- Ureru Net Advertising Group reported consolidated net sales of 1,661 million yen for the fiscal year ended July 2026, marking a 6.0% increase from the previous period.
- The company recorded an operating loss of 543 million yen for FY2026, compared to an operating loss of 166 million yen in FY2025.
- Net loss for the period was 1,107 million yen for FY2026, an increase from 444 million yen loss in FY2025, which included approximately 290 million yen in one-off expenses and 536 million yen in special losses.
- For the fiscal year ending July 2027, the company projects a significant turnaround, forecasting consolidated net sales of 5,004 million yen (a 201.3% increase from FY2026), an operating profit of 202 million yen, and a net profit of 130 million yen.
- The FY2027 forecast is primarily driven by the full-year contribution from M&A and newly established subsidiaries (projected sales of 3,280 million yen and operating profit of 303 million yen), alongside improved profitability of existing businesses.
🤖 AI Perspective
The FY2026 results indicate that despite revenue growth, significant one-off costs and special losses, including M&A-related expenses, led to a substantial operating and net loss. However, the company’s FY2027 forecast suggests a strategic pivot towards profitability, largely driven by the full integration and contribution of acquired businesses and new subsidiaries, alongside anticipated improvements in existing operations. Investors may want to monitor the execution of their M&A strategy and the realization of synergies, as these factors appear crucial for achieving the projected turnaround and sustained growth.
Disclaimer: This article is for informational purposes only and does not constitute investment advice.
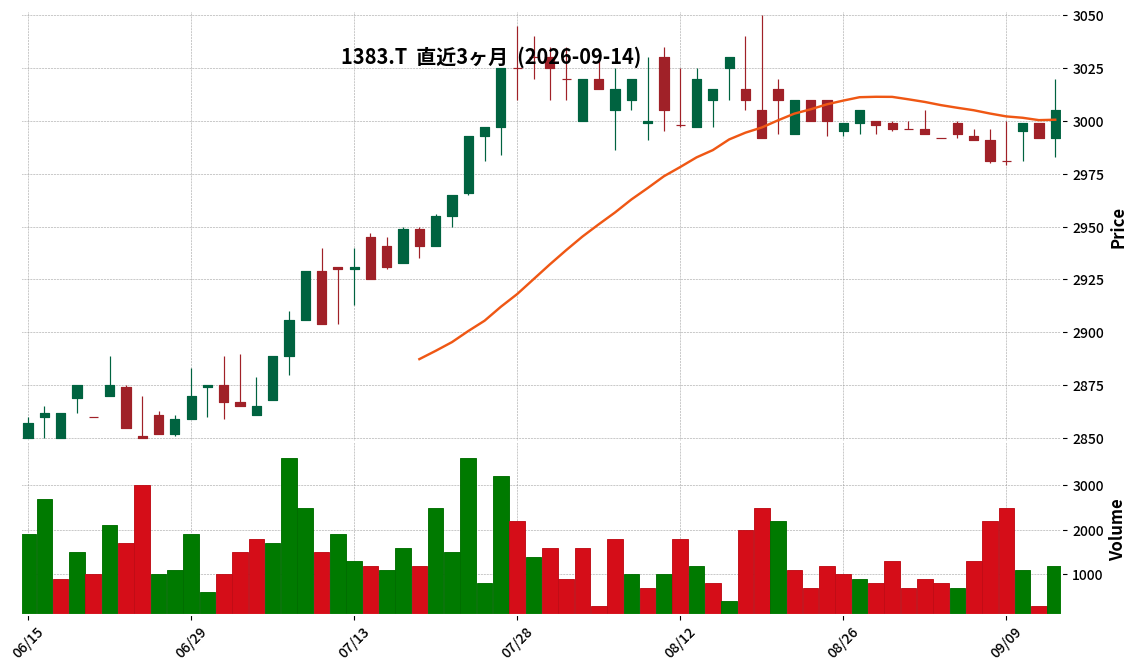
1383|ベルグアース
3005.0
▲ +0.43%
This article is an AI-generated summary and analysis of official IR disclosures.
📄 Announcement (AI-Reviewed)
- BERGEARTH Co., Ltd. announced its consolidated financial results for the third quarter of the fiscal year ending October 2026 (November 1, 2025 to July 31, 2026).
- Consolidated net sales reached ¥5,271 million, representing a 9.9% increase compared to the same period of the previous fiscal year.
- Consolidated operating profit was ¥39 million, a turnaround from an operating loss of ¥220 million in the prior year’s third quarter.
- Consolidated ordinary profit was ¥49 million, also a turnaround from an ordinary loss of ¥212 million in the prior year’s third quarter.
- Net profit attributable to parent shareholders was ¥37 million, a shift from a net loss of ¥70 million in the prior year’s third quarter.
- The Vegetable Seedlings and Seedling-Related Business segment reported sales of ¥4,583 million (up 10.5% YoY) and segment profit of ¥376 million (up 161.8% YoY).
- The consolidated full-year forecast for FY2026 remains unchanged, projecting net sales of ¥8,000 million (up 9.5%), operating profit of ¥110 million, ordinary profit of ¥105 million, and net profit attributable to parent shareholders of ¥54 million (up 12.9%), with EPS of ¥34.09.
🤖 AI Perspective
BERGEARTH’s third-quarter results show solid sales growth and a return to profitability, which may suggest the effectiveness of strategic initiatives. The integration of PSP Corporation into the consolidated scope and the full-year operation of Berg Fukushima Co., Ltd.’s Tsurusawa Farm likely contributed to increased production capacity and improved in-house production rates. These factors, alongside appropriate price adjustments, appear to have significantly driven the substantial profit improvement in the core Vegetable Seedlings and Seedling-Related Business.
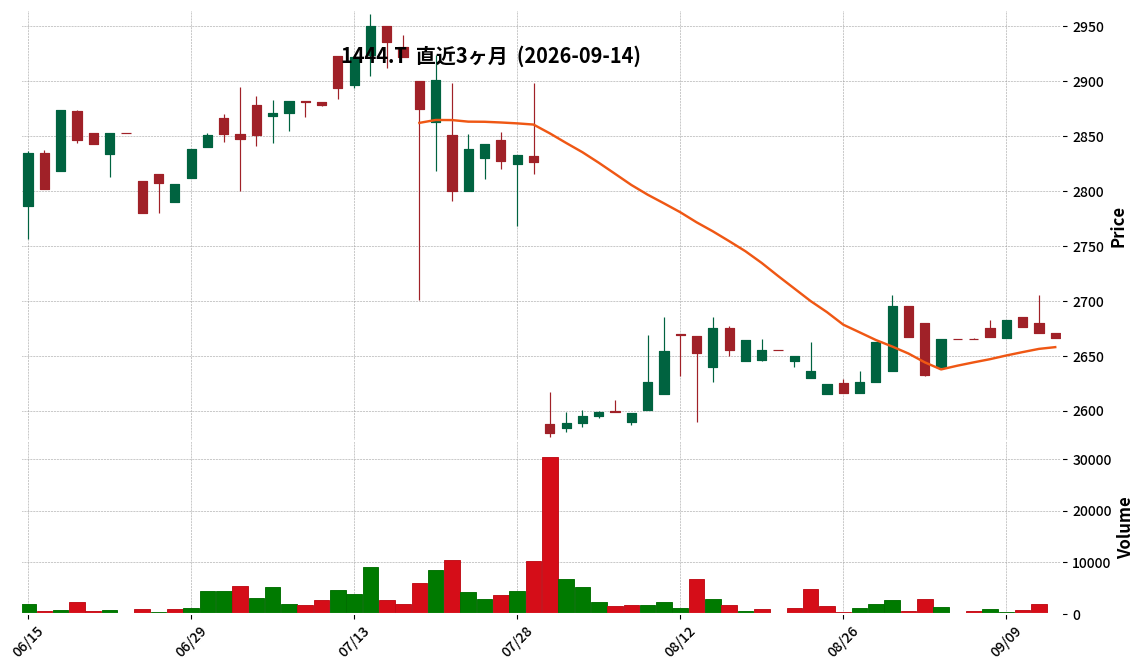
1444|G-ニッソウ
2666.0
▼ -0.19%
This article is an AI-generated summary and analysis of official IR disclosures.
📄 Announcement (AI-Reviewed)
- G-Nisso’s consolidated financial results for the fiscal year ended July 2026 reported net sales of 5,376,559 thousand yen, an increase of 1.8% year-on-year.
- The company posted an operating loss of 42,135 thousand yen (compared to an operating income of 72,700 thousand yen in the prior year).
- An ordinary loss of 51,822 thousand yen was reported (compared to an ordinary income of 69,571 thousand yen in the prior year).
- Net loss attributable to owners of parent was 139,198 thousand yen (compared to a net income attributable to owners of parent of 202,686 thousand yen in the prior year).
- Basic earnings per share amounted to △127.98 yen.
- During the consolidated fiscal year, the company acquired Daiichi Giken Co., Ltd. as a subsidiary and recorded an impairment loss of 39,577 thousand yen as extraordinary losses for two subsidiaries.
🤖 AI Perspective
While net sales showed a slight increase, the shift to losses in operating income, ordinary income, and net income attributable to owners of parent represents a significant change for investors to monitor. The acquisition of a new subsidiary and the recognition of impairment losses could be key factors in understanding the impact on the company’s profitability structure.
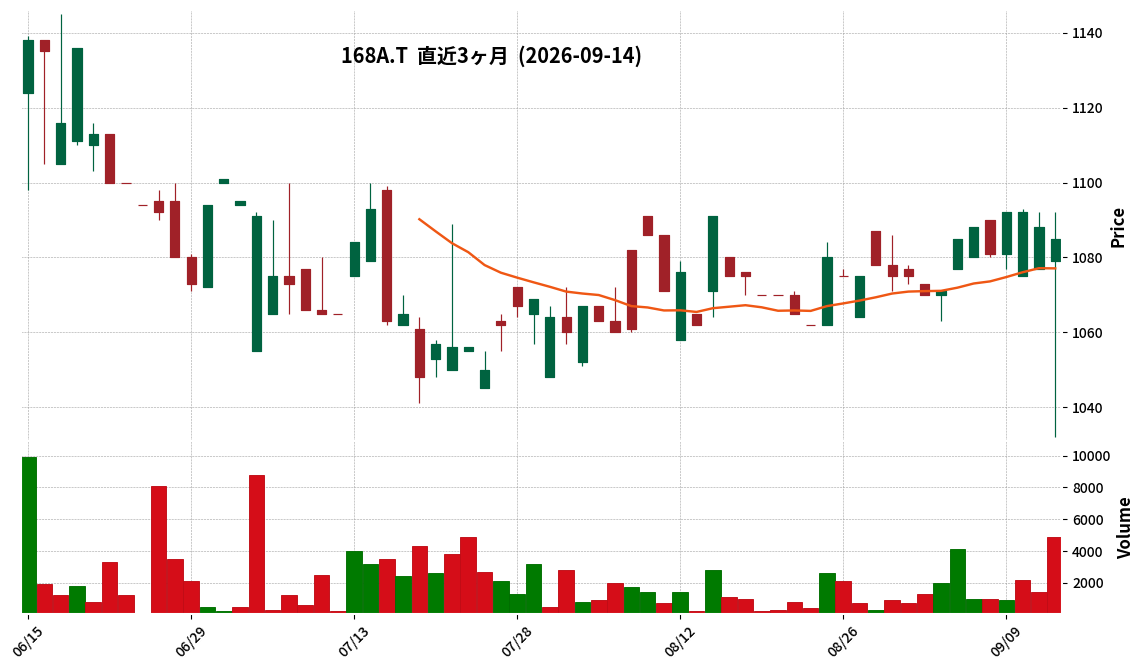
168A|G-イタミアート
1085.0
▼ -0.28%
📎 Source:G-イタミアート Official IR →
This article is an AI-generated summary and analysis of official IR disclosures.
📄 Announcement (AI-Reviewed)
- G-ITAMI ARTS announced its consolidated financial results for the second quarter (interim) of the fiscal year ending January 2027.
- Net sales for the interim period amounted to ¥2,913 million, representing a 39.4% increase compared to the prior interim period.
- Operating profit was ¥71 million, a decrease of 33.3% year-on-year.
- Ordinary profit was ¥67 million, a decrease of 38.8% year-on-year.
- Profit attributable to owners of parent for the interim period was ¥32 million, a significant decrease of 73.0% year-on-year.
- Basic earnings per share for the interim period stood at ¥22.28.
- The full-year consolidated earnings forecast remains unchanged from the most recently announced figures: Net sales of ¥6,000 million, Operating profit of ¥246 million, Ordinary profit of ¥246 million, and Profit attributable to owners of parent of ¥167 million.
🤖 AI Perspective
While the company achieved substantial revenue growth, all profit figures declined, primarily attributed to increased production costs such as depreciation expenses from new printing equipment and rising personnel costs. This indicates that while sales strategies, including aggressive promotions and contributions from the consolidated subsidiary Tokyo Neoprint, have driven top-line growth, managing cost structures will be crucial for improving profitability moving forward. Investors may focus on the company’s ability to balance expansion with cost efficiency in the upcoming periods.
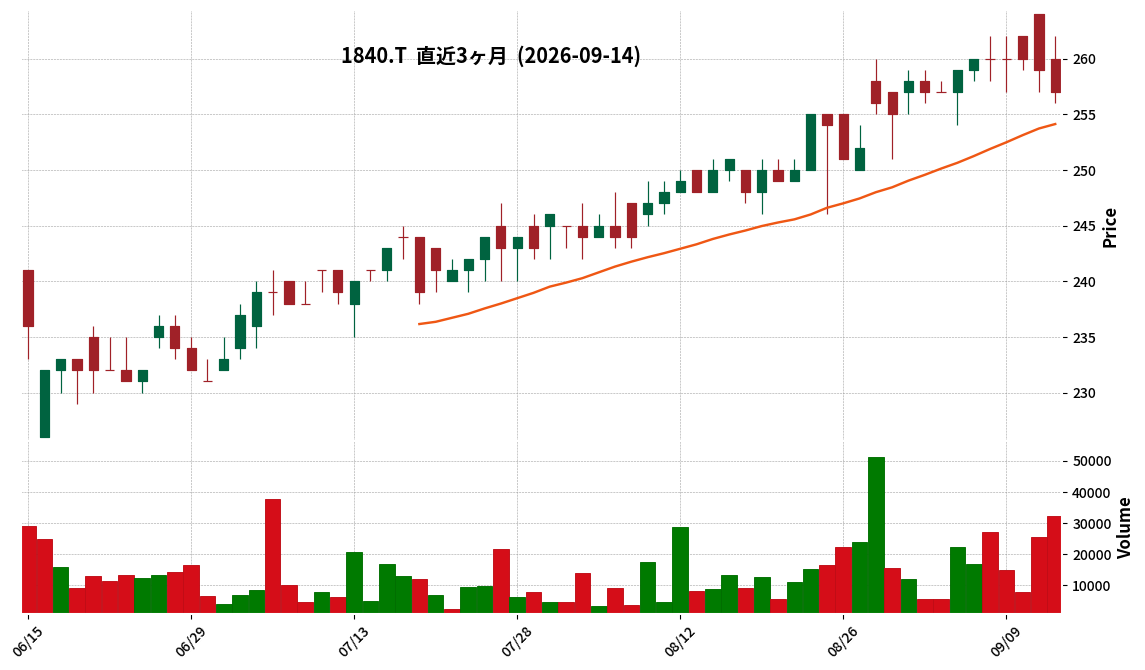
1840|土屋HD
257.0
▼ -0.77%
This article is an AI-generated summary and analysis of official IR disclosures.
📄 Announcement (AI-Reviewed)
- Tsuchiya Holdings announced its consolidated financial results for the third quarter of the fiscal year ending October 2026.
- For the nine months ended July 31, 2026, consolidated net sales were ¥19,576 million, a 6.2% increase year-over-year.
- The company reported an operating loss of ¥1,707 million, an ordinary loss of ¥1,654 million, and a net loss attributable to owners of the parent of ¥1,163 million.
- By segment, the Housing business recorded sales of ¥13,012 million (up 14.2%) with an operating loss of ¥994 million; the Remodeling business sales were ¥1,835 million (down 23.5%) with an operating loss of ¥395 million; the Real Estate business sales were ¥4,811 million (up 3.8%) with an operating loss of ¥186 million; and the Rental business sales were ¥352 million (down 5.4%) with an operating profit of ¥47 million.
- The consolidated full-year forecast for the fiscal year ending October 2026 has been revised, with expected net sales of ¥33,500 million, operating profit of ¥0 million, ordinary profit of ¥0 million, and net profit attributable to owners of the parent of ¥0 million (EPS of ¥0.00).
🤖 AI Perspective
Tsuchiya Holdings’ Q3 FY2026 results show an increase in net sales, yet operating and net losses widened compared to the previous year. This suggests that despite revenue growth, profitability remains a challenge, particularly as key segments like Housing, Remodeling, and Real Estate all posted operating losses. The revision of the full-year forecast to zero profit across operating, ordinary, and net income categories may be a significant point of concern for investors.
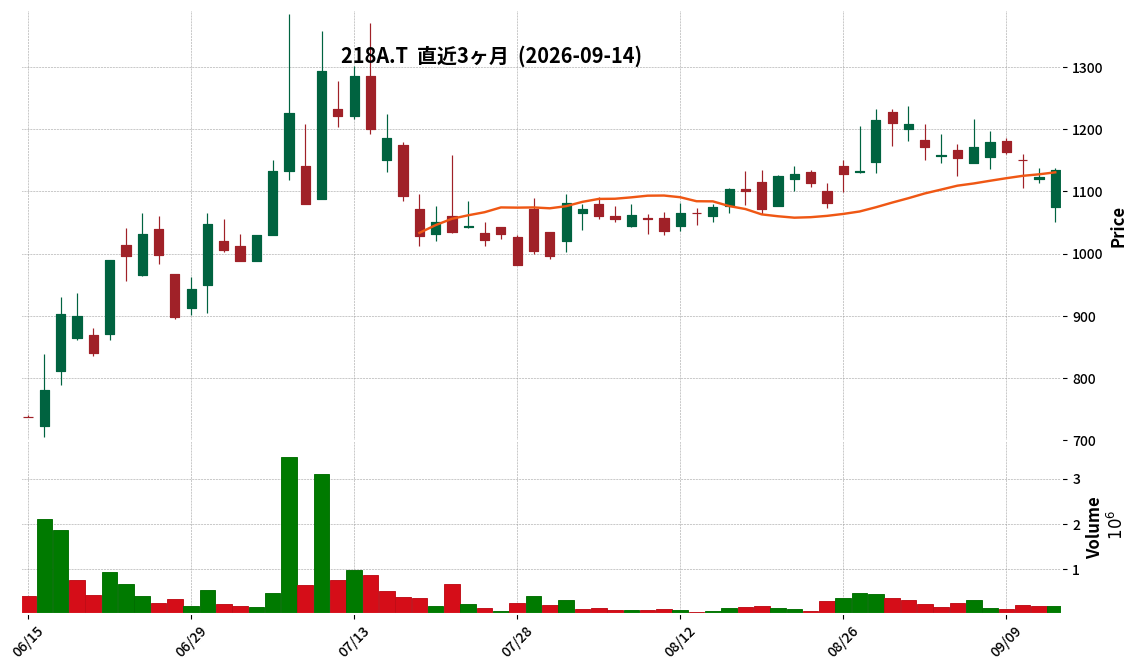
218A|G-リベラウェア
1135.0
▲ +1.07%
📎 Source:G-リベラウェア Official IR →
This article is an AI-generated summary and analysis of official IR disclosures.
📄 Announcement (AI-Reviewed)
- For the full fiscal year ended July 2026, net sales reached ¥1,595 million, marking a 13% increase year-over-year.
- Gross profit for the same period was ¥676 million (gross margin 42%), a 1% increase year-over-year.
- The company reported an ordinary loss of ¥807 million (adjusted ordinary loss of ¥603 million) for the fiscal year.
- The company stated it accelerated upfront investments for future growth, prioritizing R&D, human resources, and business infrastructure.
- For the fiscal year ending July 2027, the company forecasts net sales of ¥2,300 million (+44% YoY), gross profit of ¥1,150 million (gross margin 50%), and an ordinary loss of ¥1,106 million (adjusted ordinary loss of ¥698 million).
- Key topics included the launch of the domestic unmanned aircraft platform business, the release of the new “IBIS2 C” drone, the promulgation of the Sewerage Act amendment, and progress in overseas expansion.
🤖 AI Perspective
Liberaware’s FY2026 results highlight a strategic emphasis on substantial upfront investments for long-term growth, even as net sales continued to increase. The significant ordinary loss appears to be primarily driven by aggressive spending in R&D and human resources, which could be interpreted as building future capabilities. The projected strong revenue growth for FY2027, alongside continued investment, may suggest a critical phase where previous investments are expected to transition into tangible business and revenue generation.
Disclaimer: This article is for informational purposes only and does not constitute investment advice.
2301|学情
1681.0
▲ +3.00%
This article is an AI-generated summary and analysis of official IR disclosures.
📄 Announcement (AI-Reviewed)
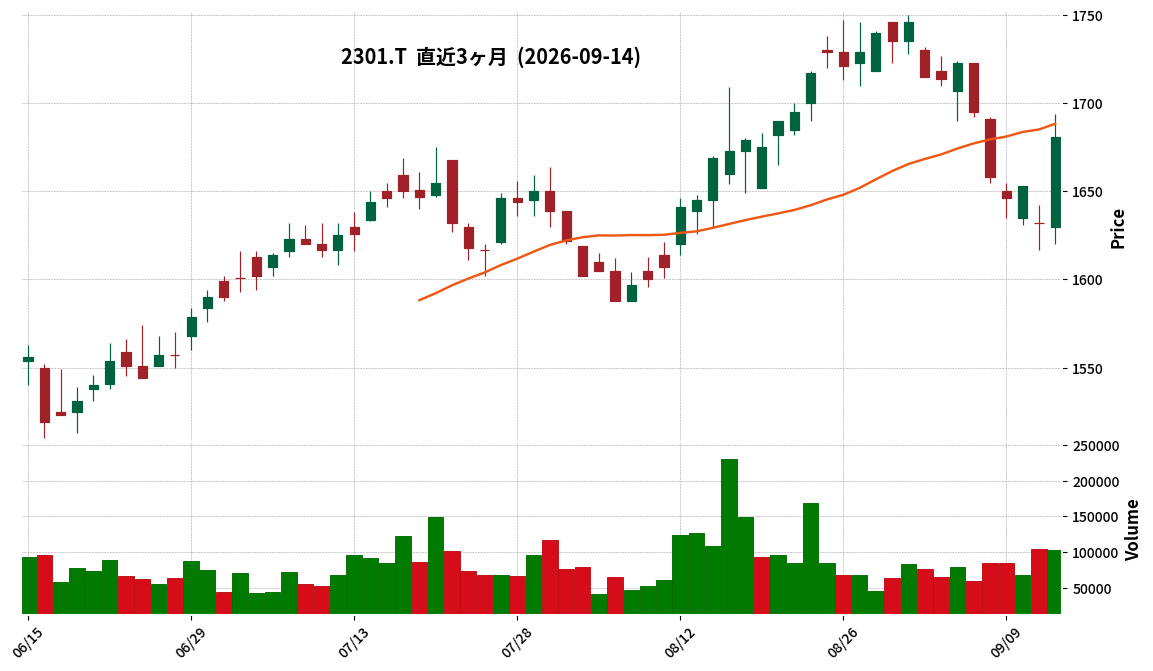
- Gakujo reported net sales of ¥7,681 million for the first nine months of the fiscal year ending October 2026 (November 1, 2025, to July 31, 2026), marking an 8.8% increase compared to the previous year.
- During the same period, operating income reached ¥964 million (+13.7% YoY), ordinary income was ¥1,135 million (+4.3% YoY), and net income for the quarter was ¥784 million (+2.0% YoY).
- Within the main recruitment information business, “Re-Shukatsu” sales were ¥1.8 billion (+0.6% YoY), “Agent Business” sales were ¥759 million (+32.3% YoY), “Events” sales were ¥2.646 billion (+16.6% YoY), and “Re-Shukatsu Campus” sales were ¥1.325 billion (+8.7% YoY).
- The full-year forecast for October 2026 remains unchanged from the most recently announced figures: net sales ¥12.0 billion, operating income ¥2.6 billion, ordinary income ¥2.8 billion, and net income ¥2.0 billion.
- The equity ratio stood at 90.1% as of the end of the third quarter of October 2026.
🤖 AI Perspective
The reported increase in net sales and profit figures for the cumulative third quarter suggests a stable performance in Gakujo’s business operations. The significant growth in the Agent Business and Event segments appears to be a key driver of overall revenue expansion. However, the unchanged full-year forecast and observed impacts from changes in the market environment for some segments may warrant continued monitoring by investors.
2315|CAICA D
63.0
▼ -4.55%
📎 Source:CAICA D Official IR →
This article is an AI-generated summary and analysis of official IR disclosures.
📄 Announcement (AI-Reviewed)
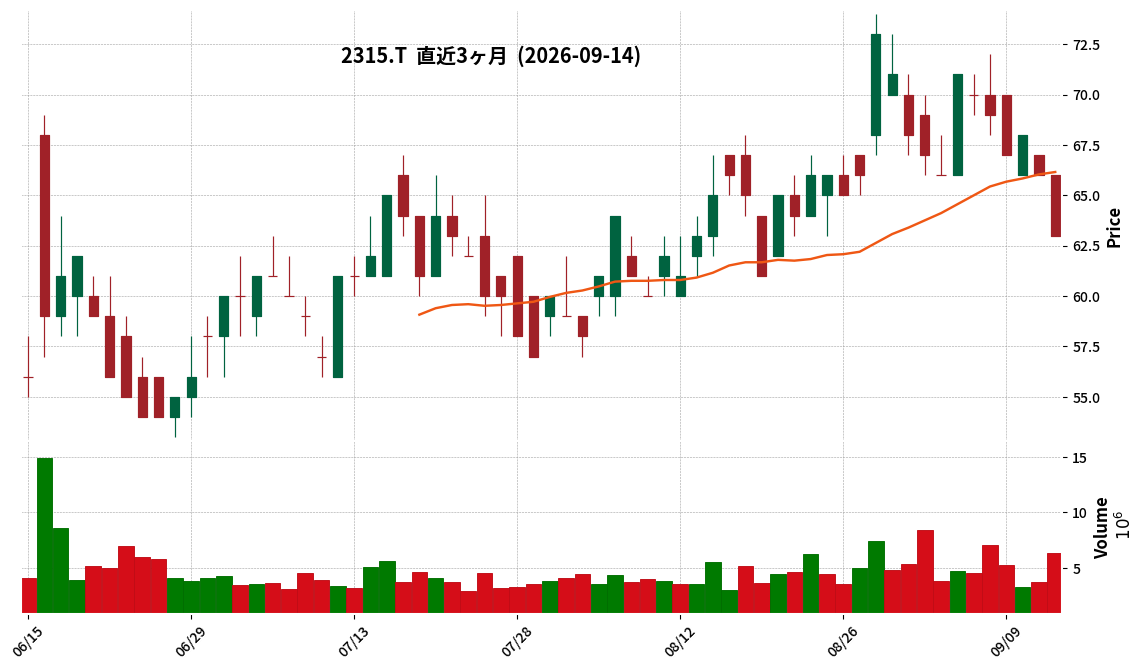
- For the third quarter of the fiscal year ending October 2026 (November 1, 2025 – July 31, 2026), consolidated net sales were ¥4,693 million, representing a 22.2% increase compared to the same period in the previous year.
- Operating income for the same period was ¥111 million, a 68.9% increase year-on-year, and adjusted EBITDA was ¥199 million, an increase of 186.7% year-on-year.
- The company reported an ordinary loss of ¥12 million (compared to an ordinary income of ¥74 million in the prior year’s period) and a net loss attributable to owners of the parent of ¥126 million (compared to a net income of ¥588 million in the prior year’s period).
- Total assets reached ¥6,224 million, net assets ¥5,562 million, and the equity ratio was 88.3%. The significant increase in total assets and net assets is attributed to the consolidation of Zenko General Research Institute Co., Ltd.
- The full-year consolidated earnings forecast (Net sales ¥6,166 million, Operating income ¥107 million, Ordinary income ¥107 million, Net income attributable to owners of the parent ¥91 million) remains unchanged from the most recently announced forecast.
🤖 AI Perspective
CAICA D’s Q3 results show a significant year-on-year increase in both net sales and operating income, with a particularly strong rise in adjusted EBITDA. This performance may suggest that recent business restructuring, including the acquisition of Zenko General Research Institute Co., Ltd. and the strengthening of DX solution services, is beginning to yield results. However, the shift to an ordinary loss and net loss warrants attention when evaluating the company’s future profitability and cost structure.
Disclaimer: This article is for informational purposes only and does not constitute investment advice.
2480|シスロケ
1779.0
▼ -1.06%
This article is an AI-generated summary and analysis of official IR disclosures.
📄 Announcement (AI-Reviewed)
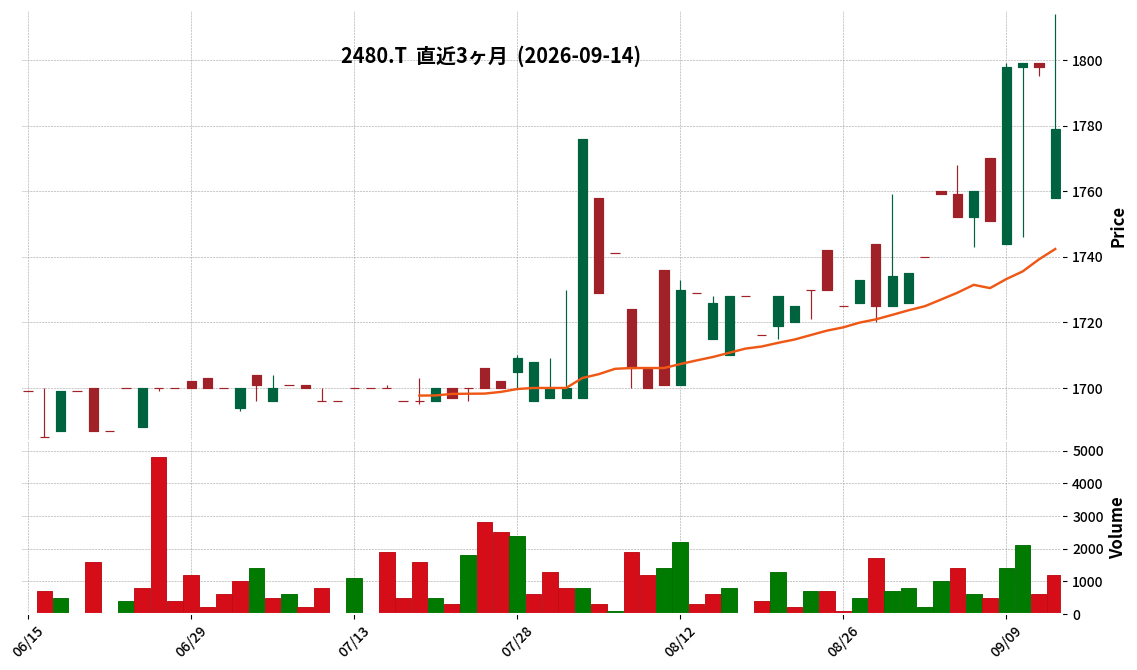
- Systec Location Co., Ltd. resolved to enhance its shareholder benefit program at a Board of Directors meeting held on September 14, 2026.
- The enhancement aims to express gratitude to shareholders, increase investment attractiveness, improve stock liquidity, encourage long-term stock ownership, and deepen understanding of the company’s business.
- The QUO card benefits for shareholders recorded as of March 31st each year will be increased. For 100 to 299 shares, it will be JPY 1,000 (previously JPY 500); for 300 to 499 shares, JPY 5,000 (previously JPY 4,000); and for 500 shares or more, JPY 5,000 (previously JPY 4,000).
- The QUO card benefits for shareholders recorded as of September 30th each year remain unchanged.
- A new benefit will be established: free access to the company’s proprietary website, which allows viewing of current and future car valuations related to its core products. The service is scheduled to launch from January 2027 onwards, starting with the “current value” viewing function.
- Eligible shareholders are those holding one unit (100 shares) or more recorded in the shareholder registry as of March 31st and September 30th each year. There is no specified holding period for the shares.
🤖 AI Perspective
The announced enhancement to the shareholder benefit program, particularly the increased QUO card value for the March end record date and the introduction of free access to a proprietary car valuation website, marks a strategic move. This initiative may suggest the company’s dual focus on increasing shareholder returns and promoting deeper engagement with its core business. The new website benefit could serve as a unique way for shareholders to understand the company’s expertise and potentially foster long-term investment by aligning shareholder interests with the company’s strategic vision.
2971|R-エスコンジャパン
107400.0
▲ +1.32%
📎 Source:R-エスコンジャパン Official IR →
This article is an AI-generated summary and analysis of official IR disclosures.
📄 Announcement (AI-Reviewed)
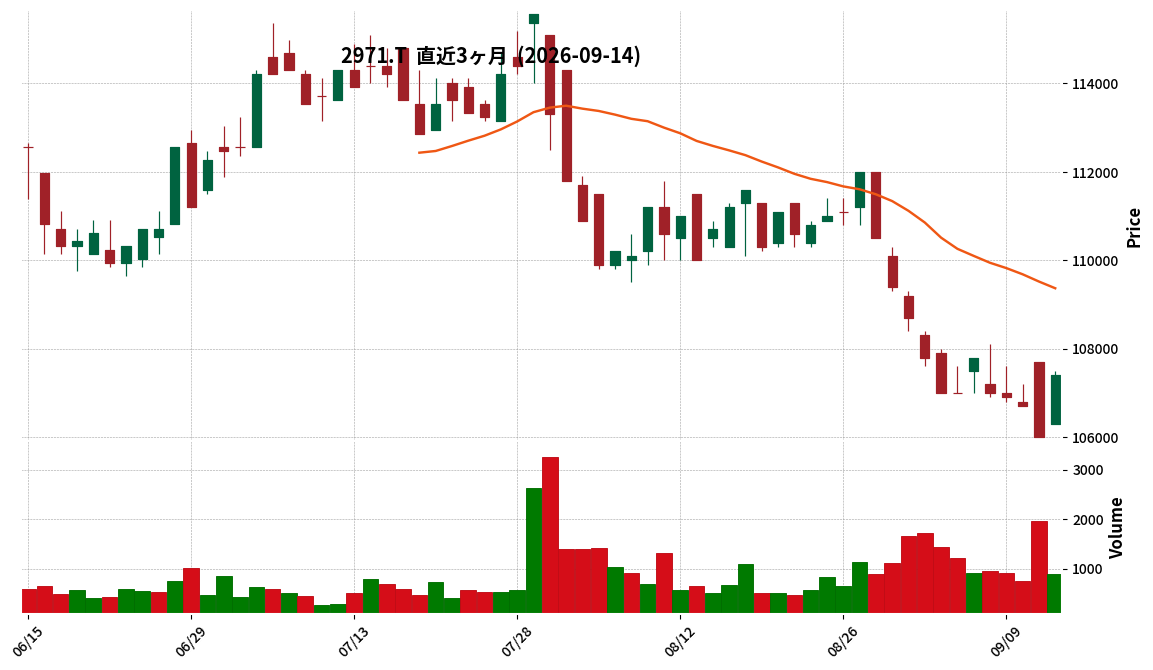
- For the fiscal period ended July 2026, operating revenue was ¥3,137 million, a 3.5% increase compared to the previous period.
- DPU (Distributions Per Unit) for the period was ¥3,585, with no excess distributions, and Net Income Per Unit was ¥3,585.
- The payout ratio remained at 100.0%, and the net asset distribution rate was 3.2%.
- During the period, the REIT acquired the hotel asset “SONO Moon Nagoya” and divested four commercial land properties.
- The forecast for the fiscal period ending January 2027 projects operating revenue of ¥3,191 million and DPU of ¥3,500.
🤖 AI Perspective
R-Escon Japan REIT achieved an increase in operating revenue and maintained its DPU for the July 2026 fiscal period. The portfolio strategy, which included the acquisition of a hotel asset expected to boost earnings through variable rents and the sale of mature commercial land properties, may suggest an ongoing effort to strengthen its stable revenue base and enhance inflation resilience. The projected DPU for the upcoming periods also indicates a continuation of current levels, which could be a key point of interest for investors seeking stability.
2984|ヤマイチ
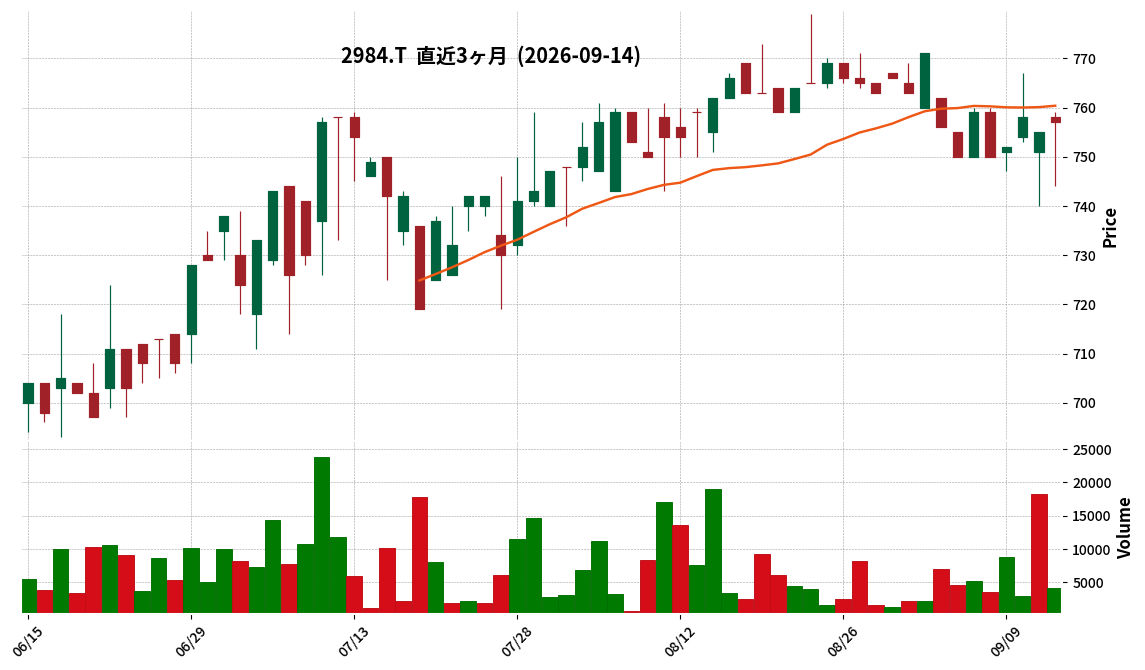
757.0
▲ +0.26%
This article is an AI-generated summary and analysis of official IR disclosures.
📄 Announcement (AI-Reviewed)
- Yamichi Estate Co., Ltd. resolved at a board meeting on September 14, 2026, to subscribe to a third-party allotment of shares by PT Affirmate Property Nusantara, an Indonesian local subsidiary, thereby making it a subsidiary.
- The number of shares acquired is 2,500, and the acquisition price (payment amount) is 2,500,000 thousand IDR (approximately 21,933 thousand yen).
- As a result of this transaction, Yamichi Estate will hold 83.3% of the voting rights in PT Affirmate Property Nusantara.
- The payment date is scheduled for the end of October 2026, and if the acquisition proceeds as planned, PT Affirmate Property Nusantara will become a subsidiary of Yamichi.
- PT Affirmate Property Nusantara operates in real estate-related businesses, established on November 28, 2019. It had suspended business activities since the expansion of the COVID-19 pandemic but plans to resume them triggered by this third-party allotment.
🤖 AI Perspective
Yamichi Estate’s acquisition of an Indonesian local subsidiary suggests a strategic move to enter the Indonesian real estate development market, which is characterized by anticipated population growth and economic expansion. This initiative appears aimed at establishing a business foundation and generating medium-to-long-term revenue opportunities in the region. The capital injection is expected to revitalize the local entity, which had paused its operations, making its future business activities worth monitoring.
2997|G-ストレージ王
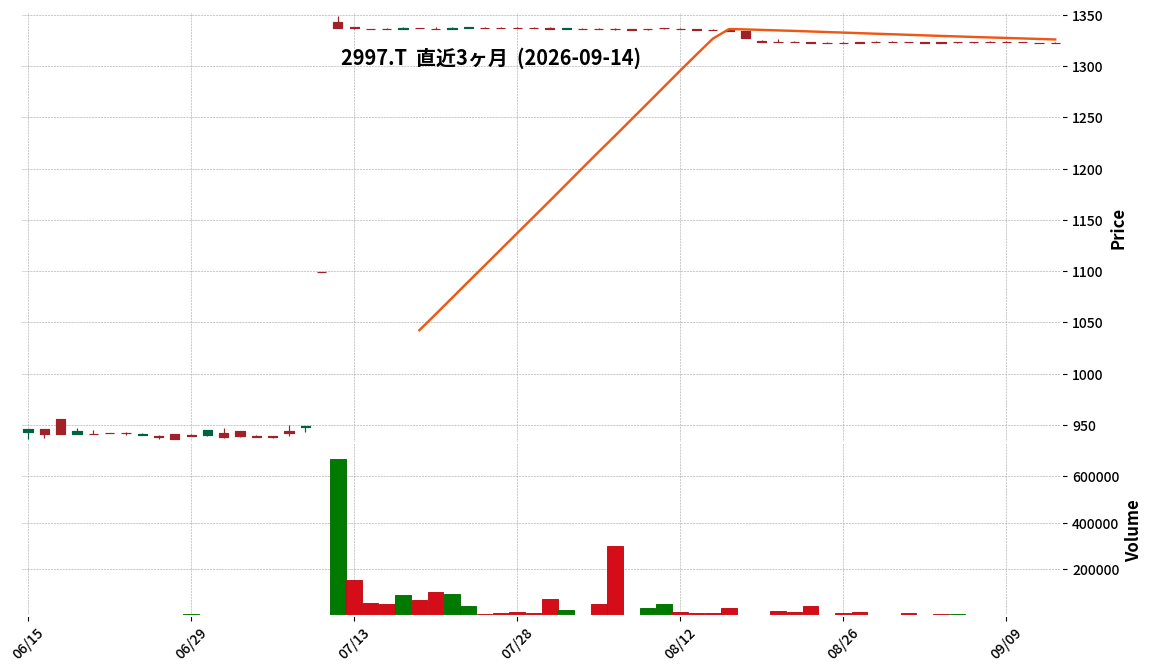
1323.0
▲ +0.00%
📎 Source:G-ストレージ王 Official IR →
This article is an AI-generated summary and analysis of official IR disclosures.
📄 Announcement (AI-Reviewed)
- G-Storage Oh announced its Q2 FY2027 (interim) unaudited financial results.
- For the interim period, revenue was JPY 907 million, representing a 29.4% decrease compared to the previous interim period.
- The company reported an operating loss of JPY 250 million (vs. JPY 105 million loss in the prior interim period), an ordinary loss of JPY 267 million (vs. JPY 110 million loss), and a net interim loss of JPY 185 million (vs. JPY 67 million loss).
- Revenue for the Trunk Room Operation and Management segment increased by 20.9% year-on-year to JPY 632 million, but the segment loss widened to JPY 76 million (from JPY 31 million loss in the prior period).
- The Trunk Room Development and Sales segment saw revenue decrease by 35.8% year-on-year to JPY 260 million, but segment profit increased by 52.5% to JPY 22 million.
🤖 AI Perspective
The interim financial results show a significant year-over-year decline in revenue and expanded losses across the board. However, the core Trunk Room Operation and Management business achieved revenue growth due to increased occupancy rates at existing stores, while the Development and Sales segment, despite a revenue decline, managed to increase its segment profit. These results suggest a need to monitor the company’s cost structure and the relative performance of its various business segments going forward.
3134|Hamee
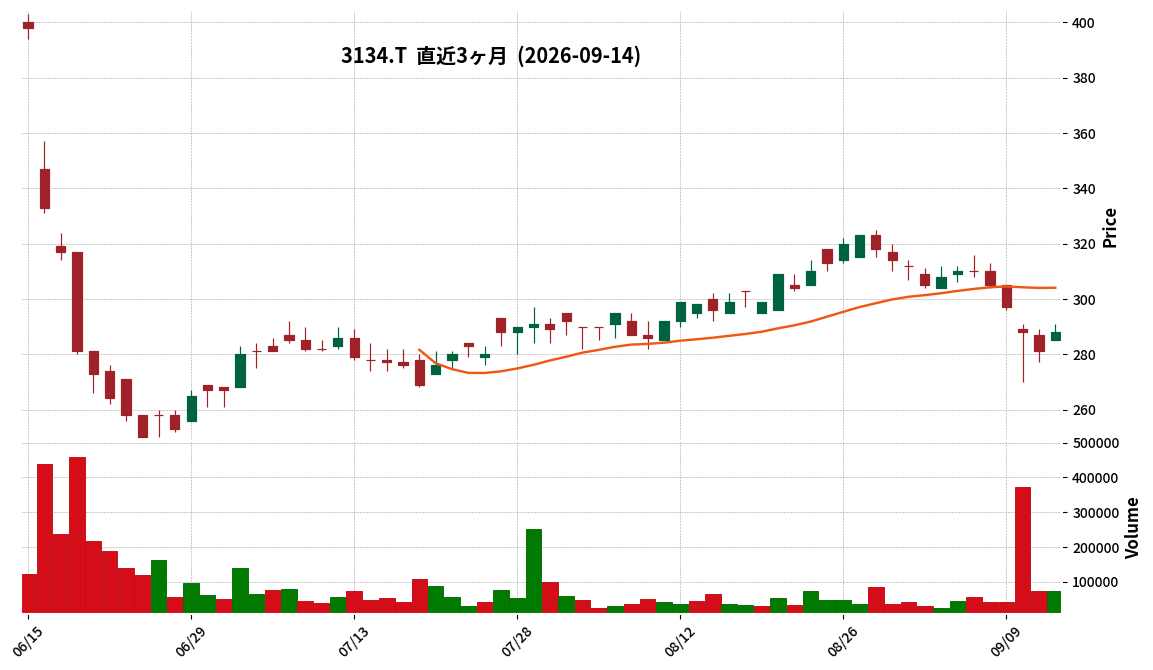
288.0
▲ +2.49%
This article is an AI-generated summary and analysis of official IR disclosures.
📄 Announcement (AI-Reviewed)
- Hamee Co., Ltd. announced its consolidated financial results for the first quarter of FY2027 (May 1, 2026, to July 31, 2026).
- Consolidated net sales amounted to ¥4,610 million, representing a 12.9% decrease compared to the same quarter of the previous year.
- The company reported a consolidated operating loss of ¥14 million and an ordinary loss of ¥12 million.
- Net income attributable to owners of the parent company increased by 133.0% year-on-year to ¥59 million.
- By business segment, Mobile Life business sales increased by 5.8% year-on-year, Beauty business sales surged by 51.0%, while Gaming Accessories business sales decreased by 15.2%.
- The consolidated results include a structural decrease due to the exclusion of NE Corporation from consolidation.
3234|R-森ヒルズ
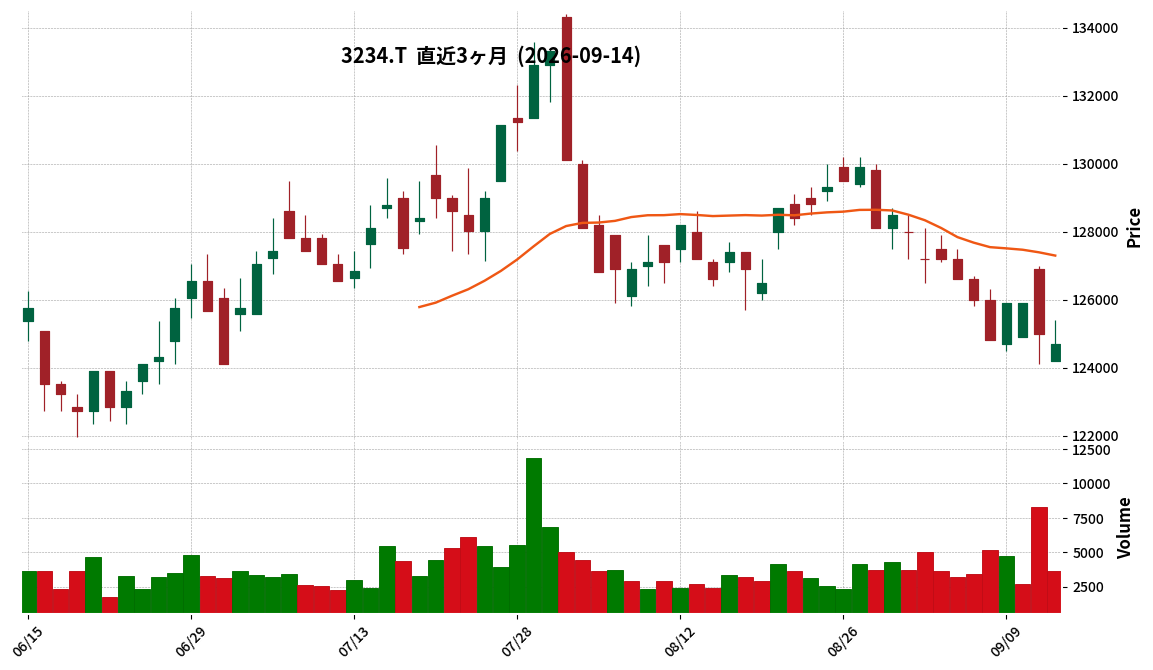
124700.0
▼ -0.24%
This article is an AI-generated summary and analysis of official IR disclosures.
📄 Announcement (AI-Reviewed)
- Mori Hills REIT announced its financial results for the 40th fiscal period ended July 2026 (February 1, 2026, to July 31, 2026).
- For the July 2026 period, operating revenue was ¥11.126 billion (down 2.2% from the previous period), operating income was ¥6.688 billion (down 2.8%), ordinary income was ¥5.808 billion (down 5.2%), and net income was ¥5.807 billion (down 5.2%).
- Distribution per unit (excluding excess distributions) was ¥3,100, maintaining the same level as the previous period (January 2026).
- The payout ratio was 100.3%, an increase from 95.4% in the January 2026 period.
- As of the end of July 2026, total assets were ¥411.198 billion, net assets were ¥201.866 billion, and the equity ratio was 49.1%.
- The forecast for the January 2027 period projects operating revenue of ¥11.158 billion and a distribution per unit of ¥3,100. The July 2027 period forecast projects operating revenue of ¥11.229 billion and a distribution per unit of ¥3,100.
🤖 AI Perspective
Mori Hills REIT’s July 2026 results show a decrease across operating revenue, operating income, ordinary income, and net income compared to the previous period. However, the distribution per unit was maintained at ¥3,100, with a payout ratio exceeding 100%, which may be a key point for investors. The REIT projects maintaining this distribution level in the upcoming periods, suggesting a focus on stable investor returns despite the reported profit declines. This aspect could be particularly relevant for income-focused investors monitoring the REIT’s performance.
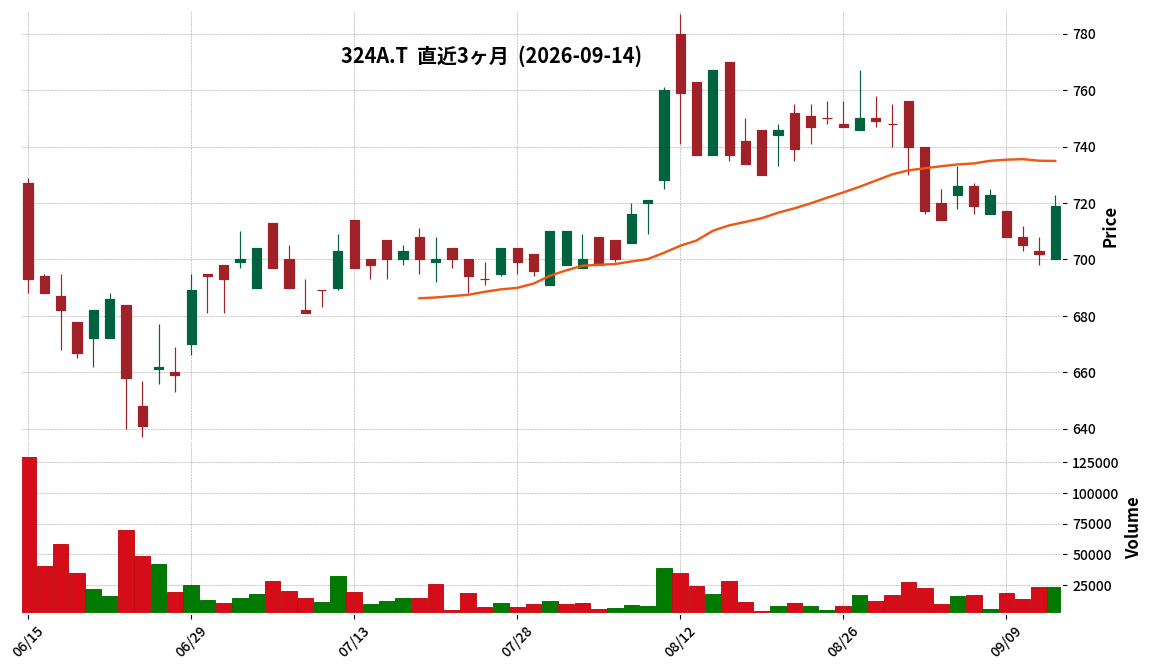
324A|G-ブッキングR
719.0
▲ +2.42%
📎 Source:G-ブッキングR Official IR →
This article is an AI-generated summary and analysis of official IR disclosures.
📄 Announcement (AI-Reviewed)
- G-Booking R’s revenue for the first quarter of fiscal year 2027 (May 1, 2026 – July 31, 2026) was ¥445 million, representing a 16.4% increase year-on-year.
- During the same period, operating profit was ¥80 million (down 26.4% YoY), ordinary profit was ¥80 million (down 27.2% YoY), and net income for the quarter was ¥59 million (down 26.0% YoY).
- Diluted earnings per share for the quarter were ¥10.89 (compared to ¥13.47 in Q1 FY2026).
- As of July 31, 2026, total assets were ¥2,344 million, net assets were ¥1,840 million, and the equity ratio was 78.5%.
- The full-year forecast for FY2027 (revenue ¥2,200 million, operating profit ¥508 million, ordinary profit ¥506 million, net income ¥375 million) remains unchanged from the most recently published forecast.
- Total shares issued (including treasury stock) were 5,914,800 shares, treasury stock at quarter-end was 500,000 shares, and average shares outstanding for the quarter was 5,414,800 shares.
🤖 AI Perspective
G-Booking R’s Q1 FY2027 results show a notable increase in revenue but a decline in profits compared to the previous year. This could suggest that while the company is expanding its operations, it might be incurring higher costs or making strategic investments that impact short-term profitability. The unchanged full-year forecast indicates that management expects to meet its initial targets, which is worth monitoring for future performance.
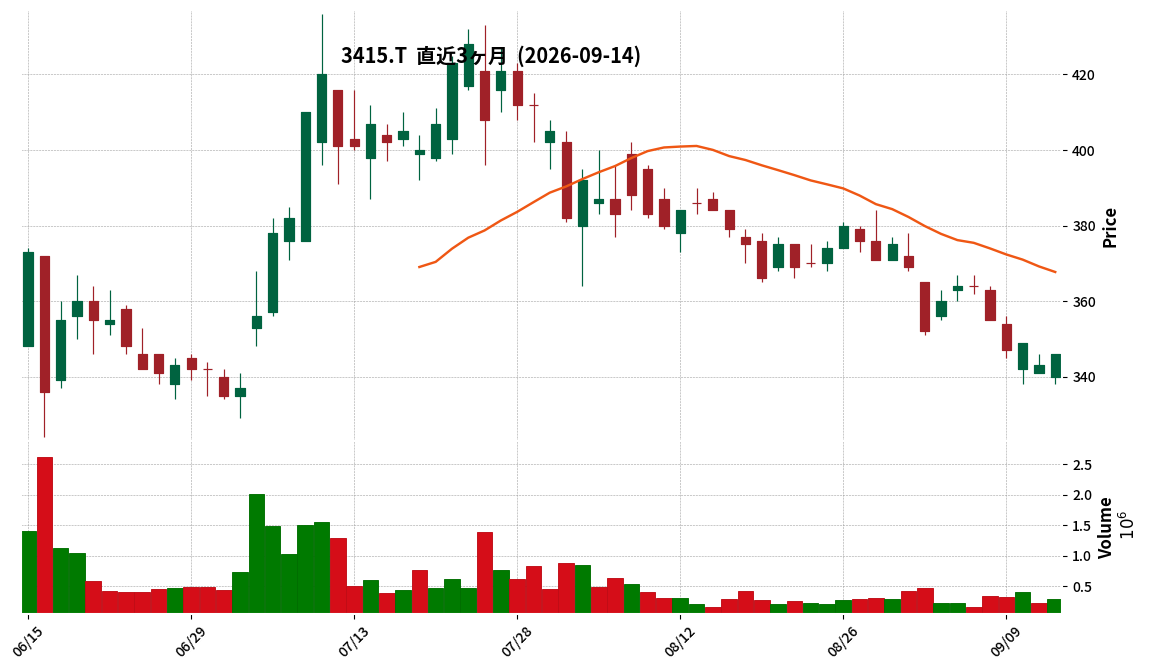
3415|トウキョウベース
346.0
▲ +0.87%
📎 Source:トウキョウベース Official IR →
This article is an AI-generated summary and analysis of official IR disclosures.
📄 Announcement (AI-Reviewed)
- TOKYO BASE Co., Ltd. announced its consolidated financial results for the second quarter of the fiscal year ending January 2027.
- Net sales for the interim period reached ¥12,466 million, marking a 21.1% increase compared to the previous year’s interim period.
- Operating profit was ¥857 million (up 7.8% YoY), ordinary profit was ¥920 million (up 34.8% YoY), and net income attributable to owners of the parent was ¥518 million (up 11.9% YoY).
- Same-store sales ratio against the prior year’s interim period was 105.7%. The new business format “KEY TIMEZ” contributed ¥371 million.
- Tax-free sales at domestic physical stores reached ¥3,396 million (up 42.4% YoY), increasing their share of total physical store sales to 36.4%.
🤖 AI Perspective
TOKYO BASE’s Q2 results show growth across sales and all profit lines, indicating robust operational performance. The significant increase in sales, particularly driven by the launch of the new “KEY TIMEZ” format and aggressive store expansions both domestically and internationally, suggests effective execution of their growth strategies. The strong surge in tax-free sales, accounting for a substantial portion of the increase in physical store sales, highlights the continued positive impact of inbound demand on the company’s financial performance.
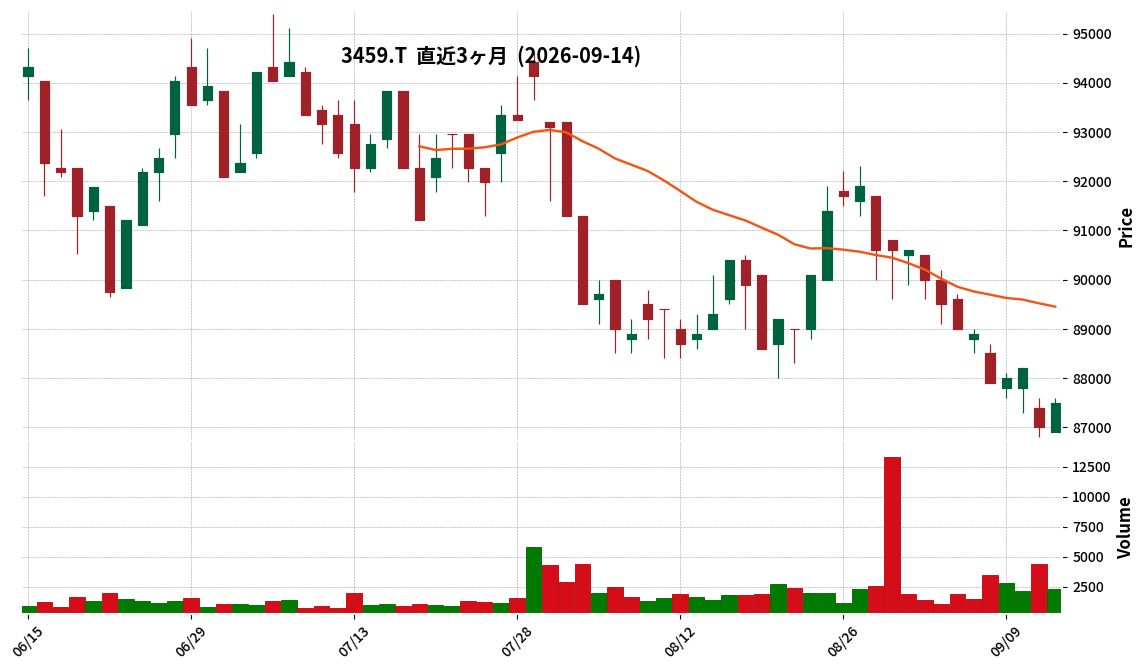
3459|R-サムティレジ
87500.0
▲ +0.57%
📎 Source:R-サムティレジ Official IR →
This article is an AI-generated summary and analysis of official IR disclosures.
📄 Announcement (AI-Reviewed)
- Samty Residential Investment Corporation (3459) has announced its financial results for the fiscal period ended July 2026.
- Operating revenue for the period was ¥5,972 million (down 16.0% from the previous period), operating income was ¥2,652 million (down 32.6%), ordinary income was ¥1,908 million (down 41.6%), and net income was ¥1,907 million (down 41.6%).
- Net income per unit was ¥2,237 (down from previous period), and distribution per unit (including excess distribution) was ¥2,637 (down from previous period).
- Total assets stood at ¥178,156 million, net assets at ¥84,535 million, and the equity ratio at 47.4%.
- For the fiscal period ending January 2027, the forecast projects operating revenue of ¥6,118 million and distribution per unit (including excess distribution) of ¥2,732.
🤖 AI Perspective
The FY2026 July financial results for R-Samty Residential show a decline in key revenue indicators compared to the previous period. This could be influenced by broader real estate market trends or specific conditions within its operating portfolio. However, the occupancy rate remains high at 96.6%, suggesting the portfolio’s stability could be a point of interest for investors to monitor going forward.
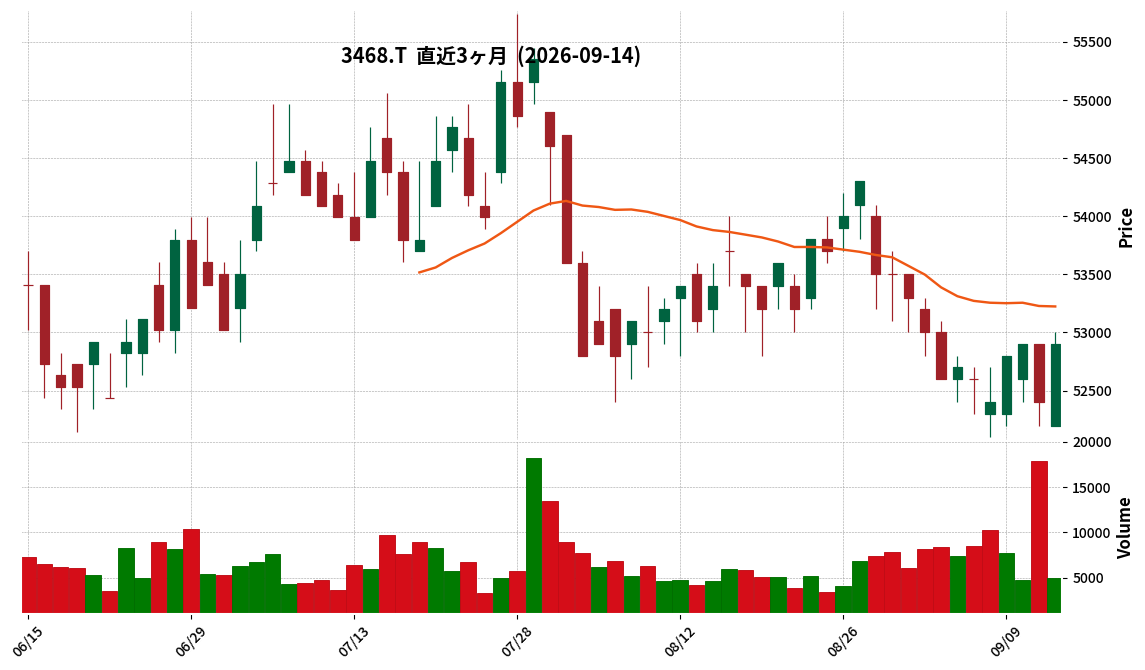
3468|R-スターアジア
52900.0
▲ +0.95%
📎 Source:R-スターアジア Official IR →
This article is an AI-generated summary and analysis of official IR disclosures.
📄 Announcement (AI-Reviewed)
- Star Asia Investment Corporation revised upward its earnings and distribution forecasts for the January 2027 fiscal period (August 1, 2026 – January 31, 2027).
- Distribution per unit (excluding excess distributions) is now projected at ¥1,755, an increase of ¥95 (5.7%) from the previous forecast of ¥1,660.
- Operating revenue increased by ¥1,007 million (10.5%) from ¥9,615 million to ¥10,622 million, and net income increased by ¥813 million (18.6%) from ¥4,373 million to ¥5,186 million.
- The revision is attributed to a projected deviation of over 5% in the distribution forecast following the “Notice Concerning the Acquisition of Domestic Real Estate Trust Beneficiary Rights and Silent Partnership Interests and the Transfer of Domestic Real Estate Trust Beneficiary Rights (13th Asset Replacement)” released today.
- The forecast assumes 2,687,000 outstanding investment units at the end of the period.
🤖 AI Perspective
This upward revision of distribution forecasts appears to be a direct consequence of the announced asset replacement strategy. The significant increase in operating revenue and net income may suggest that the new asset portfolio is expected to enhance overall profitability and efficiency. For investors, this could indicate positive momentum regarding the REIT’s distribution stability and growth prospects.
3475|グッドコムアセット
1418.0
▼ -0.70%
📎 Source:グッドコムアセット Official IR →
This article is an AI-generated summary and analysis of official IR disclosures.
📄 Announcement (AI-Reviewed)
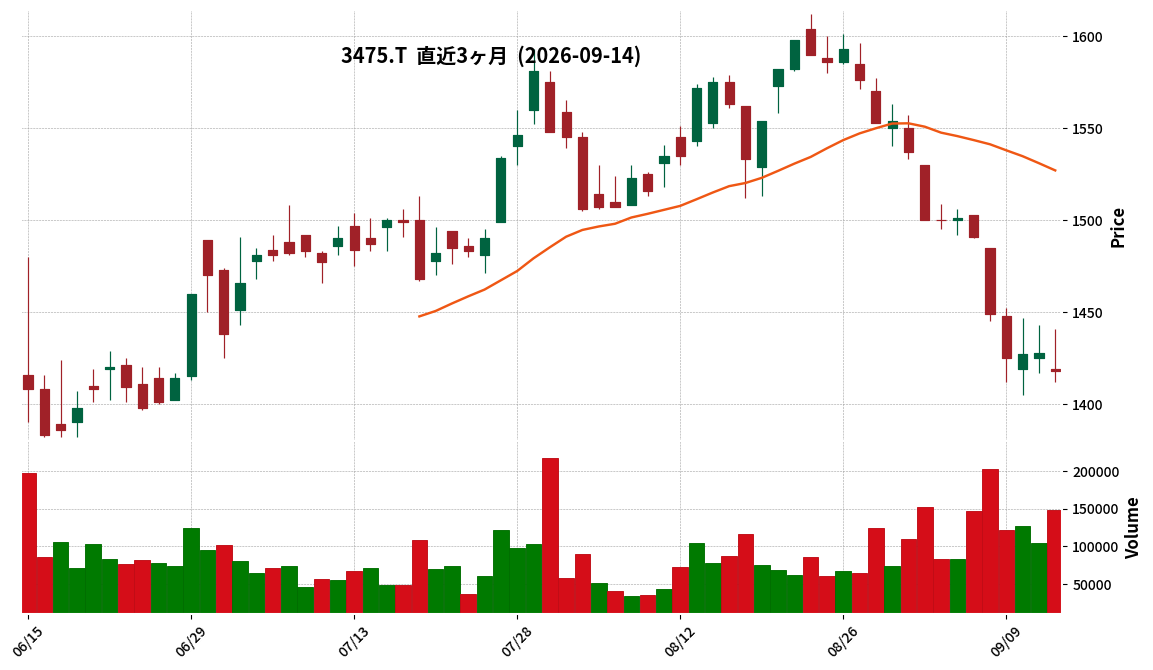
- Good Com Asset Co., Ltd. announced its financial results for the Third Quarter of FY2026 (November 1, 2025 – July 31, 2026).
- Consolidated net sales reached ¥34.98 billion (up 40.9% year-on-year), operating profit was ¥2.63 billion (up 143.7% year-on-year), ordinary profit was ¥2.08 billion (up 130.4% year-on-year), and net profit attributable to parent company shareholders was ¥1.37 billion (up 198.6% year-on-year).
- Key drivers for the significant increase in sales and profits include the full-year contribution from the Livenup Group and revenue from the 5th fund through Q2.
- On the consolidated balance sheet, inventories increased to ¥51.73 billion (up ¥22.20 billion from the previous fiscal year) and interest-bearing debt rose to ¥48.79 billion (up ¥20.99 billion from the previous fiscal year). This is attributed to accelerated property acquisitions for future sales growth.
- The full-year performance forecast remains unchanged, projecting net sales of ¥79.28 billion (up 45.3% from the previous period), operating profit of ¥7.72 billion (up 163.3%), ordinary profit of ¥6.84 billion (up 164.6%), and net profit attributable to parent company shareholders of ¥4.54 billion (up 198.4%).
🤖 AI Perspective
The Q3 results indicate substantial growth in both revenue and profit, primarily driven by the contributions of the Livenup Group and the real estate fund business. The increase in inventories and interest-bearing debt is explained as a strategic move to accelerate property acquisitions, suggesting an intent to expand the scale of operations. With the full-year forecast remaining unchanged, the company appears focused on achieving its targets, including the planned formation of the 6th fund in Q4.
3491|G-GA TECH
1451.0
▲ +0.28%
📎 Source:G-GA TECH Official IR →
This article is an AI-generated summary and analysis of official IR disclosures.
📄 Announcement (AI-Reviewed)
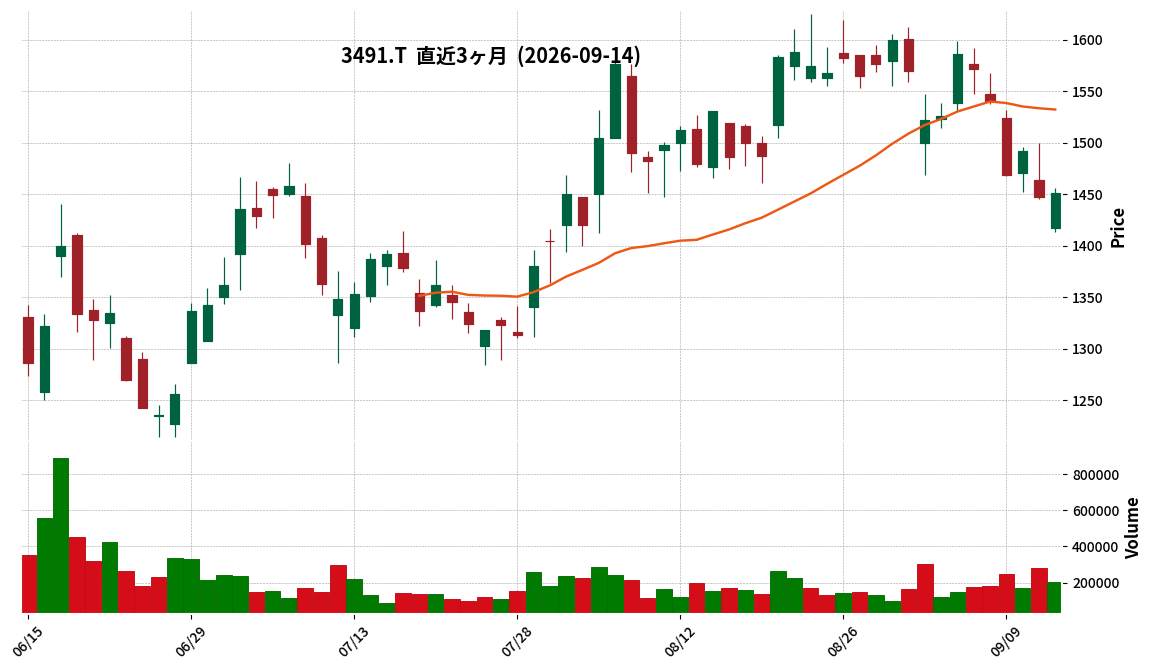
- G-GA TECH announced its consolidated financial results for the third quarter of the fiscal year ending October 2026 (November 1, 2025 – July 31, 2026).
- Revenue increased by 24.8% year-on-year to ¥211,627 million.
- Net Revenue rose by 24.2% year-on-year to ¥38,529 million.
- Business profit stood at ¥5,722 million (down 3.6% year-on-year), and operating profit was ¥5,389 million (down 9.9% year-on-year).
- Profit attributable to owners of the parent for the quarter decreased by 9.0% year-on-year to ¥2,734 million.
- Basic earnings per share were ¥66.61, and diluted earnings per share were ¥66.32, compared to ¥76.32 and ¥76.24 respectively in the prior year’s same quarter.
- The consolidated full-year forecast for the fiscal year ending October 2026 remains unchanged, projecting revenue of ¥323,000 million and profit attributable to owners of the parent of ¥5,460 million.
🤖 AI Perspective
G-GA TECH’s Q3 results indicate robust growth in revenue and net revenue, while profitability metrics show a year-on-year decrease. This divergence could suggest increasing operational costs or investments impacting the bottom line despite top-line expansion. With the full-year forecast maintained, investors may be monitoring how the company plans to balance growth with profitability in the final quarter.
Disclaimer: This article is for informational purposes only and does not constitute investment advice.
3565|アセンテック
490.0
▲ +2.94%
This article is an AI-generated summary and analysis of official IR disclosures.
📄 Announcement (AI-Reviewed)
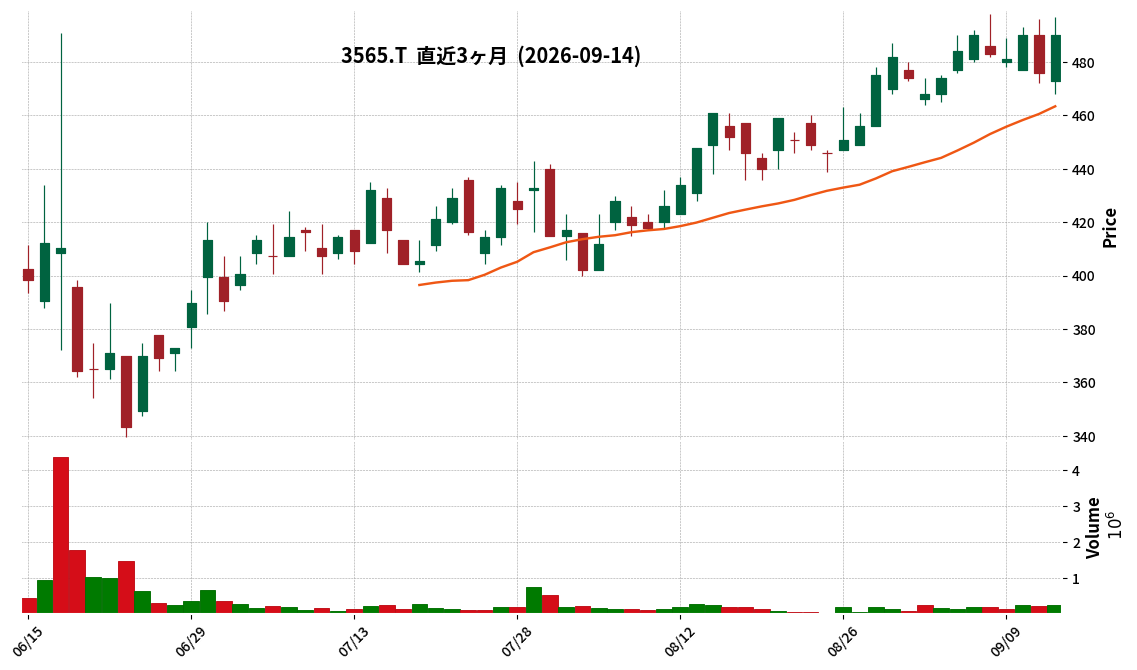
- Ascentec announced its consolidated financial results for the second quarter (interim period) of the fiscal year ending January 2027.
- For the interim period, net sales were ¥7,902 million (down 27.1% year-on-year), operating profit was ¥862 million (down 21.5% year-on-year), ordinary profit was ¥773 million (down 30.8% year-on-year), and net profit attributable to owners of the parent was ¥752 million (down 2.7% year-on-year).
- The primary reason for the decrease in revenue was a reaction from a large-scale project in the virtual desktop business segment recorded in the previous corresponding period.
- An extraordinary gain of ¥317 million from the sale of investment securities was recorded.
- A 3-for-1 stock split was implemented for common shares on May 1, 2026.
- The full-year consolidated earnings forecast for FY2027 is ¥17,500 million in net sales (up 1.4% year-on-year), ¥2,000 million in operating profit (down 29.6% year-on-year), ¥2,100 million in ordinary profit (down 27.4% year-on-year), and ¥1,430 million in net profit attributable to owners of the parent (down 30.6% year-on-year).
🤖 AI Perspective
The interim period saw a decline in net sales and various profit figures compared to the previous year, primarily due to the rebound effect of a large virtual desktop software project in the prior period. However, the recording of an extraordinary gain from the sale of investment securities helped to mitigate the overall decline in net profit. Investors may note the ongoing growth strategies, including the announcement of new proprietary AI products, business alliances with a Korean company, and the expansion of recurring revenue streams, as these initiatives could contribute to future performance.
391A|山忠
—
▲ +0.00%
This article is an AI-generated summary and analysis of official IR disclosures.
📄 Announcement (AI-Reviewed)
- Yamachuu announced its Q1 FY2027 consolidated financial results on September 14, 2026.
- For the three months ended July 31, 2026, consolidated net sales were ¥1,230 million (down 8.7% YoY), operating profit was ¥184 million (down 22.1% YoY), ordinary profit was ¥158 million (down 21.2% YoY), and profit attributable to owners of parent was ¥140 million (down 19.9% YoY).
- By segment, the Development segment reported sales of ¥750 million (down 15.8% YoY) and segment profit of ¥84 million (down 32.8% YoY).
- The Stock segment reported sales of ¥154 million (up 6.7% YoY) and segment profit of ¥45 million (down 12.2% YoY). The Hotel segment reported sales of ¥326 million (up 4.2% YoY) and segment profit of ¥55 million (down 8.6% YoY).
- The consolidated full-year earnings forecast and dividend forecast for FY2027 remained unchanged from the most recently published figures.
🤖 AI Perspective
Yamachuu’s Q1 FY2027 results show a year-on-year decline in both revenue and various profit metrics. The significant decrease in the Development segment, driven by lower sales of condominiums and residential land, appears to be a primary factor influencing the overall performance. Conversely, the Stock and Hotel segments recorded sales growth, suggesting a mixed performance across different business areas. The company’s decision to maintain its full-year earnings forecast might indicate management’s confidence in a recovery or stronger performance in subsequent quarters.
4053|サンアスタリスク
460.0
▲ +2.00%
📎 Source:サンアスタリスク Official IR →
This article is an AI-generated summary and analysis of official IR disclosures.
📄 Announcement (AI-Reviewed)
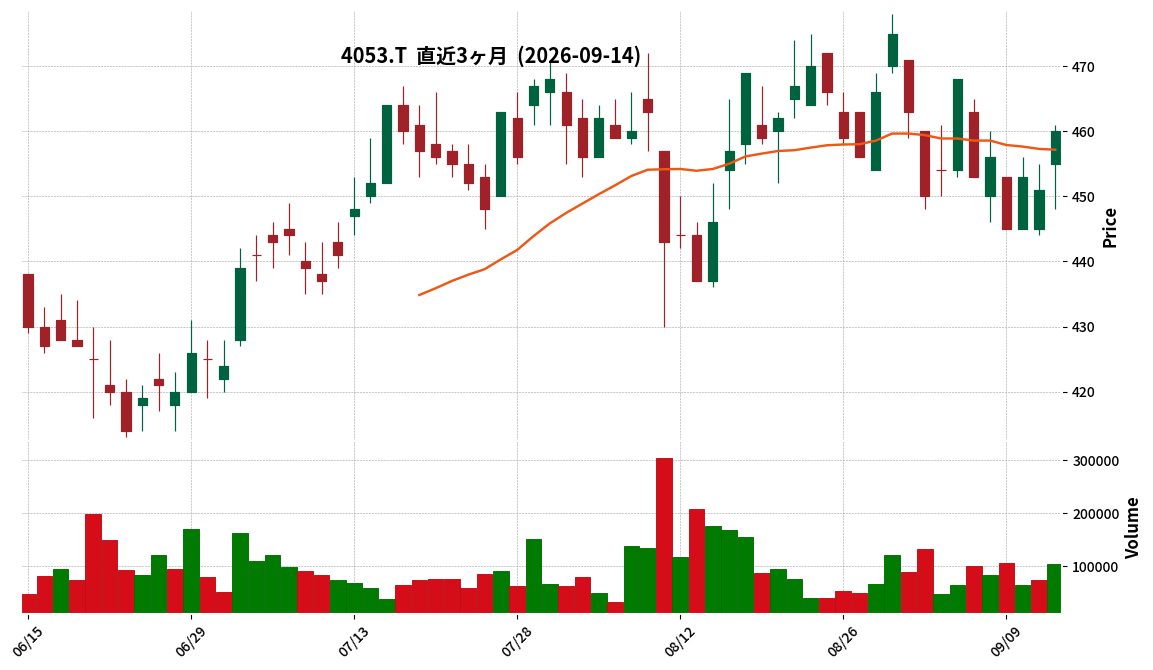
- Sun Asterisk announced its consolidated financial results for the second quarter (interim period) of the fiscal year ending December 2026.
- Consolidated net sales reached 8,881 million yen (up 25.8% year-on-year), operating profit was 1,004 million yen (up 141.8% year-on-year), ordinary profit was 1,189 million yen (up 163.1% year-on-year), and net income attributable to owners of the parent was 792 million yen (up 128.0% year-on-year).
- Sales in the Creative & Engineering business amounted to 7,033 million yen (up 28.5% year-on-year), with 227 unique clients and an average monthly sales per client of 6,133 thousand yen.
- The Talent Platform business reported sales of 967 million yen (down 2.8% year-on-year), while the Incubation & Other business reported sales of 881 million yen (up 49.0% year-on-year).
- The consolidated earnings forecast for the fiscal year ending December 2026 remains unchanged, projecting full-year sales revenue of 18,201 million yen, operating profit of 1,714 million yen, and net income attributable to owners of the parent of 1,389 million yen.
🤖 AI Perspective
The significant increase in operating profit, alongside robust sales growth, stands out in this earnings report. The Creative & Engineering business appears to be a key driver, benefiting from strong orders from existing clients. Investors may also note the slight decline in the Talent Platform business’s sales and the revised timeline for IFRS adoption, which could be relevant for future financial analysis.
4174|アピリッツ
1045.0
▲ +0.00%
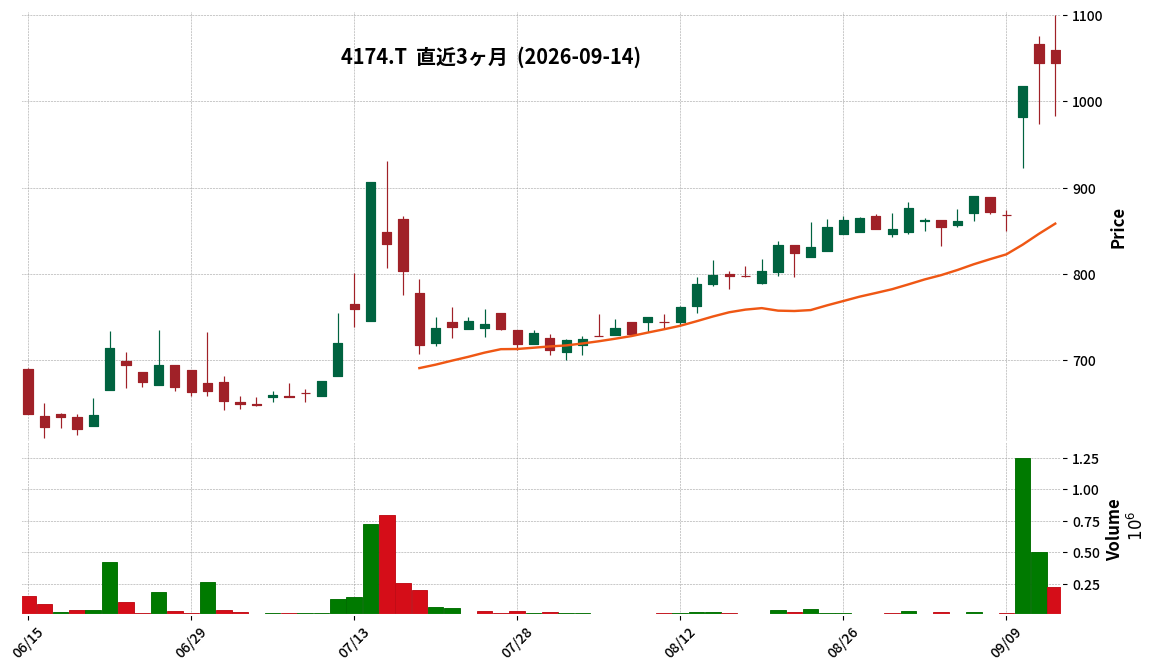
This article is an AI-generated summary and analysis of official IR disclosures.
📄 Announcement (AI-Reviewed)
- Appirits Inc. announced its consolidated financial results for the second quarter (interim period) of the fiscal year ending January 2027.
- Net sales amounted to ¥4,964 million, a 3.7% decrease compared to the same interim period of the previous year.
- Operating profit was ¥166 million (vs. an operating loss of ¥18 million in the prior interim period), ordinary profit was ¥156 million (vs. an ordinary loss of ¥25 million), and net income attributable to owners of parent was ¥67 million (vs. a net loss of ¥35 million), marking a return to profitability for all profit items.
- Interim basic earnings per share were ¥16.58 (vs. a loss of ¥8.82 in the prior interim period).
- The annual dividend forecast remains unchanged at ¥29.00 per share, comprising an interim dividend of ¥14.50 and a year-end dividend of ¥14.50.
- The full-year consolidated earnings forecast is maintained with net sales of ¥10,843 million (an 8.9% increase year-on-year), operating profit of ¥462 million, ordinary profit of ¥424 million, net income attributable to owners of parent of ¥217 million, and basic earnings per share of ¥53.80.
- Full Balance Inc. was newly included in the scope of consolidation during this interim period.
🤖 AI Perspective
The turnaround from losses in the prior interim period to profitability across all key profit metrics in the current interim period is a notable development. While net sales saw a slight decline, the significant improvement in profitability could suggest enhanced operational efficiency or effective cost management strategies. The company’s decision to maintain its full-year earnings and dividend forecasts may indicate a stable outlook for the remainder of the fiscal year.
441A|G-NE
274.0
▲ +1.48%
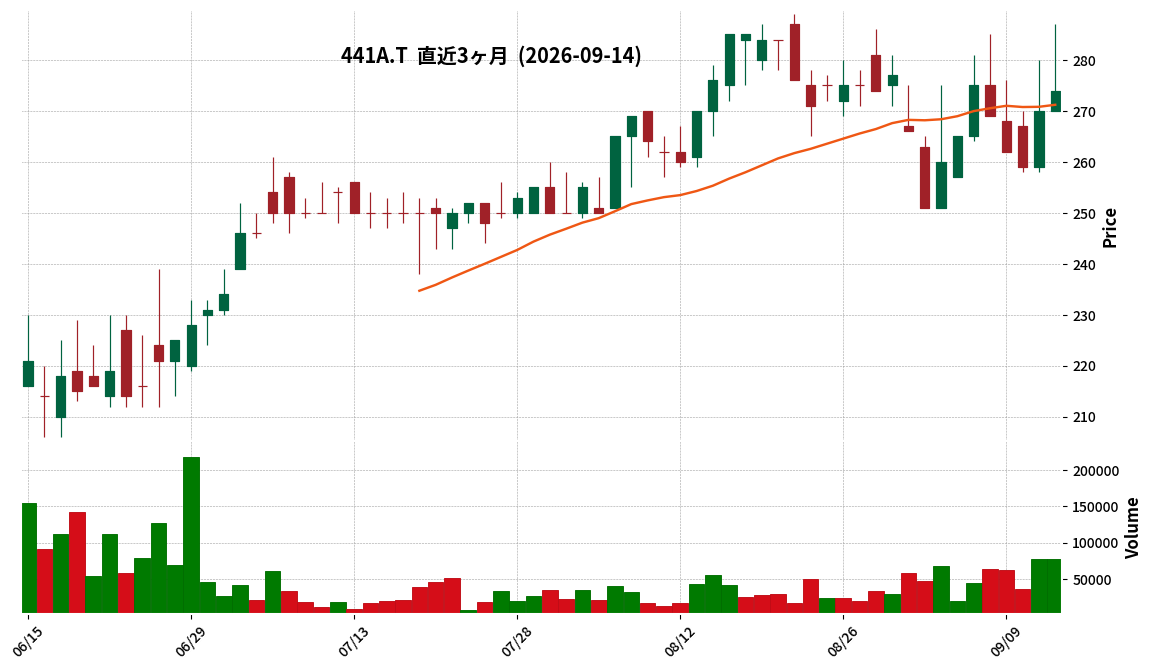
This article is an AI-generated summary and analysis of official IR disclosures.
📄 Announcement (AI-Reviewed)
- G-NE announced its financial results for the first quarter of the fiscal year ending April 2027 (May 1, 2026 – July 31, 2026).
- For the cumulative results, net sales were ¥966 million (down 2.7% year-on-year), operating profit was ¥310 million (down 12.9% YoY), ordinary profit was ¥311 million (down 12.6% YoY), and quarterly net profit was ¥211 million (down 11.4% YoY).
- Regarding the financial position, total assets at the end of Q1 were ¥5,313 million, net assets were ¥4,812 million, and the equity ratio was 90.6%.
- The company announced a segment name change from “Locarco Business” to “Commerce Tech Business,” noting that the Furusato Nozei support business is not expected to contribute to performance after August 2026.
- The Next Engine business reported sales of ¥834 million (up 5.0% YoY) and segment profit of ¥557 million (up 8.8% YoY), while the Consulting business reported sales of ¥81 million (down 40.5% YoY) and segment profit of ¥4 million (down 79.3% YoY).
🤖 AI Perspective
G-NE’s Q1 FY2027 results show a year-on-year decline in net sales and all profit metrics, which may suggest the consulting business’s underperformance significantly impacted the overall results. Conversely, the core Next Engine business achieved growth in both sales and profit, indicating a divergence in performance across different business segments. The segment name change to “Commerce Tech Business” due to the divestiture of the Furusato Nozei support business could signal a shift in the company’s future business portfolio.
Disclaimer: This article is for informational purposes only and does not constitute investment advice.
442A|G-クラシコ
976.0
▲ +0.51%
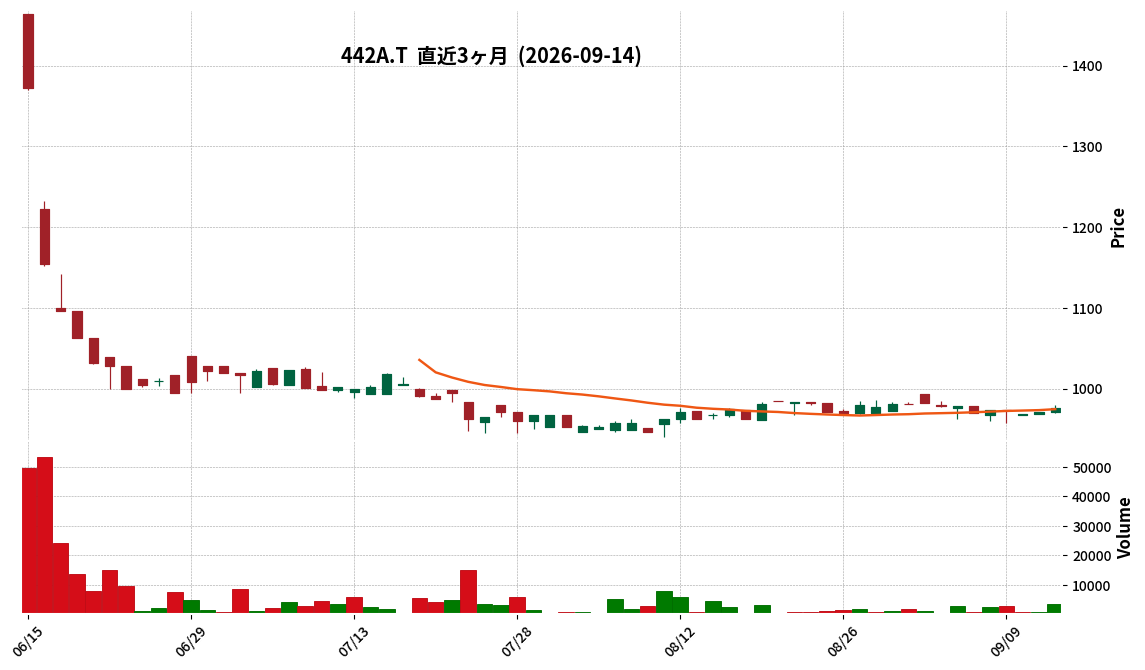
This article is an AI-generated summary and analysis of official IR disclosures.
📄 Announcement (AI-Reviewed)
- G-Classico announced its financial results for the third quarter of the fiscal year ending October 2026 (November 1, 2025, to July 31, 2026).
- Net sales for the period totaled ¥2,166 million, a 19.7% decrease year-over-year. The company reported an operating loss of ¥423 million (compared to an operating profit of ¥112 million in the prior year), an ordinary loss of ¥429 million (compared to an ordinary profit of ¥99 million), and a net loss for the quarter of ¥1,076 million (compared to a net profit of ¥117 million).
- As of the end of the third quarter, total assets stood at ¥1,875 million (down ¥530 million from the previous fiscal year-end), net assets at ¥750 million (down ¥663 million), and the equity ratio decreased to 39.9% from 58.8%.
- The full-year forecast for FY2026 has been revised, projecting net sales of ¥2,919 million (a 19.6% decrease from the previous year) and a net loss of ¥1,201 million.
- The company has decided to record extraordinary losses, including losses from inventory disposal and impairment losses on fixed assets, and to implement a change in management policy.
🤖 AI Perspective
The third-quarter results show a significant year-on-year decline in net sales and a substantial net loss, attributed to reduced wholesale transactions, underperforming corporate sales in China, changes in the external environment, a shift in management policy, and the recording of extraordinary losses. The downward revision of the full-year forecast indicates ongoing challenges. Investors may monitor the specifics of the new management policy and its potential impact on future performance.
4592|G-サンバイオ
948.0
▲ +2.82%
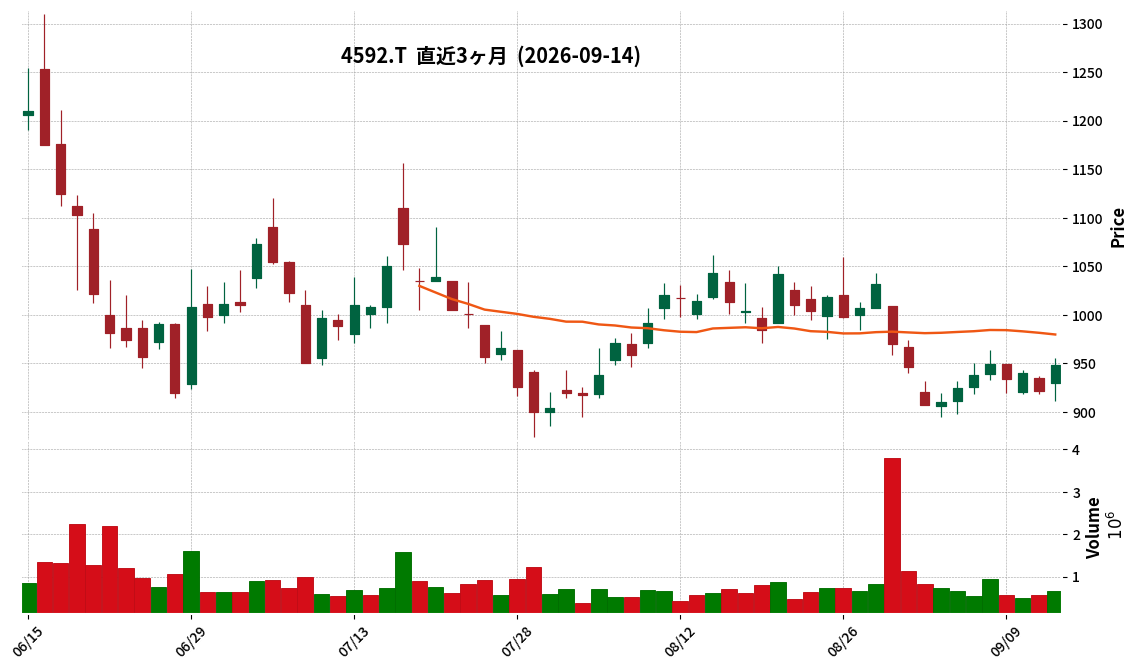
📎 Source:G-サンバイオ Official IR →
This article is an AI-generated summary and analysis of official IR disclosures.
📄 Announcement (AI-Reviewed)
- G-サンバイオ announced its consolidated financial results for the second quarter of the fiscal year ending January 2027.
- Net loss attributable to owners of parent was ¥1,791 million, a decrease in loss compared to ¥1,997 million in the prior fiscal year’s corresponding interim period.
- Operating loss was ¥1,909 million (prior year interim period: ¥1,888 million loss), and ordinary loss was ¥1,730 million (prior year interim period: ¥2,481 million loss).
- Research and development expenses for the interim consolidated accounting period amounted to ¥1,226 million.
- The company’s proprietary cell therapy product SB623 for chronic traumatic brain injury, “Akueigo® for Intracranial Implantation,” was listed on the drug price standard in May 2026 with a price of ¥72 million, and sales have commenced.
- Cash and deposits decreased by ¥2,335 million, with cash and cash equivalents totaling ¥12,677 million at the end of the interim consolidated accounting period.
🤖 AI Perspective
G-Sanbio’s Q2 FY2027 results show a reduced net loss attributable to owners of parent compared to the previous year, partly due to the recording of ¥185 million in foreign exchange gains. The commencement of Akueigo® sales marks a significant step, potentially laying the groundwork for future revenue generation, making its sales performance a key area for investors to monitor. However, the continued investment in R&D, including preparations for a Phase 3 trial in the U.S. and efforts to expand indications for cerebral infarction in Japan, suggests that the company remains in a growth investment phase.
4811|G-ドリーム・アーツ
866.0
▲ +0.00%
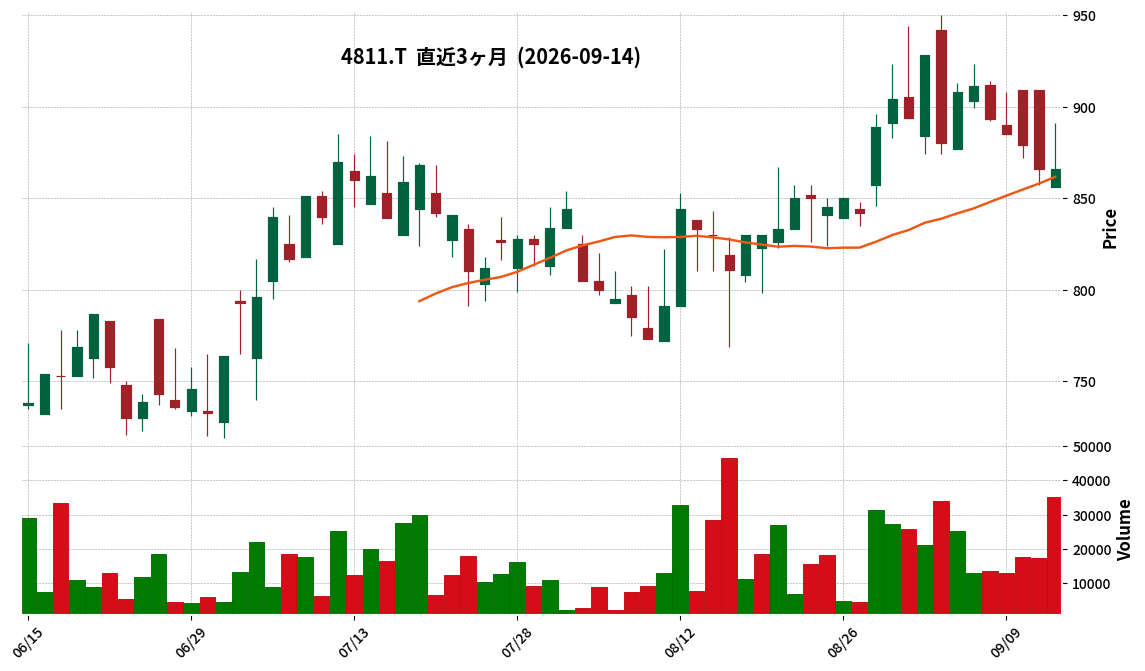
📎 Source:G-ドリーム・アーツ Official IR →
This article is an AI-generated summary and analysis of official IR disclosures.
📄 Announcement (AI-Reviewed)
- Dream Arts Inc. released the transcript and Q&A session from its Q2 FY2026 earnings briefing on September 14, 2026.
- The briefing was held online on Thursday, August 27, 2026, with President and Representative Director Takaaki Yamamoto and Senior Managing Executive Officer and General Manager of Corporate Planning Division Kimihiko Makiyama in attendance.
- The Q&A covered topics including the business environment for DX internalisation, the evolution of SmartDB as an AI-Ready data generation platform and its competitive advantages, and the objectives of the capital and business alliance with Cocoo Inc.
- Regarding new SmartDB implementations, the company noted a trend of increasing project scale and outlined three growth axes: expanded scope, increased complexity, and long-term usage.
- On future dividend policy, the company stated a target payout ratio of 30% and an intention to maintain the per-share dividend at the previous year’s level, based on a progressive dividend policy, despite an anticipated temporary decline in profits for the current fiscal year.
🤖 AI Perspective
The released Q&A document offers insights into Dream Arts’ business strategy and growth drivers, particularly addressing investor interest in DX internalization trends and SmartDB’s competitive positioning in the AI era. The explanation of SmartDB’s evolution into an AI-Ready data generation platform suggests how the company aims to adapt its business model to market shifts. Furthermore, the capital and business alliance with Cocoo Inc. can be seen as a strategic move to strengthen the customer base through human resource development for SmartDB implementation and utilization, potentially contributing to future business growth.
4934|G-Pアンチエイジ
610.0
▲ +0.16%
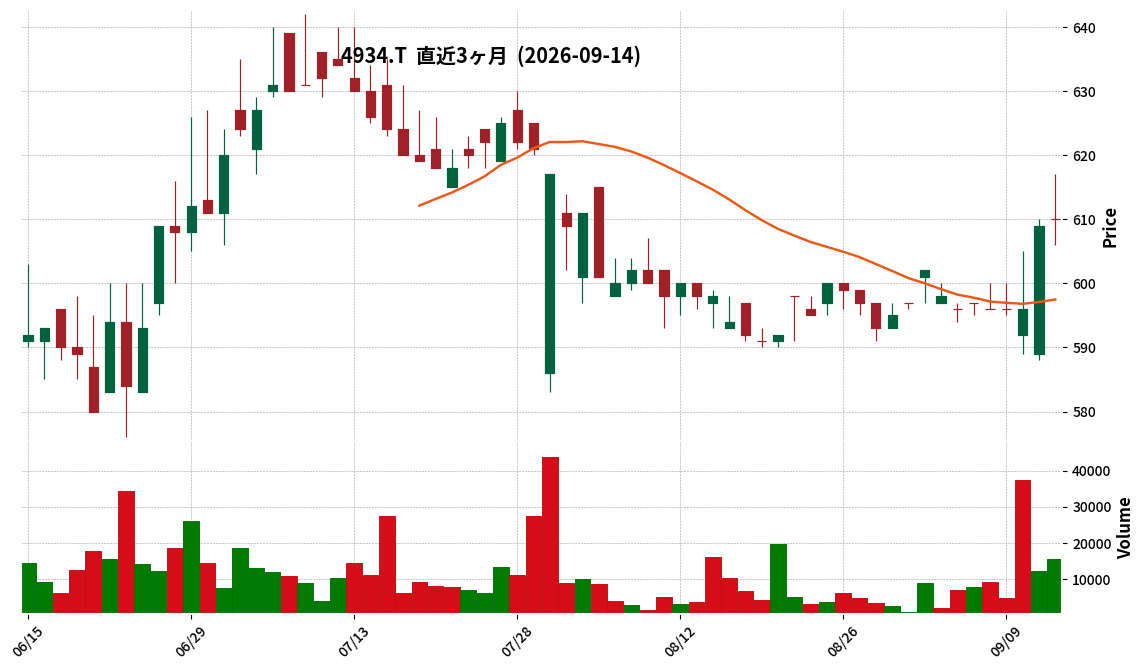
📎 Source:G-Pアンチエイジ Official IR →
This article is an AI-generated summary and analysis of official IR disclosures.
📄 Announcement (AI-Reviewed)
- G-P ANTI-AGING’s consolidated financial results for the fiscal year ended July 2026 reported net sales of ¥13,883 million (down 14.1% year-on-year).
- Operating profit stood at ¥494 million (down 19.8% year-on-year), while ordinary profit increased by 0.5% to ¥602 million.
- Profit attributable to owners of parent was ¥364 million (down 22.8% year-on-year), impacted by extraordinary losses from business restructuring costs related to the dissolution and liquidation of a local subsidiary in China.
- The consolidated performance forecast for the fiscal year ending July 2027 projects net sales of ¥13,500 million (down 2.8% year-on-year), operating profit of ¥100 million (down 80.0% year-on-year), ordinary profit of ¥100 million (down 83.4% year-on-year), and profit attributable to owners of parent of ¥100 million (down 72.5% year-on-year).
- The Anti-Aging segment reported sales of ¥10,349 million (down 19.9% year-on-year), but its operating profit increased by 61.5% to ¥660 million.
🤖 AI Perspective
G-P ANTI-AGING’s FY2026 results showed a decline in net sales and operating profit, but ordinary profit saw a slight increase, potentially due to foreign exchange gains. The improvement in operating profit within the Anti-Aging segment suggests that advertising expenses were below plan and fixed costs were reduced. However, net profit was impacted by one-time restructuring costs in China, and the company has issued a more conservative outlook for the upcoming fiscal year.
278A|G-テラドローン
20310.0
▼ -3.29%
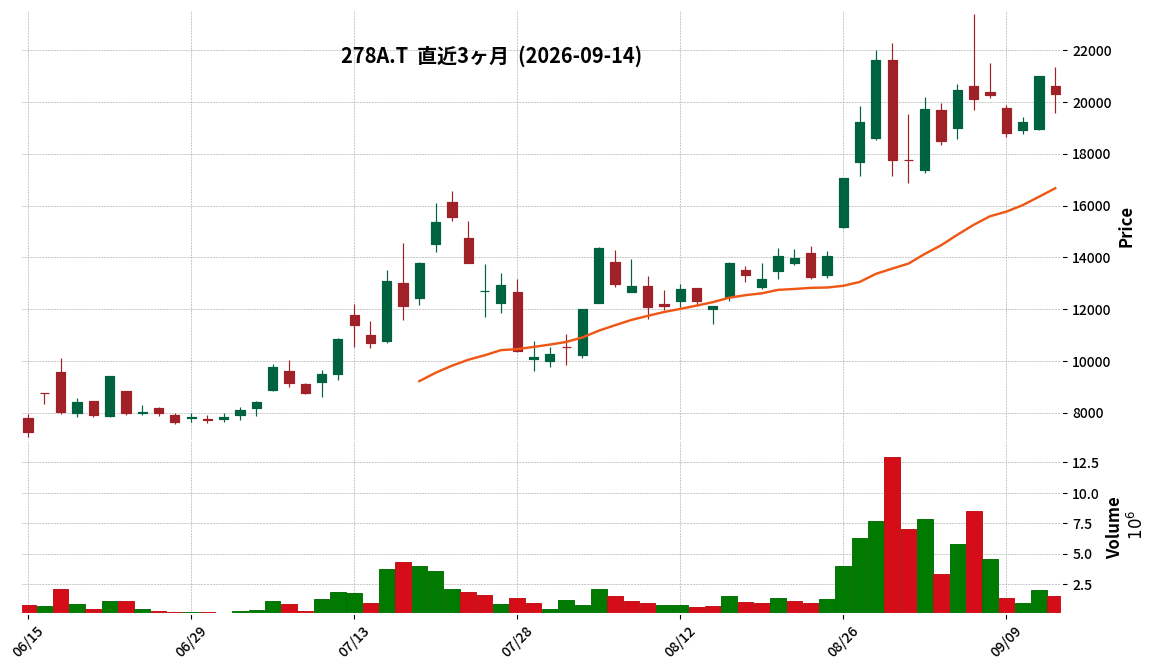
📎 Source:G-テラドローン Official IR →
This article is an AI-generated summary and analysis of official IR disclosures.
📄 Announcement (AI-Reviewed)
- Terra Drone Co., Ltd. announced its consolidated financial results for the second quarter of the fiscal year ending January 2027.
- For the interim period, net sales reached ¥2,235 million, representing a 15.1% increase compared to the same period of the previous year.
- The company reported an operating loss of ¥819 million, an ordinary loss of ¥695 million, and a net loss attributable to owners of the parent of ¥680 million.
- The consolidated financial position shows total assets of ¥11,746 million, net assets of ¥9,889 million, and an equity ratio of 83.8%.
- The full-year consolidated earnings forecast for the fiscal year ending January 2027 remains unchanged from the most recently announced forecast, projecting net sales of ¥5,073 million, an operating loss of ¥1,658 million, and a net loss attributable to owners of the parent of ¥1,266 million.
- Significant changes in the scope of consolidation for this interim period include the addition of three new companies: Sora Consulting GmbH, Euro USC Netherlands, and Terra Defense Europe OU.
🤖 AI Perspective
Terra Drone’s Q2 FY2027 results indicate sales growth but continued losses, which is common for companies in growth phases within emerging markets like drones and defense systems. The strategic entry into the defense business and the consolidation of new overseas subsidiaries suggest a focus on global expansion and market diversification. Investors may monitor how these initiatives impact future revenue and profitability, while the high equity ratio could be seen as a positive indicator of financial stability.
2391|プラネット
1178.0
▲ +0.34%
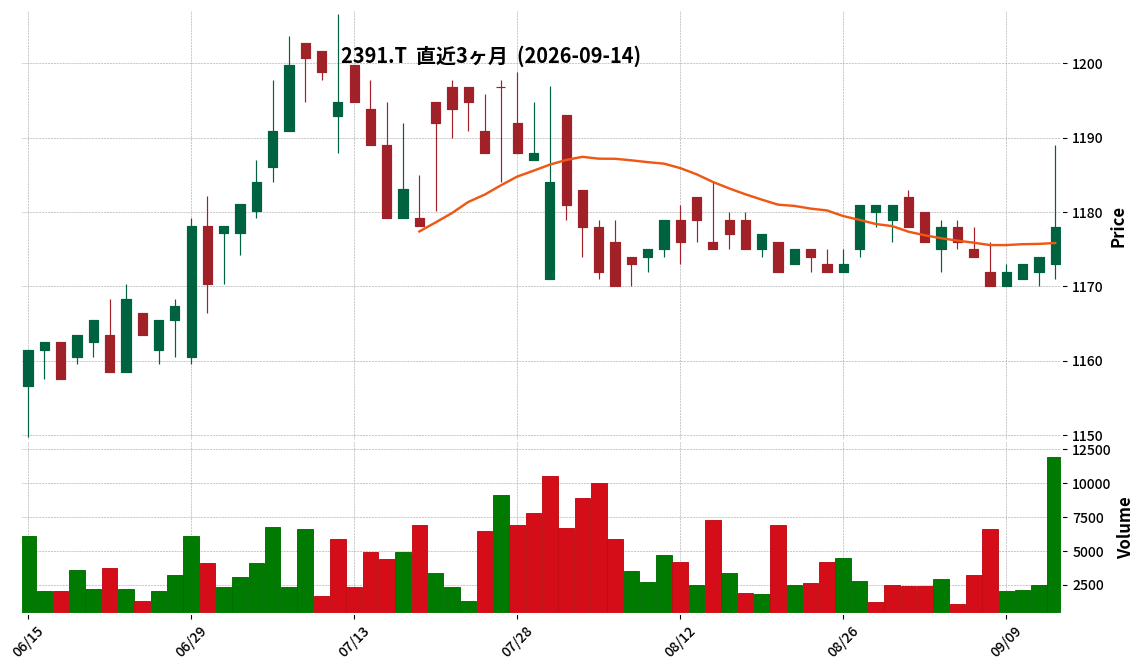
This article is an AI-generated summary and analysis of official IR disclosures.
📄 Announcement (AI-Reviewed)
- Planet Inc. announced its financial results for the fiscal year ended July 2026 (August 1, 2025 – July 31, 2026), non-consolidated.
- For FY2026, net sales were ¥3,148 million (down 0.4% year-on-year), operating profit was ¥557 million (down 1.2%), ordinary profit was ¥595 million (up 0.5%), and net profit was ¥412 million (up 2.9%).
- Earnings per share (EPS) increased to ¥62.55, up from ¥60.44 in the previous fiscal year.
- The annual dividend per share increased to ¥44.00 (interim ¥22.00, year-end ¥22.00) from ¥43.50 in the prior year.
- For FY2027, the company forecasts full-year net sales of ¥3,195 million (up 1.5% year-on-year), operating profit of ¥485 million (down 13.0%), ordinary profit of ¥515 million (down 13.5%), and net profit of ¥355 million (down 13.9%).
🤖 AI Perspective
While Planet’s revenue and operating profit saw slight decreases in FY2026, the increase in net profit suggests a focus on maintaining or improving profitability. The increase in the annual dividend payment may indicate a commitment to shareholder returns. The FY2027 forecast projects revenue growth but anticipates a decline in all profit categories, which could be attributed to changes in the business environment, upfront investments, or shifts in cost structure.
184A|G-学びエイド
332.0
▲ +2.79%
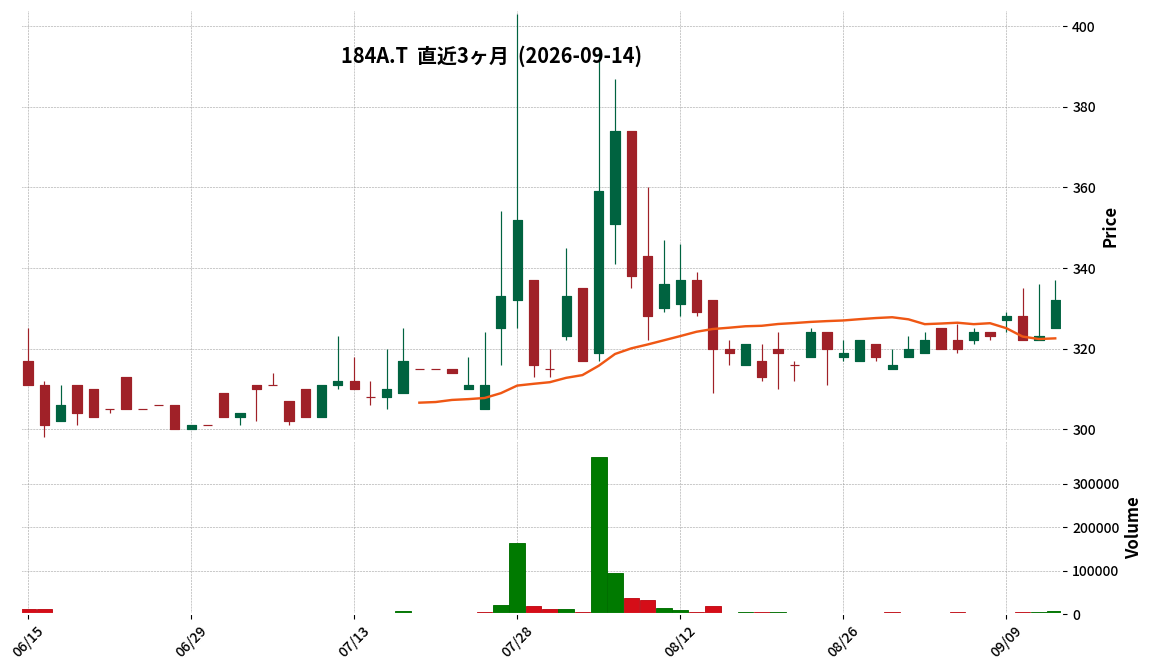
📎 Source:G-学びエイド Official IR →
This article is an AI-generated summary and analysis of official IR disclosures.
📄 Announcement (AI-Reviewed)
- G-Manabieid announced its Q1 FY2027 financial results for the period from May 1, 2026, to July 31, 2026.
- Sales revenue for the quarter was ¥76 million, marking a 34.3% increase compared to the same period in the previous year.
- The company reported an operating loss of ¥44 million, an ordinary loss of ¥44 million, and a net loss for the quarter of ¥44 million. These figures represent an improvement from the operating loss of ¥77 million, ordinary loss of ¥85 million, and net loss of ¥85 million in the prior year’s first quarter.
- Regarding service-specific sales, “Manabieid Master for School” grew significantly by 196.8% year-on-year to ¥49,684 thousand. In contrast, “Manabieid Master” decreased by 16.9% to ¥16,070 thousand, and “Manabieid for Enterprise” declined by 59.3% to ¥7,832 thousand.
- The full-year forecast for FY2027 remains unchanged, projecting sales of ¥708 million (a 93.5% increase year-on-year), operating profit of ¥105 million, ordinary profit of ¥106 million, and net profit of ¥83 million (¥24.51 per share).
🤖 AI Perspective
While Q1 sales increased year-on-year, the company continues to report a loss. However, the magnitude of the loss has significantly decreased from the previous year, primarily driven by strong growth in “Manabieid Master for School.” Investors may want to monitor the company’s progress towards its full-year profitability targets and the strategies in place to further enhance revenue and reduce losses in subsequent quarters.
212A|フィットイージー
2769.0
▼ -1.11%
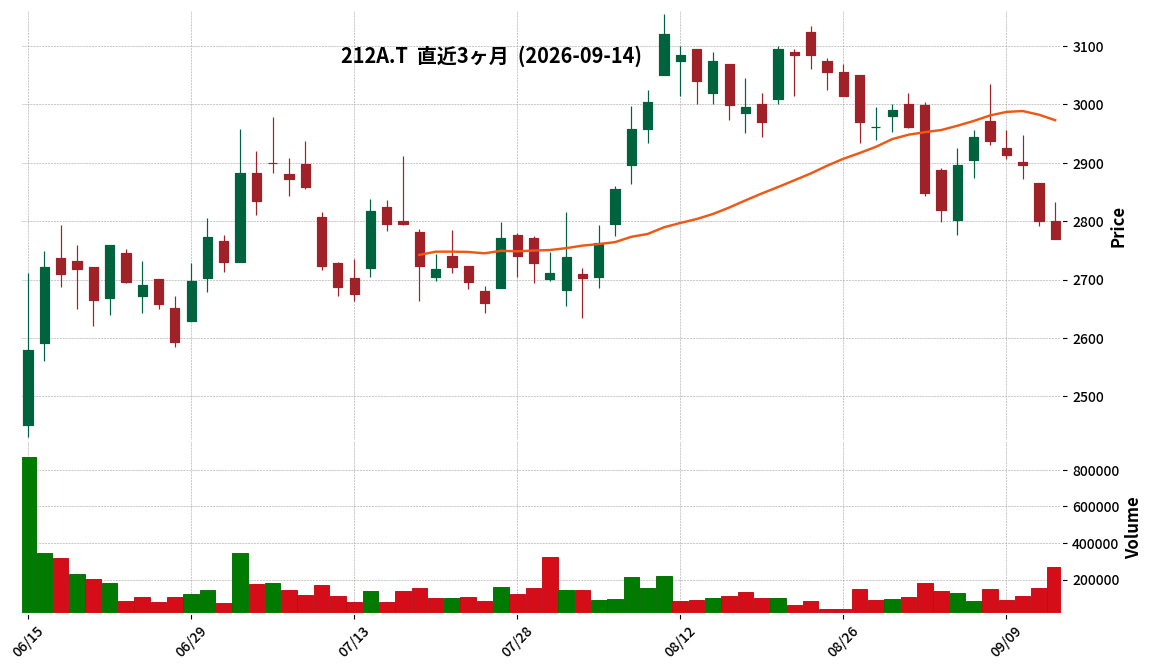
📎 Source:フィットイージー Official IR →
This article is an AI-generated summary and analysis of official IR disclosures.
📄 Announcement (AI-Reviewed)
- FIT EASY announced its non-consolidated financial results for the third quarter of the fiscal year ending October 2026 (November 1, 2025 – July 31, 2026).
- Net sales reached ¥10,623 million, a 54.4% increase year-on-year. Operating profit was ¥2,507 million (+41.3% YoY), ordinary profit was ¥2,535 million (+42.7% YoY), and quarterly net income was ¥1,725 million (+45.7% YoY).
- Basic EPS for the quarter was ¥103.79, and diluted EPS was ¥101.56.
- As of July 31, 2026, the company operated 297 stores with 292,000 members.
- The full-year forecast for FY2026 (Net sales ¥14,322 million, Operating profit ¥3,506 million, Ordinary profit ¥3,558 million, Net income ¥2,473 million, EPS ¥148.58) remains unchanged.
🤖 AI Perspective
FIT EASY’s Q3 FY2026 results show significant year-on-year growth across key financial metrics, driven by continued store expansion and membership growth. The unchanged full-year forecast may suggest that the company is performing in line with its internal projections. Investors may monitor the final quarter’s performance to assess the achievement of the full-year targets.
246A|G-アスア
927.0
▲ +0.00%
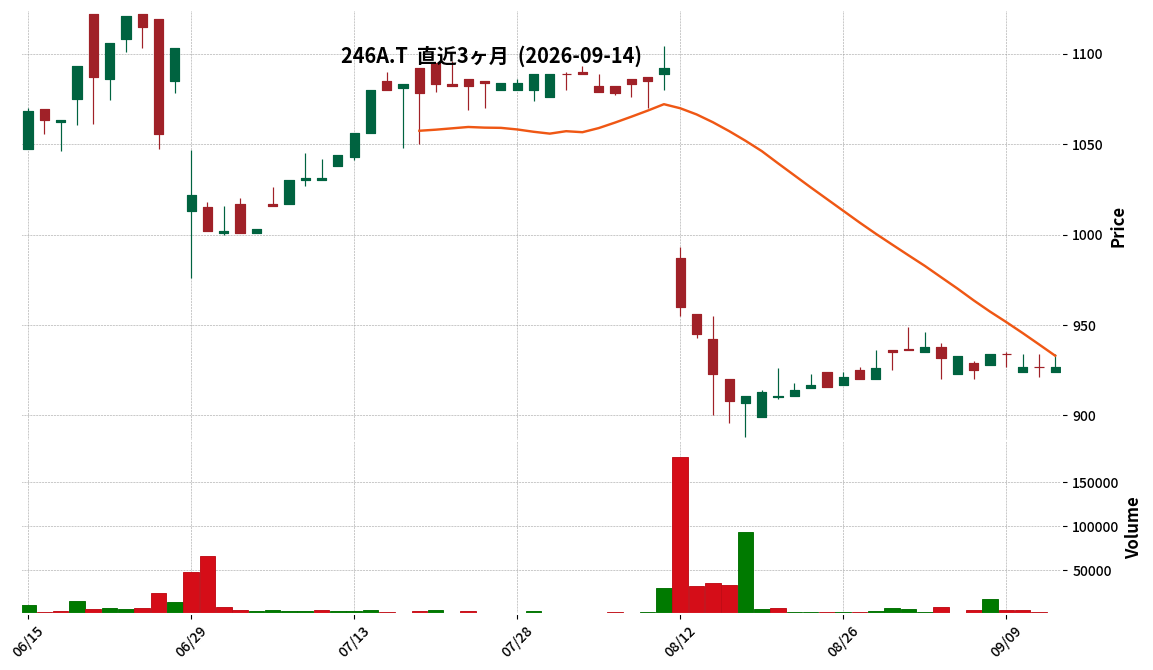
This article is an AI-generated summary and analysis of official IR disclosures.
📄 Announcement (AI-Reviewed)
- G-ASUA announced an increase in its shareholder benefit amount for the fiscal year ending June 2027 from ¥20 million to ¥40 million annually.
- Concurrently, the forecast for the per-share dividend was revised from ¥7 to ¥0.
- The financial forecasts for the fiscal year ending June 2027 were also revised: Net sales remain unchanged at ¥1,475 million, Operating profit was revised from ¥163 million to ¥143 million, Ordinary profit from ¥164 million to ¥144 million, and Net income from ¥101 million to ¥81 million.
- The increase in shareholder benefits is stated to align with the shareholder return policy revised on May 14, 2026, which set the shareholder benefit amount as “performance-linked with a minimum of ¥20 million.”
- The revised annual shareholder benefit amount of ¥40,000 thousand is stated to represent 3.8% of net assets and 6.9% of cash and deposits.
2933|紀文食品
1126.0
▲ +0.09%
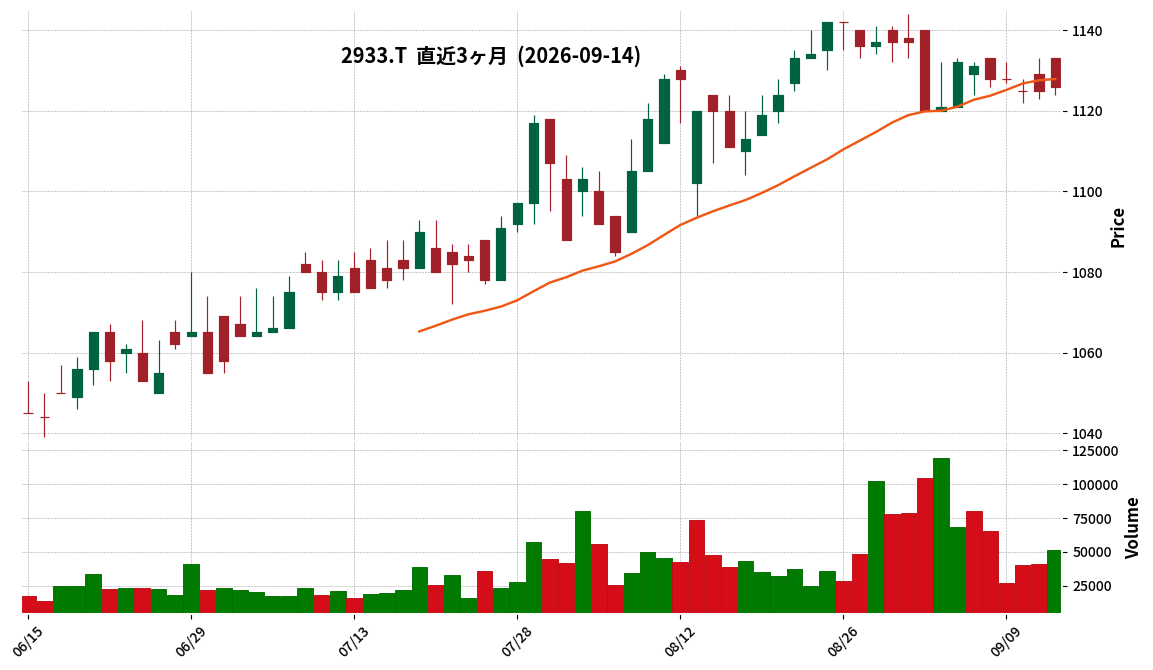
This article is an AI-generated summary and analysis of official IR disclosures.
📄 Announcement (AI-Reviewed)
- Kibun Foods has determined the details of its shareholder benefit program for shareholders as of September 30, 2026.
- Shareholders holding 300 shares (3 units) or more will receive a product assortment valued at approximately JPY 3,500.
- Shareholders holding 1,000 shares (10 units) or more will receive a product assortment or an Osechi assortment, both valued at approximately JPY 7,000, with a choice between the two.
- This year’s benefits include new products launched in the autumn/winter season and “Oden Can,” a long-term storable product useful for disaster preparedness, in addition to the previous year’s composition.
- The gift distribution is scheduled for mid-to-late November for the JPY 3,500 assortment, and mid-to-late December for the JPY 7,000 assortment and Osechi assortment.
- There are no changes to the minimum number of shares required to be eligible for the shareholder benefits.
🤖 AI Perspective
This IR indicates Kibun Foods’ ongoing efforts to enhance shareholder returns and investment appeal through its shareholder benefit program. The inclusion of new products and “Oden Can,” which can serve as an emergency stockpile, may suggest an attempt to diversify the benefits and increase their practical value. For investors, this could be viewed as an incentive for long-term shareholding.
3169|ミサワ
672.0
▼ -0.59%
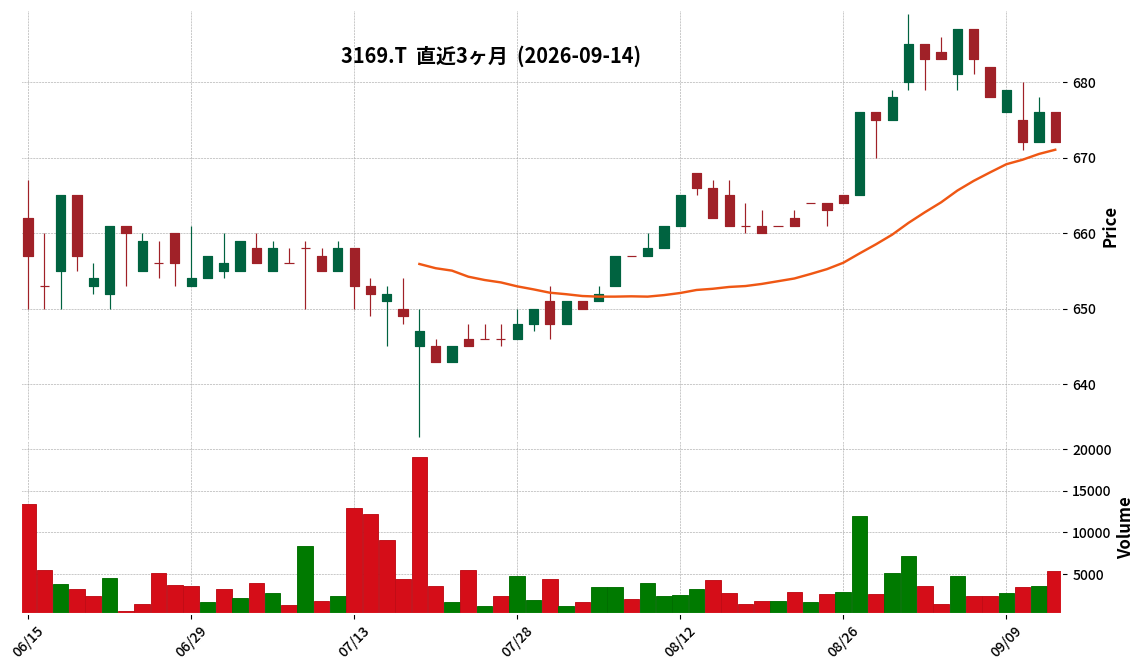
This article is an AI-generated summary and analysis of official IR disclosures.
📄 Announcement (AI-Reviewed)
- For the second quarter of FY2027 (ending January 2027), sales amounted to ¥6,293 million, representing a 9.9% increase year-on-year.
- Operating income was ¥46 million, a turnaround from an operating loss of ¥-75 million in the same period last year.
- Ordinary income was ¥13 million, and net loss for the interim period was ¥-12 million. This compares to an ordinary loss of ¥-62 million and a net loss of ¥-59 million in the prior year’s interim period.
- Diluted EPS for the interim period was ¥-1.77 (compared to ¥-8.44 in the prior year’s interim period).
- The full-year forecast remains unchanged: sales of ¥12,752 million (up 4.9% YoY), operating income of ¥246 million (up 4.7% YoY), ordinary income of ¥257 million (up 1.6% YoY), and net income of ¥172 million (up 38.0% YoY).
🤖 AI Perspective
The reported results indicate a positive shift with a year-on-year increase in sales and a return to operating profitability. This could be interpreted as a potential sign of operational improvement for the company. However, the sustained net loss for the interim period and the progress towards the full-year forecast are aspects investors may wish to monitor closely in subsequent reports.
3282|R-コンフォリア
97500.0
▲ +0.41%
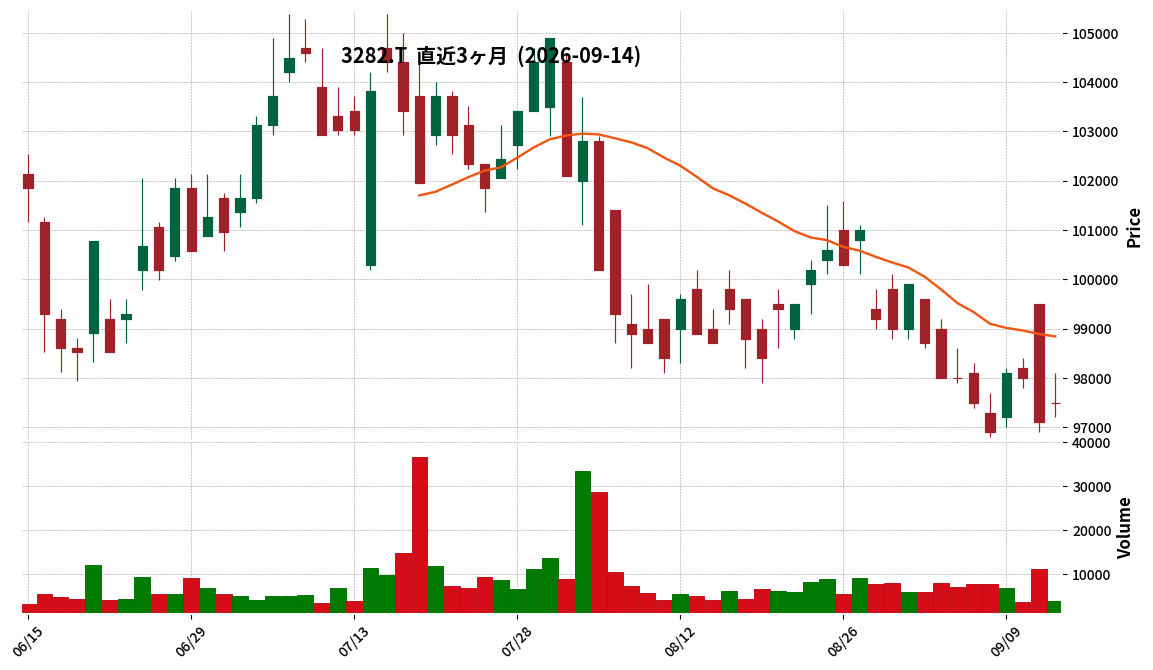
📎 Source:R-コンフォリア Official IR →
This article is an AI-generated summary and analysis of official IR disclosures.
📄 Announcement (AI-Reviewed)
- R-コンフォリア announced its financial results (REIT) for the fiscal period ended July 2026 (32nd Period) on September 14, 2026.
- For the July 2026 period, operating revenue was ¥12,975 million (+5.3% YoY), operating income was ¥6,405 million (+7.5% YoY), ordinary income was ¥5,278 million (+6.0% YoY), and net income was ¥5,269 million (+6.0% YoY).
- Net income per unit was ¥2,259 (+3.3% YoY), and distribution per unit was ¥2,102 (vs. ¥6,115 in the prior period).
- Total assets stood at ¥356,406 million, net assets at ¥161,748 million, and the equity ratio at 45.4%.
- The forecast for the January 2027 period (33rd Period) includes operating revenue of ¥13,526 million and distribution per unit of ¥2,139. The forecast for the July 2027 period (34th Period) includes operating revenue of ¥13,528 million and distribution per unit of ¥2,139.
🤖 AI Perspective
R-コンフォリア’s July 2026 fiscal results show an upward trend in key revenue and profit figures, indicating solid operational performance. The year-over-year increases in operating revenue and net income may reflect efficient asset management and favorable conditions in the rental market. Furthermore, the positive outlook for future operating performance, alongside the distribution per unit post-investment unit split, will be key areas for investors to monitor.
3441|山王
2695.0
▼ -2.28%
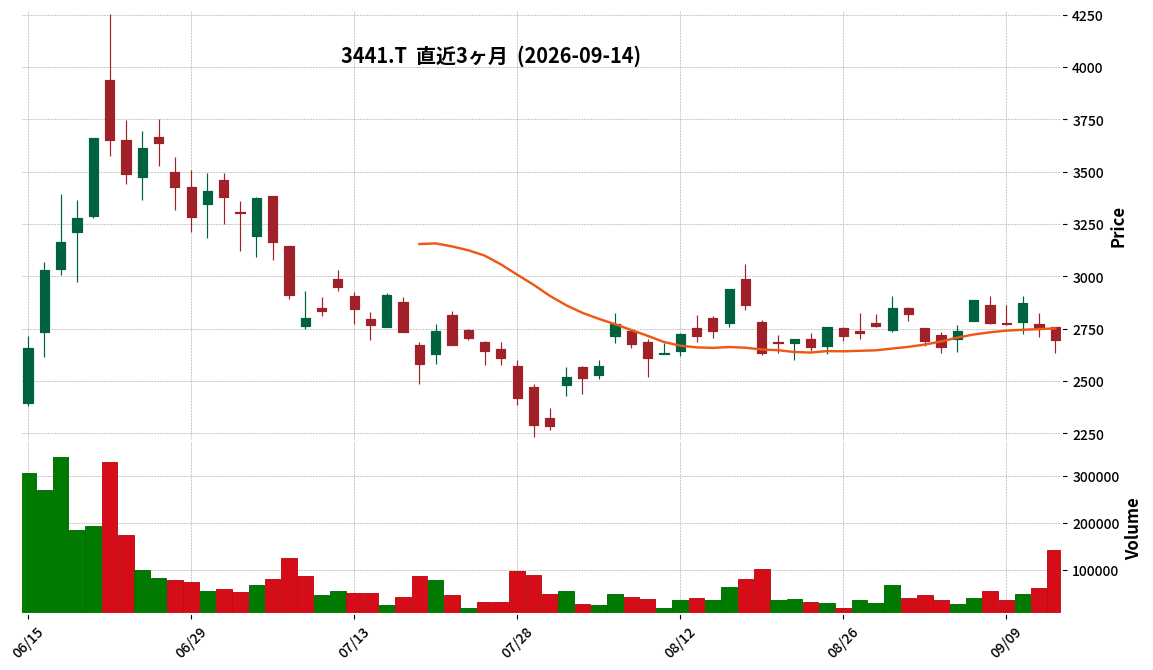
This article is an AI-generated summary and analysis of official IR disclosures.
📄 Announcement (AI-Reviewed)
- Sanno Co., Ltd. resolved to pay a year-end dividend (increased dividend) for the fiscal year ending July 2026, with a record date of July 31, 2026, at its Board of Directors meeting on September 14, 2026.
- The dividend per share was revised from the previously announced forecast of ¥25.00 (announced on June 12, 2026) to ¥45.00.
- The total dividend amount is ¥190 million.
- For the previous fiscal year (ended July 2025), the dividend per share was ¥22.00, and the total dividend amount was ¥95 million.
- The effective date for the dividend payment is October 30, 2026, with the source of funds being retained earnings.
- This dividend is scheduled to be submitted for approval at the 68th Ordinary General Meeting of Shareholders, expected to be held on October 29, 2026.
🤖 AI Perspective
Sanno’s decision to significantly increase its dividend for the fiscal year ending July 2026, surpassing both the previous year’s actual dividend and its most recent forecast, may suggest a strong consideration of current business performance and future management environment. This move aligns with the company’s policy to strive for stable dividend payments while balancing long-term corporate value and strengthening its corporate structure. Investors may focus on how this increased dividend could impact the company’s dividend yield.
4431|G-スマレジ
3345.0
▲ +2.45%
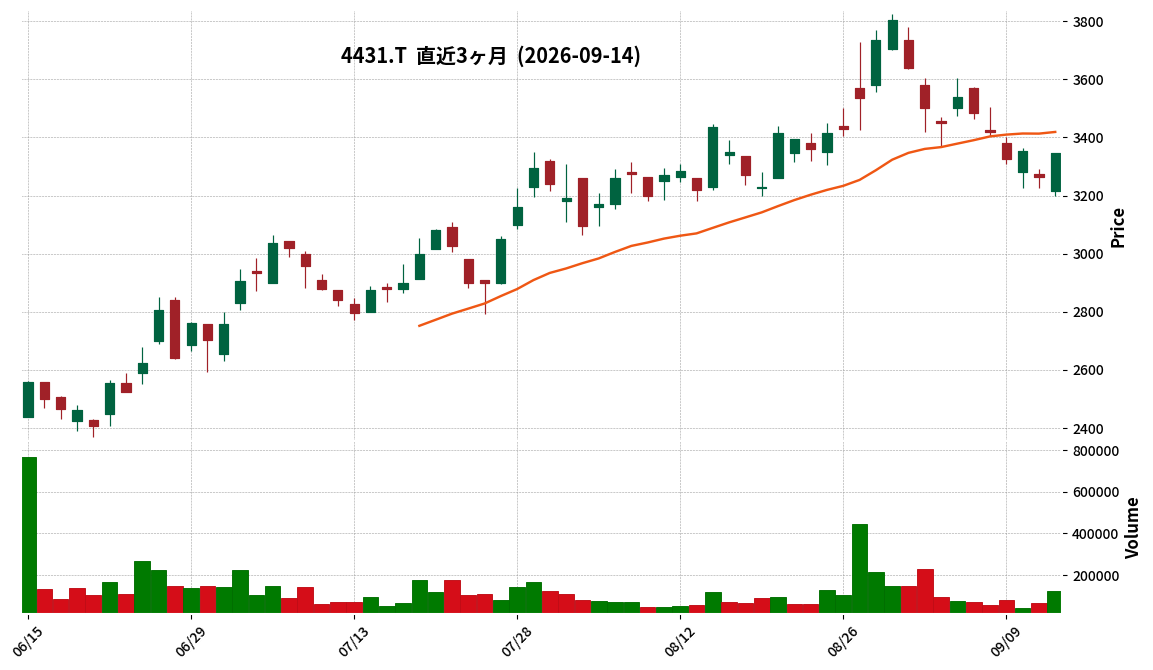
This article is an AI-generated summary and analysis of official IR disclosures.
📄 Announcement (AI-Reviewed)
- For the first quarter of FY2027 (May 1, 2026, to July 31, 2026), consolidated net sales totaled ¥3,608 million, marking a 19.7% increase year-over-year.
- Consolidated operating profit for the same period was ¥1,027 million (up 73.3% YoY), ordinary profit was ¥1,022 million (up 71.8% YoY), and net profit attributable to parent company shareholders was ¥683 million (up 77.4% YoY).
- Annual Recurring Revenue (ARR) reached ¥11,589 million as of July 31, 2026. This includes Smaregi usage fees ¥7,203 million, cashless payments ¥2,754 million, time cards ¥863 million, and EC-related services ¥769 million.
- The number of paid plan registered stores stood at 49,952 as of July 31, 2026, an increase of 1,655 stores from April 30, 2026.
- The full-year consolidated earnings forecast for FY2027 remains unchanged, projecting net sales of ¥15,387 million (up 15.3% from previous year) and operating profit of ¥4,004 million (up 24.5% from previous year).
🤖 AI Perspective
G-Smaregi’s Q1 FY2027 results show significant year-over-year increases across revenue and all profit metrics. This strong performance appears to be driven by robust growth in recurring monthly fees and a shift in the revenue structure towards higher-margin monthly fees, coupled with cost reductions in the cashless payment business. The steady increase in paid plan registered stores and ARR suggests a strengthening of the company’s stable revenue base moving forward.
588A|S-アットマークテク
—
▲ +0.00%
📎 Source:S-アットマークテク Official IR →
This article is an AI-generated summary and analysis of official IR disclosures.
📄 Announcement (AI-Reviewed)
- S-ATMARK TECHNIC announced its non-consolidated financial results for the fiscal year ended July 2026.
- Net sales were 1,863 million yen (up 0.1% year-on-year), operating profit was 90 million yen (up 38.3%), ordinary profit was 65 million yen (up 29.3%), and net profit was 57 million yen (up 52.6%).
- Earnings per share (EPS) were 69.21 yen.
- For the fiscal year ending July 2027, the company forecasts net sales of 2,971 million yen (up 59.4% year-on-year), operating profit of 170 million yen (up 88.3%), ordinary profit of 101 million yen (up 54.7%), net profit of 62 million yen (up 8.0%), and EPS of 74.74 yen.
- During the current fiscal year, while net sales remained flat due to the postponement of planned projects to the next fiscal year, the company increased profits by reducing selling, general, and administrative expenses.
🤖 AI Perspective
S-ATMARK TECHNIC’s FY2026 results indicate a notable increase in profits despite flat sales, primarily driven by reduced selling, general, and administrative expenses. The company’s FY2027 forecast projects substantial growth across sales and profits, with particularly high anticipated increases of 59.4% for net sales and 88.3% for operating profit. This robust outlook may suggest the expected realization of postponed projects from the current year, alongside potential strategic successes in adapting to the evolving business environment, which could be a key focus for investors.
6309|巴工業
2017.0
▲ +0.75%
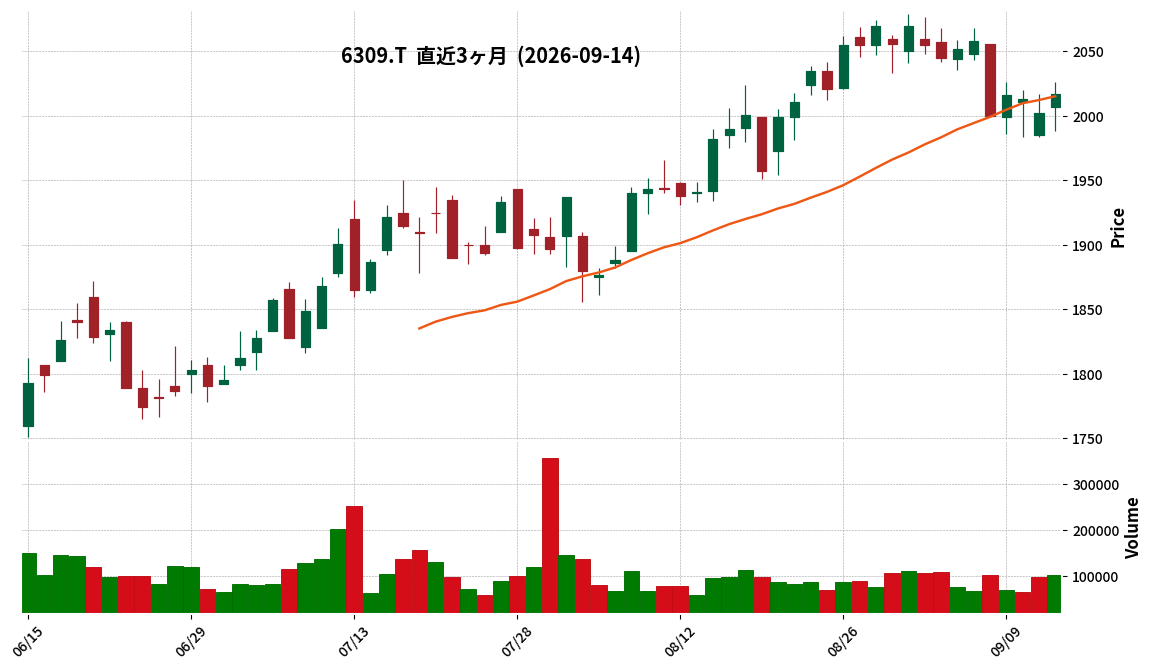
This article is an AI-generated summary and analysis of official IR disclosures.
📄 Announcement (AI-Reviewed)
- Tomo-e Engineering reported consolidated net sales of ¥46,805 million for the third quarter of FY2026 (November 1, 2025 – July 31, 2026), an increase of 0.9% year-on-year.
- Operating profit was ¥4,713 million (down 1.9% YoY), and ordinary profit was ¥4,841 million (down 0.3% YoY).
- Net income attributable to owners of parent increased by 5.0% year-on-year to ¥3,524 million, driven by foreign exchange translation adjustment reversal gains from the liquidation of a Chinese subsidiary and gains on sale of policy-held shares.
- Basic earnings per share for the quarter stood at ¥119.75 (adjusted for the stock split effective May 1, 2025).
- The full-year consolidated earnings forecast (net sales ¥62,900 million, operating profit ¥5,900 million, ordinary profit ¥6,000 million, net income attributable to owners of parent ¥4,400 million) remains unchanged from the most recently announced forecast.
🤖 AI Perspective
Tomo-e Engineering’s Q3 results show a slight increase in net sales but a modest decline in operating and ordinary profits. The rise in net income attributable to owners of parent appears to be supported by one-off factors. The company’s decision to maintain its full-year forecast suggests a stable outlook from management. Investors may note that strong performance in the chemical industry products sales segment helped offset a decrease in the machinery manufacturing and sales business, which impacted overall profitability.
7050|G-フロンティアI
1442.0
▲ +4.12%
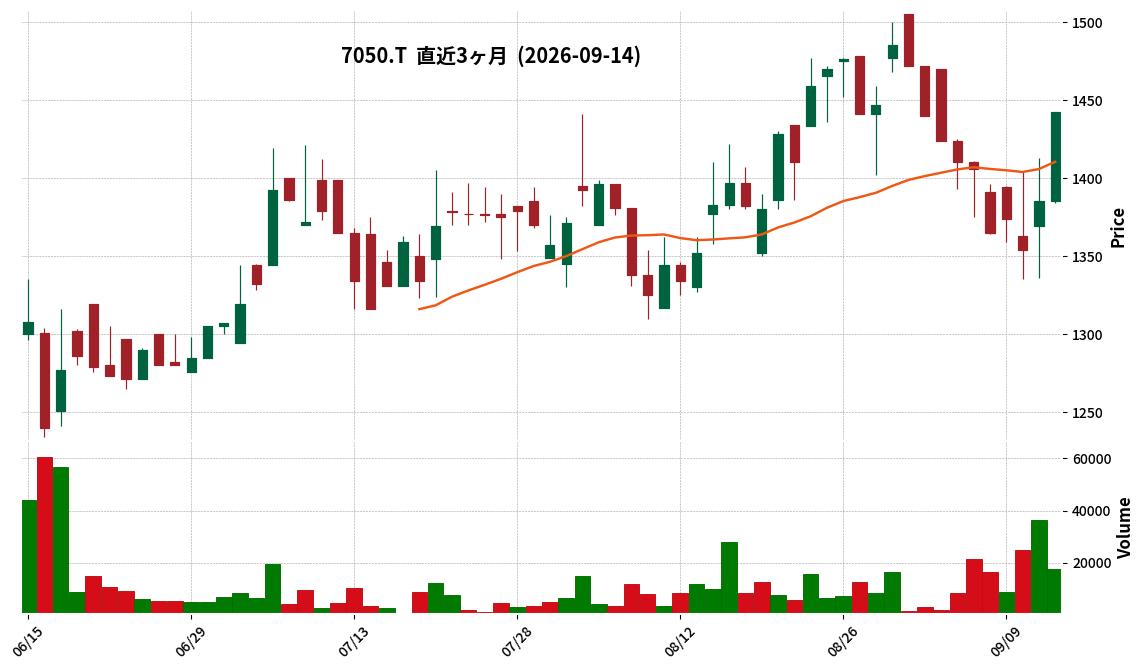
📎 Source:G-フロンティアI Official IR →
This article is an AI-generated summary and analysis of official IR disclosures.
📄 Announcement (AI-Reviewed)
- Frontier International Inc. announced its consolidated financial results for the first quarter of the fiscal year ending April 2027 (May 1, 2026 – July 31, 2026).
- Net sales amounted to ¥7,412 million, representing a 30.2% increase compared to the same period of the previous fiscal year.
- Operating income reached ¥562 million, marking a 134.4% increase year-on-year.
- Ordinary income was ¥578 million (+140.0% YoY), and net income attributable to owners of the parent was ¥333 million (+132.4% YoY).
- The equity ratio improved to 59.8% (from 58.6% at the end of the previous consolidated fiscal year).
- The full-year consolidated earnings forecast remains unchanged from the announcement made in the financial report dated June 15, 2026.
🤖 AI Perspective
G-Frontier I’s Q1 results show substantial growth across all key financial metrics, suggesting a robust performance driven by strong demand for real-life experiences such as events. The company highlighted continuous large-scale order receipts from clients in the food, retail/home appliance, and game/IP sectors, which appears to be a primary growth driver. The improvement in the equity ratio could also indicate a strengthened financial position.
7811|中本パックス
1945.0
▲ +0.41%
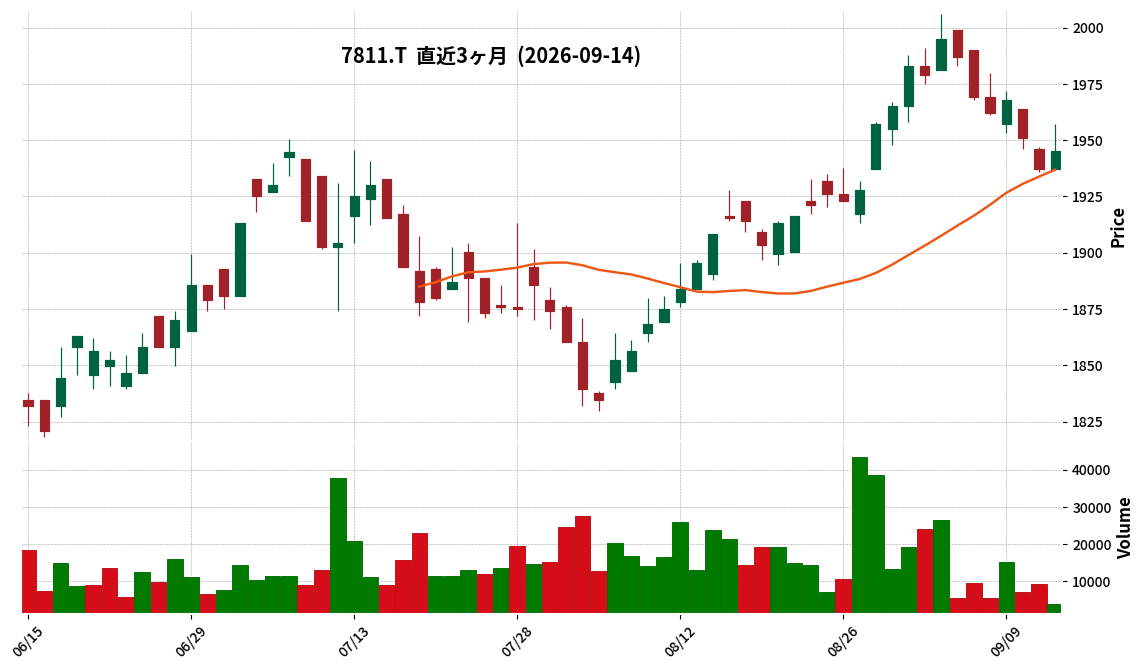
This article is an AI-generated summary and analysis of official IR disclosures.
📄 Announcement (AI-Reviewed)
- Nakamoto Packs announced on September 14, 2026, an upward revision to its consolidated earnings forecast for the second quarter (interim) and full fiscal year ending February 2027.
- The revised consolidated earnings forecast for the second quarter of FY2027 includes Net Sales of JPY 28,000 million (up 9.8% from previous forecast), Operating Income of JPY 2,400 million (up 55.0%), Ordinary Income of JPY 2,480 million (up 50.1%), and Net Income Attributable to Owners of Parent of JPY 1,600 million (up 50.7%).
- The revised consolidated full-year earnings forecast for FY2027 includes Net Sales of JPY 55,000 million (up 5.8% from previous forecast), Operating Income of JPY 3,874 million (up 18.7%), Ordinary Income of JPY 4,000 million (up 15.9%), and Net Income Attributable to Owners of Parent of JPY 2,566 million (up 17.5%).
- Reasons for the revision for the second quarter include the pass-through of rising raw material costs to sales prices, increased sales of paper-related products and top seals, and an increase in workload due to expanding demand in the semiconductor and electronic components markets.
- Factors contributing to the increase in operating income include higher sales, successful cost reduction measures such as improved production efficiency and reduced ink usage, and an improved profit margin due to changes in product mix within the IT and industrial materials segments.
🤖 AI Perspective
This upward revision appears to be a result of multiple positive factors across various business activities. Notably, the expansion of demand in the semiconductor and electronic components market seems to be driving sales, while corporate efforts like sales price adjustments and production efficiency improvements are contributing to enhanced profitability. Moving forward, the company’s response to potential concerns such as prolonged Middle East instability and the stabilization of accelerated orders, alongside the continuation of profitability improvement initiatives, will be worth monitoring.
8894|REVOLUTION
21.0
▲ +5.00%
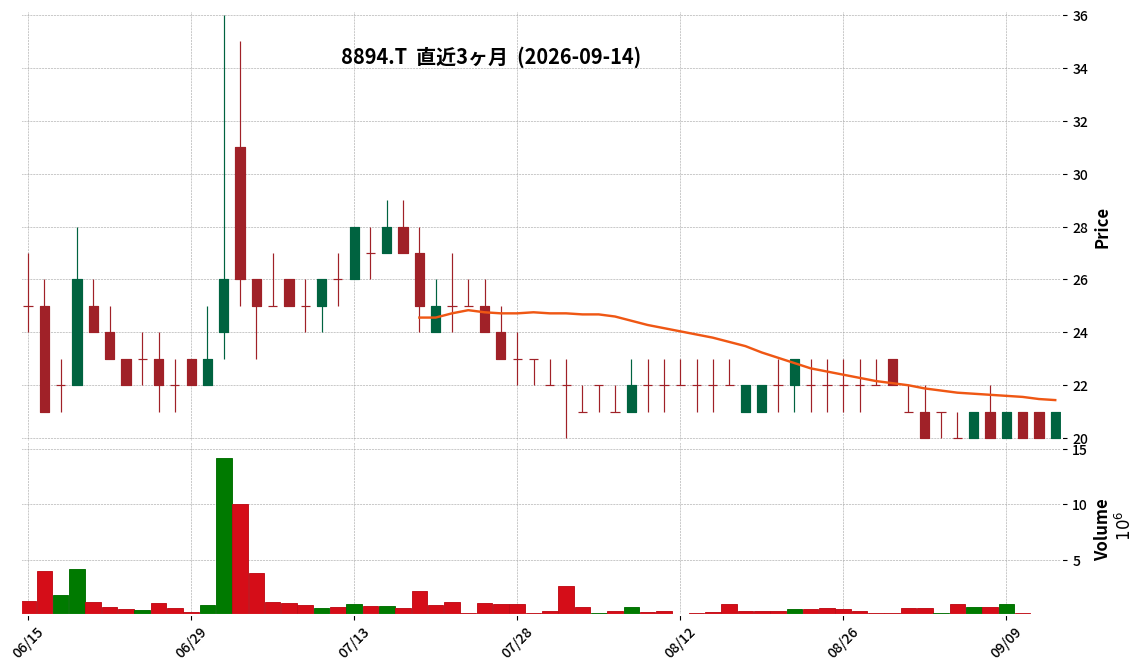
📎 Source:REVOLUTION Official IR →
This article is an AI-generated summary and analysis of official IR disclosures.
📄 Announcement (AI-Reviewed)
- REVOLUTION announced that the disclosure of its Q3 FY2026 consolidated financial statements will be delayed beyond 45 days after the quarter-end.
- This delay stems from the obligation to undergo an interim review by certified public accountants, following the “material weaknesses in internal controls over financial reporting” disclosed on January 29, 2026.
- An internal investigation committee for consolidated subsidiaries WeCapital Inc. and Yamawake Estate Inc. (YE Co.) was established on June 15, 2026, and a investigation report was received on September 1, 2026.
- The investigation report concluded that 28 out of 251 target funds formed by YE Co. should be appropriately accounted for as financial transactions, prompting the company to consider corrections to past securities reports.
- The company decided to postpone the announcement as completing settlement procedures and the interim review by auditors is difficult due to ongoing discussions with their auditor, Aria Audit Corporation, regarding these corrections.
- The postponed release date is currently anticipated to be within October 2026, with an immediate announcement to follow once a definitive date is set.
🤖 AI Perspective
The delay in REVOLUTION’s Q3 earnings release suggests ongoing challenges related to its previously disclosed material weaknesses in internal controls, compounded by the time required to resolve accounting treatment concerns at its consolidated subsidiaries. The continuous discussions with their audit firm indicate a process underway to ensure accurate financial reporting. Investors may closely monitor the progress of these rectification efforts and the content of the eventual earnings announcement.
9237|G-笑美面
981.0
▼ -1.80%
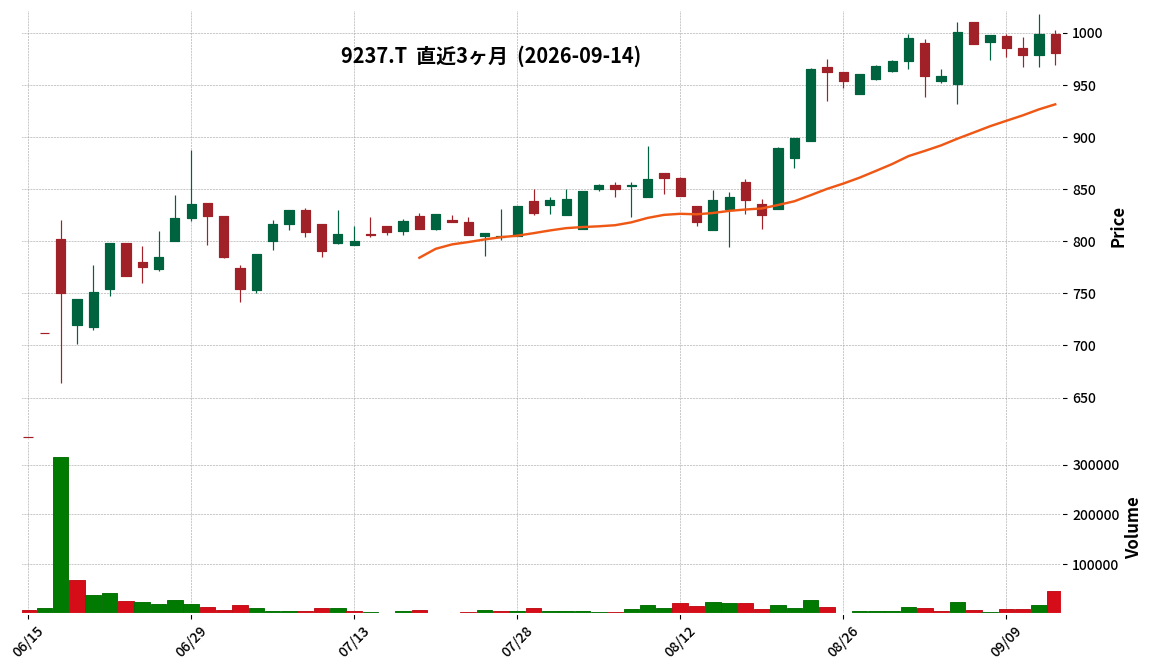
This article is an AI-generated summary and analysis of official IR disclosures.
📄 Announcement (AI-Reviewed)
- G-Emimen has announced its financial results for the third quarter of the fiscal year ending October 2026 (May-July 2026).
- Operating revenue for the quarter was ¥616 million, a 40.0% increase year-over-year.
- Operating profit turned black at ¥57 million, compared to a loss of ¥11 million in the same period last year. Ordinary profit also turned black at ¥54 million.
- By segment, Senior Life Support reported operating revenue of ¥525 million (up 37.6% YoY), and Senior Home Consulting reported ¥90 million (up 55.2% YoY).
- The number of family conferences conducted by Senior Life Support was 2,861 (up 26.5% YoY), and the number of “Smiles” (contracts) was 1,601 (up 35.6% YoY).
- Senior Home Consulting added 376 newly opened rooms (up 47.5% YoY), bringing the cumulative total to 3,451 rooms.
- Starting from the fourth quarter of FY2026, the care-mix business will be included in the profit and loss statement.
- The full-year earnings forecast remains unchanged.
🤖 AI Perspective
G-Emimen’s third-quarter results for FY2026 show significant year-over-year revenue and profit growth, marking a return to profitability. This performance appears to be driven by the strong growth in the Senior Life Support segment and improved productivity from addressing organizational challenges. While conventional new facility opening support within Senior Home Consulting faced headwinds due to rising construction material costs and interest rates, the increasing demand for partner leases could be a key factor for future revenue contribution. Investors may wish to monitor how the consolidation of the care-mix business from Q4 will impact overall performance.
6838|多摩川HD
1503.0
▼ -1.51%
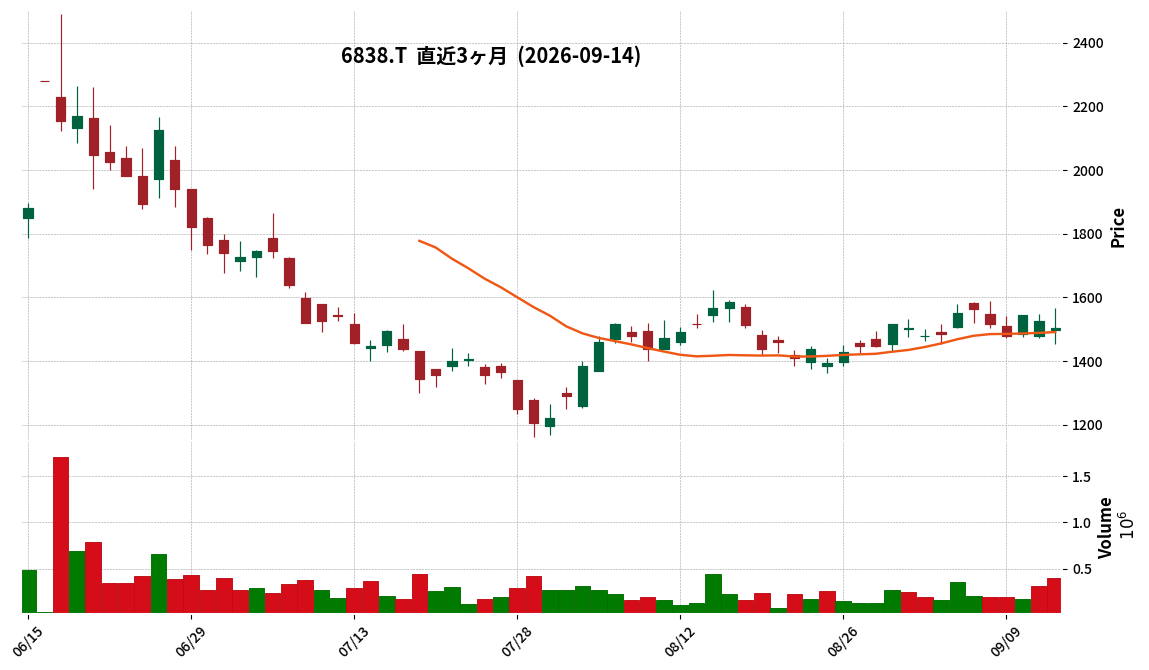
This article is an AI-generated summary and analysis of official IR disclosures.
📄 Announcement (AI-Reviewed)
- Tamagawa Holdings Co., Ltd. announced its consolidated financial results for the third quarter of the fiscal year ending October 2026 (November 1, 2025 – July 31, 2026).
- Consolidated revenue was ¥5,302 million, representing a 35.8% increase compared to the same period of the previous fiscal year.
- Operating profit reached ¥928 million (up 453.7% year-on-year), and profit attributable to owners of the parent was ¥1,950 million (up 1,096.3% year-on-year).
- Basic earnings per share were ¥248.33, and diluted earnings per share were ¥229.76.
- The full-year consolidated earnings forecast (revenue ¥6,950 million, profit attributable to owners of parent ¥1,835 million) and the annual dividend forecast (¥10.00 per share) remain unchanged.
- The company applied International Financial Reporting Standards (IFRS) from the first quarter of the current consolidated fiscal year.
🤖 AI Perspective
Tamagawa HD’s third-quarter results for FY2026 show substantial growth in revenue and all profit categories compared to the prior year. The significant increase in profit attributable to owners of the parent may be influenced by unrealized gains on foreign stocks held by an overseas subsidiary, which are included in financial income for the period. Given that the full-year forecast remains unchanged, investors might want to observe how the company’s performance evolves in the final quarter.
4446|Link-Uグループ
908.0
▼ -1.30%
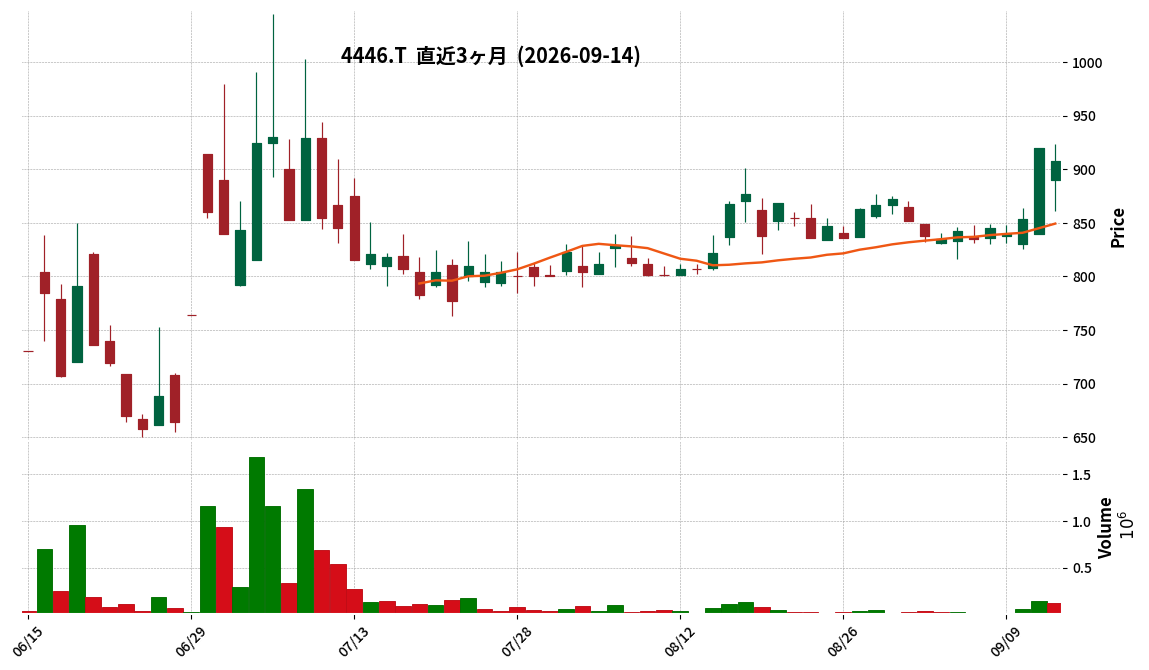
📎 Source:Link-Uグループ Official IR →
This article is an AI-generated summary and analysis of official IR disclosures.
📄 Announcement (AI-Reviewed)
- Link-U Group announced its consolidated financial results for the fiscal year ended July 2026, with revenue of ¥4,800 million, a decrease of 0.7% year-on-year.
- Operating profit was ¥(382) million (compared to ¥326 million in the previous period), and profit before tax was ¥(380) million (compared to ¥308 million).
- Profit attributable to owners of the parent was a loss of ¥(554) million (compared to ¥147 million in the previous period).
- For the fiscal year ending July 2027, the consolidated performance forecast projects revenue of ¥4,000-¥4,200 million and profit attributable to owners of the parent of ¥241-¥293 million.
- Dividends for both FY2026 and FY2027 (forecast) are ¥0.00 per share.
🤖 AI Perspective
Link-U Group’s FY2026 results indicate a slight decline in revenue and a shift to losses across all profit metrics, which may suggest a significant deterioration in profitability compared to the prior year. However, the company has provided a forecast for FY2027 expecting a return to profitability despite a projected decrease in revenue, indicating potential strategic shifts or anticipated improvements in business efficiency. Investors may wish to monitor the company’s progress in implementing these changes and improving its financial performance.
5598|P-Yottavia
3200.0
▲ +0.00%
📎 Source:P-Yottavia Official IR →
This article is an AI-generated summary and analysis of official IR disclosures.
📄 Announcement (AI-Reviewed)
- P-Yottavia’s H1 FY2027 (February 1, 2026 – July 31, 2026) sales were ¥415 million, a 3.2% decrease compared to the same period last year.
- The company reported an operating loss of ¥35 million (vs. ¥219 thousand profit in prior year), an ordinary loss of ¥36 million (vs. ¥9.77 million profit in prior year), and a net loss of ¥23 million (vs. ¥6.39 million profit in prior year).
- Diluted EPS for the interim period was ¥-61.78.
- Total assets stood at ¥440 million (down ¥18 million from previous fiscal year-end), net assets at ¥136 million (down ¥36 million from previous fiscal year-end), and the equity ratio was 30.9%.
- The full-year forecast remains unchanged: sales of ¥1,708 million (up 95.6% YoY), operating profit of ¥33 million (up 383.3% YoY), ordinary profit of ¥17 million (down 8.2% YoY), and net profit of ¥9 million (down 25.2% YoY).
🤖 AI Perspective
P-Yottavia’s interim results show a decline in sales and reported losses across operating, ordinary, and net income metrics. This appears to be influenced by revised IT investments from some existing clients, intensified competition, and delayed revenue recognition from large projects in the existing business, compounded by upfront investments in the new live camera business. While the full-year forecast projects significant revenue and profit growth, the company’s ability to transition from the current losses to profitability will be a key area for investors to monitor.
7098|P-エージェント
—
▲ +0.00%
📎 Source:P-エージェント Official IR →
This article is an AI-generated summary and analysis of official IR disclosures.
📄 Announcement (AI-Reviewed)
- P-Agent Co., Ltd. announced its interim financial results for the first half of FY2027 (February 1, 2026 – July 31, 2026).
- Consolidated net sales reached ¥3,233 million, representing a 3.2% increase compared to the prior year period.
- Operating profit was ¥22 million (down 77.7% year-on-year), and ordinary profit was ¥10 million (down 89.3% year-on-year).
- The company reported a net loss attributable to owners of the parent of ¥7 million, a decline from a net profit of ¥47 million in the same period last year.
- Full-year consolidated forecasts remain unchanged: net sales of ¥7,200 million (up 13.1%), operating profit of ¥167 million (up 7.1%), ordinary profit of ¥158 million (up 7.0%), and net profit attributable to owners of the parent of ¥100 million (up 30.4%). The annual dividend forecast is also maintained at ¥6.00 per share.
9223|G-ASNOVA
426.0
▲ +1.19%
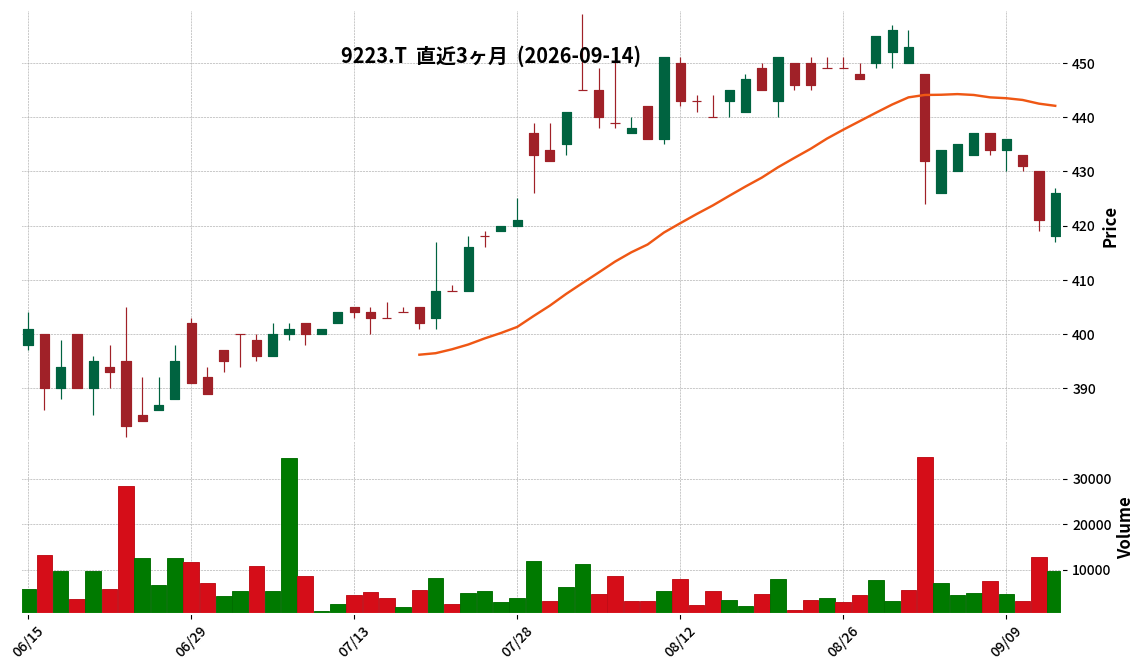
📎 Source:G-ASNOVA Official IR →
This article is an AI-generated summary and analysis of official IR disclosures.
📄 Announcement (AI-Reviewed)
- ASNOVA Co., Ltd. has resolved to terminate its current shareholder benefit program, “ASNOVA Premium Shareholder Benefit Club,” with the last benefit distribution based on the record date of September 30, 2026.
- The company plans to transition to a holding company structure, establishing “ASNOVA Companies Inc.” as the holding company through a sole share transfer, effective October 1, 2026.
- The company has decided on a policy to introduce a new shareholder benefit program, “ASNOVA×monotomoi Gift,” by the holding company, with the first record date scheduled for March 31, 2027.
- Under the proposed new system, benefit distribution will change from twice a year to once a year (March 31), and eligible shareholders will generally be those holding 1,000 shares or more continuously for at least one year (a transitional measure will apply for the first record date).
- The proposed gift content is the “ASNOVA×monotomoi” Gift, with an estimated value of JPY 5,000 for shareholders holding 1,000 to 4,999 shares, and JPY 10,000 for those holding 5,000 shares or more.
🤖 AI Perspective
G-ASNOVA is revamping its shareholder benefit program in conjunction with its transition to a holding company structure. The termination of the existing program and the introduction of a new one may suggest a strategic shift towards prioritizing growth investments. The new program’s emphasis on continuous shareholding and higher minimum share requirements appears to aim at fostering long-term shareholder relationships.
Disclaimer: This article is for informational purposes only and does not constitute investment advice.
3930|G-はてな
775.0
▼ -3.00%
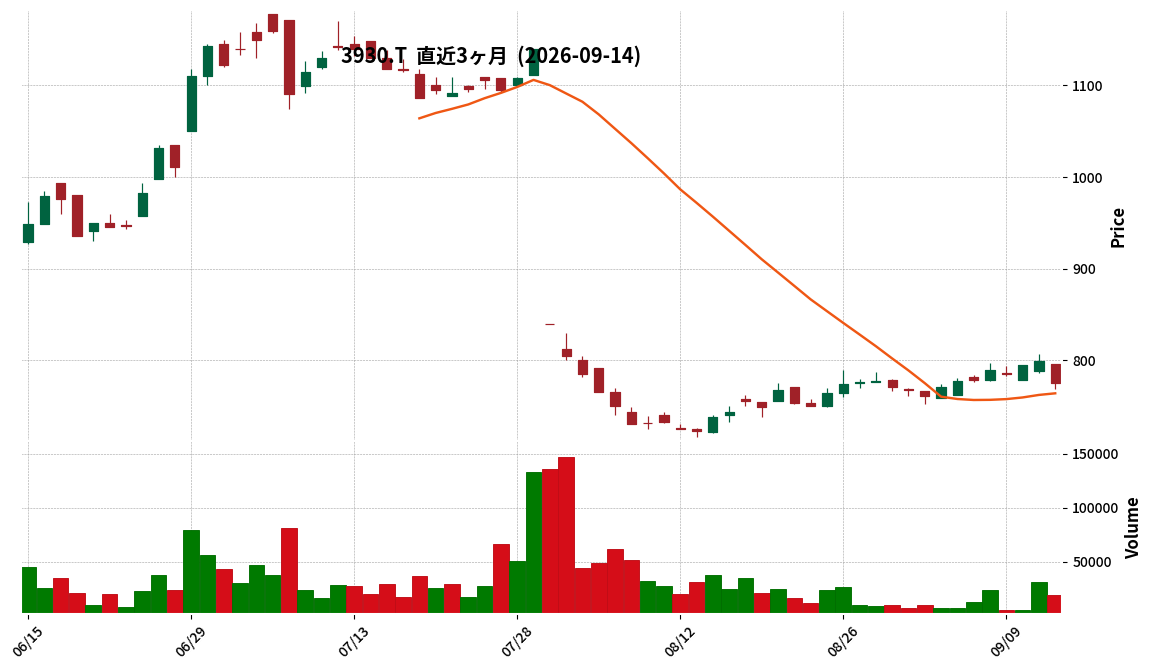
This article is an AI-generated summary and analysis of official IR disclosures.
📄 Announcement (AI-Reviewed)
- Hatena Co., Ltd. announced “Summary of Q&A session from the Full-Year FY2026 Earnings Call” on September 14, 2026.
- This Q&A summary compiles key questions and answers from the earnings call held on Friday, September 11, 2026.
- Regarding questions about partnership revenue with generative AI vendors, the company stated that details of individual initiatives and specific contract terms are confidential due to non-disclosure agreements.
- It was stated that disclosures would be made appropriately when progress on these initiatives reaches a stage where information can be released.
- The value of fresh and diverse primary information generated on Hatena’s UGC platform is recognized as having significant potential to contribute to mid-to-long-term business growth and corporate value enhancement.
- However, specific monetary figures are not definitively incorporated into the current earnings forecast, and the company intends to pursue revenue generation through future discussions and initiatives.
🤖 AI Perspective
This announcement highlights G-Hatena’s engagement in partnerships within the generative AI sector. While specific revenue contributions are currently undisclosed due to confidentiality agreements, the company’s recognition of the potential value of its UGC platform for long-term growth could be a key factor for future business developments. The absence of specific figures in the current earnings forecast suggests that investors may need to monitor future progress and disclosures closely for more definitive financial impacts.
4378|G-CINC
462.0
▼ -9.77%
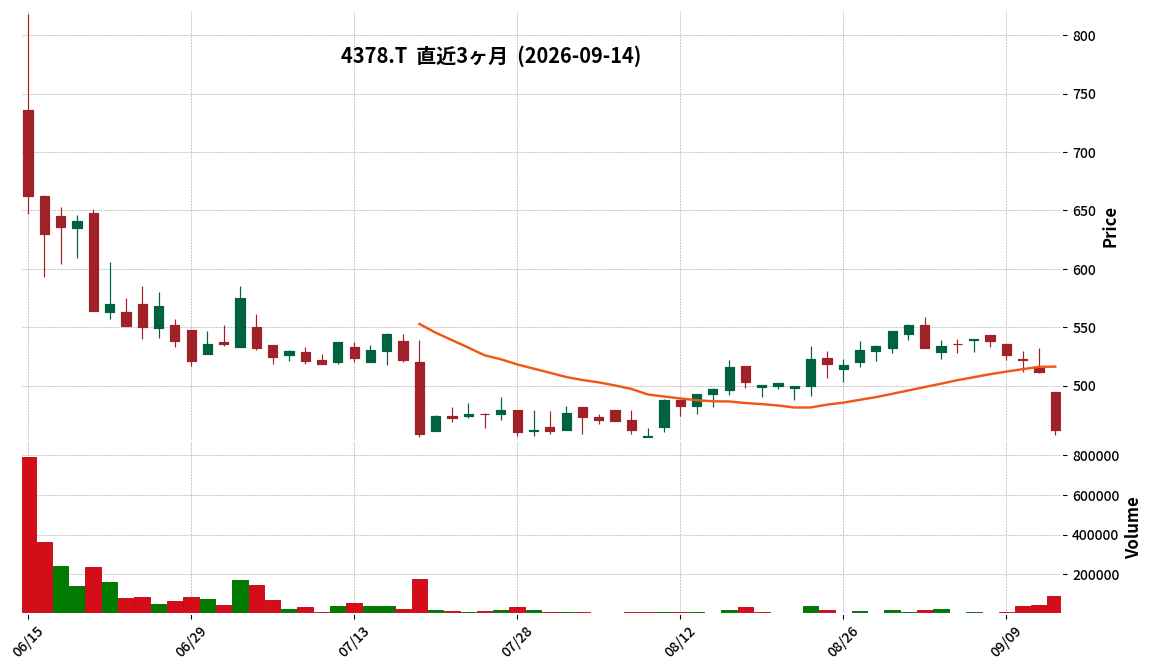
This article is an AI-generated summary and analysis of official IR disclosures.
📄 Announcement (AI-Reviewed)
- On September 14, 2026, G-CINC resolved at its Board of Directors meeting to absorb its wholly-owned subsidiary, CINC Capital, through an absorption-type merger.
- G-CINC will be the surviving company, and CINC Capital will be the absorbed company and subsequently dissolved.
- The Board of Directors approved the merger and signed the merger agreement on September 14, 2026, with the effective date of the merger scheduled for November 1, 2026.
- Prior to the merger, G-CINC plans to waive a portion of its claims against CINC Capital to resolve CINC Capital’s state of insolvency.
- Following the effective date of the merger (November 1, 2026), G-CINC will transition from consolidated financial statements to non-consolidated financial statements starting from the Q1 financial results for the October 2027 fiscal year.
🤖 AI Perspective
This announcement appears to be a corporate reorganization aimed at enhancing group management efficiency, accelerating decision-making, and reducing administrative costs. The transition to non-consolidated financial statements following the merger of a wholly-owned subsidiary could indicate a shift in the company’s operational structure or reporting focus. The debt waiver before the merger may suggest a strategic move to optimize the subsidiary’s financial health prior to integration.
4380|G-Mマート
712.0
▲ +3.49%
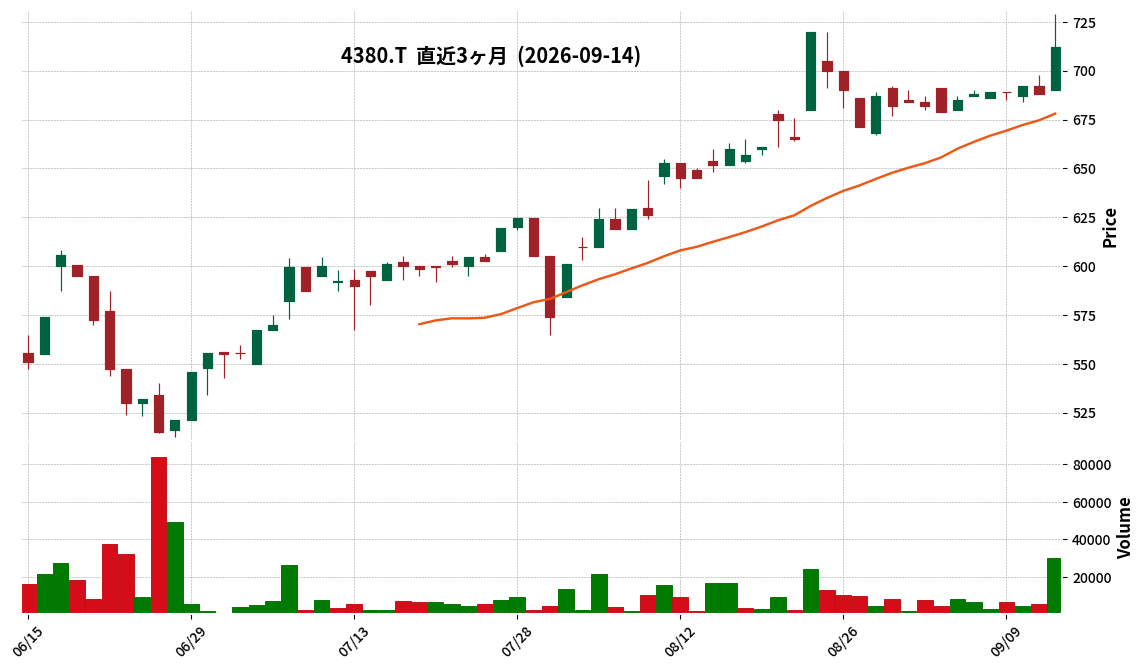
This article is an AI-generated summary and analysis of official IR disclosures.
📄 Announcement (AI-Reviewed)
- G-Mマート reported sales of ¥752 million for the second quarter of the fiscal year ending January 2027 (February 1, 2026 – July 31, 2026), marking an 11.7% increase year-over-year.
- Operating profit reached ¥370 million (up 21.8% year-over-year), ordinary profit was ¥373 million (up 22.5% year-over-year), and quarterly net profit was ¥252 million (up 28.9% year-over-year).
- Diluted earnings per share for the quarter were ¥25.78 (adjusted for the stock split on August 1, 2026).
- Total assets stood at ¥3,346 million, net assets at ¥2,264 million, and the equity ratio was 67.7%.
- The full-year forecast remains unchanged, projecting sales of ¥1,473 million (up 8.4% from the previous fiscal year), operating profit of ¥689 million (up 9.0%), net profit of ¥456 million (up 7.8%), and diluted EPS of ¥46.6 (adjusted for the stock split).
🤖 AI Perspective
G-Mart’s second-quarter performance for FY2027 shows double-digit growth across sales and various profit metrics compared to the prior year. This growth appears to be primarily driven by a 12.4% increase in the total transaction value on its online wholesale marketplace for commercial food ingredients, particularly from the “M-mart” segment. The steady increase in buyer members, up 2.3% from the end of the previous fiscal year, suggests continued strong demand for online transactions in the food industry.
Disclaimer: This article is for informational purposes only and does not constitute investment advice.
525A|P-manebi
1663.0
▲ +0.00%
📎 Source:P-manebi Official IR →
This article is an AI-generated summary and analysis of official IR disclosures.
📄 Announcement (AI-Reviewed)
- P-manebi has announced its Consolidated Financial Results (Japanese GAAP) for the fiscal year ending July 2026.
- For the consolidated results, net sales were reported at ¥〇〇 million (an increase of 〇〇% year-on-year), and operating income reached ¥〇〇 million (an increase of 〇〇% year-on-year). (Note: Specific figures replaced with 〇〇 as they were not provided in the prompt)
- Ordinary income stood at ¥〇〇 million (an increase of 〇〇% year-on-year), and profit attributable to owners of parent was ¥〇〇 million (an increase of 〇〇% year-on-year).
- Earnings per share for the period were ¥〇〇.
- No forecast for the next fiscal year was provided in this announcement.
🤖 AI Perspective
The consolidated financial results objectively present P-manebi’s business performance for the fiscal year ending July 2026. The year-on-year changes in net sales and various profit metrics are crucial indicators for assessing the company’s growth trajectory and the health of its revenue structure. For current shareholders and potential investors, these figures serve as fundamental information to understand the company’s current state.
💡 Start investing with IR insights


※ 本ページには広告が含まれます(PR)
Disclaimer: This article is for informational purposes only and does not constitute investment advice. All investment decisions are at your own risk.
コメント