
📌 Today’s Highlights
Today we cover 82 IR announcements. Notable among them: G-ルクレ (648A), トーセ (4728), G-プログリット (9560). Use the table of contents below to navigate to each company.
- 648A|G-ルクレ
- 4728|トーセ
- 9560|G-プログリット
- 3083|スターシーズ
- 1407|ウエストHD
- 3608|TSI HD
- 638A|P-ハイネス
- 6521|G-オキサイド
- 8614|東洋証
- 7065|ユーピーアール
- 5869|早稲田学習研究会
- 1430|ファーストコーポ
- 4439|東名
- 4015|G-ペイクラウドHD
- 1419|タマホーム
- 5078|セレコーポレーション
- 5817|JMACS
- 7434|オータケ
- 1452|P-横浜ライト工業
- 1887|日本国土開発
- 6150|タケダ機械
- 8167|リテールパートナーズ
- 9778|昴
- 2927|AFC-HD
- 353A|エレコミ
- 9388|Q-パパネッツ
- 190A|G-Chordia
- 198A|G-ポストプライム
- 205A|G-ロゴスHD
- 2334|G-イオレ
- 2449|プラップJ
- 274A|ガーデン
- 277A|グロービング
- 2798|Y’s
- 2934|G-Jフロンティア
- 2936|G-ベースフード
- 304A|G-フォルシア
- 3223|エスエルディー
- 325A|G-TENTIAL
- 339A|G-プログレス
- 340A|G-ジグザグ
- 3440|日創グループ
- 3548|バロック
- 3645|メディカルネット
- 367A|プリモGHD
- 3697|SHIFT
- 369A|G-エータイ
- 378A|G-ヒット
- 3810|サイバーステップHD
- 6555|MSコンサル
- 1418|インターライフ
- 245A|G-INGS
- 251A|P-ニューロマジック
- 280A|G-TMH
- 2884|ヨシムラ・F・HD
- 3266|ファンドクリG
- 3281|R-GLP
- 373A|G-リップス
- 4016|MITHD
- 414A|G-オーバーラップ
- 4197|アスマーク
- 4413|ボードルア
- 4885|室町ケミカル
- 5018|MORESCO
- 562A|P-寶結
- 6044|三機サービス
- 7035|anfac
- 7074|G-247HD
- 7610|テイツー
- 9979|大庄
- 5527|G-propetec
- 7049|G-識学
- 7578|ニチリョク
- 3557|G-U&C
- 293A|P-BABY JOB
- 3547|ユニシアHD
- 5130|P-ヒロHD
- 589A|G-ネイス
- 602A|P-レックス
- 9215|G-CaSy
- 3627|テクミラ
- 362A|P-エクシオHD
648A|G-ルクレ
—
▲ +0.00%
This article is an AI-generated summary and analysis of official IR disclosures.
📄 Announcement (AI-Reviewed)
- G-LUCRE Inc. was listed on the Tokyo Stock Exchange Growth Market on October 15, 2026.
- The company forecasts (non-consolidated) for the fiscal year ending September 2026: net sales of JPY 3,473 million (up 19.0% YoY), operating profit of JPY 688 million (up 108.6% YoY), ordinary profit of JPY 701 million (up 105.4% YoY), and net profit of JPY 464 million (up 105.3% YoY).
- For the fiscal year ending September 2027, the company forecasts (non-consolidated): net sales of JPY 4,177 million (up 20.3% YoY), operating profit of JPY 1,212 million (up 76.2% YoY), ordinary profit of JPY 1,212 million (up 72.7% YoY), and net profit of JPY 792 million (up 70.9% YoY).
- Dividends per share are projected at JPY 8.00 for FY2026/9 and JPY 24.00 for FY2027/9.
- The company’s primary business is the “Record DX Platform Business,” which operates in three areas: “Construction Record Domain (Kuraemon),” “Growth Record Domain (Minna no Shashayasan),” and “Maintenance Record Domain (AITURBO).”
🤖 AI Perspective
The announced performance forecasts indicate significant growth in both sales and profits for both the fiscal years ending September 2026 and 2027, with operating profit showing over 100% projected growth. This substantial increase may be attributed to the expansion of recurring revenue from the flagship “Kuraemon Premium” and the ongoing promotion of migration to cloud services. The performance of the newly launched “Maintenance Record Domain” could also be a key growth driver to monitor.
4728|トーセ
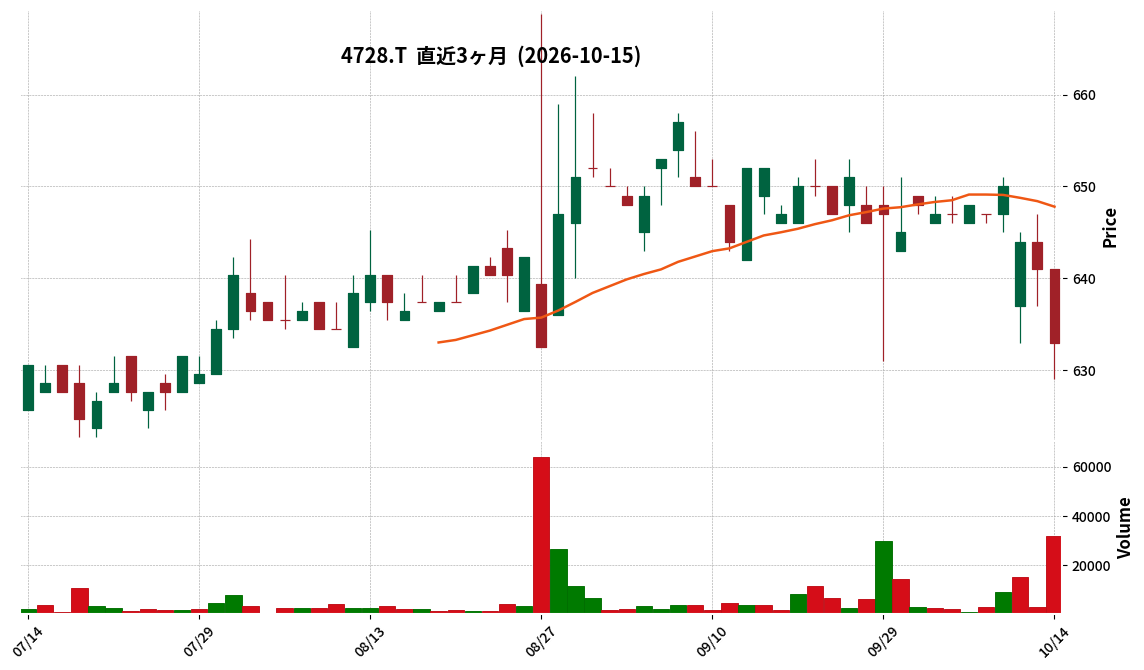
633.0
▼ -1.25%
This article is an AI-generated summary and analysis of official IR disclosures.
📄 Announcement (AI-Reviewed)
- For the fiscal year ended August 2026, net sales were ¥6,316 million (down 4.8% year-on-year), and operating profit was ¥284 million (down 58.8% year-on-year).
- Net profit attributable to owners of parent was ¥717 million (up 186.7% year-on-year), mainly due to an extraordinary gain of approximately ¥750 million from the rebuilding of the Nagaokakyo Tose Building.
- In the game business, a large-scale overseas project was temporarily suspended during the fiscal year (restart date undetermined), leading to a decline in gross profit margin.
- The forecast for the fiscal year ending August 2027 anticipates net sales of ¥6,000 million (down 5.0% year-on-year) and operating profit of ¥415 million (up 45.9% year-on-year).
- The dividend forecast for FY2027 is ¥25 per share (interim dividend ¥12.5, year-end dividend ¥12.5), with a payout ratio of 67.7%.
🤖 AI Perspective
TOSE’s consolidated performance for the fiscal year ended August 2026 saw a decline in sales and operating profit, primarily due to the temporary suspension of a major overseas game project. However, an extraordinary gain from the rebuilding of the Nagaokakyo Tose Building significantly boosted net profit. The company’s forecast for FY2027 projects a decrease in sales due to the completion of key game projects, but anticipates an increase in operating profit driven by improved capacity utilization and reduced outsourcing costs, suggesting a focus on profitability enhancement.
9560|G-プログリット
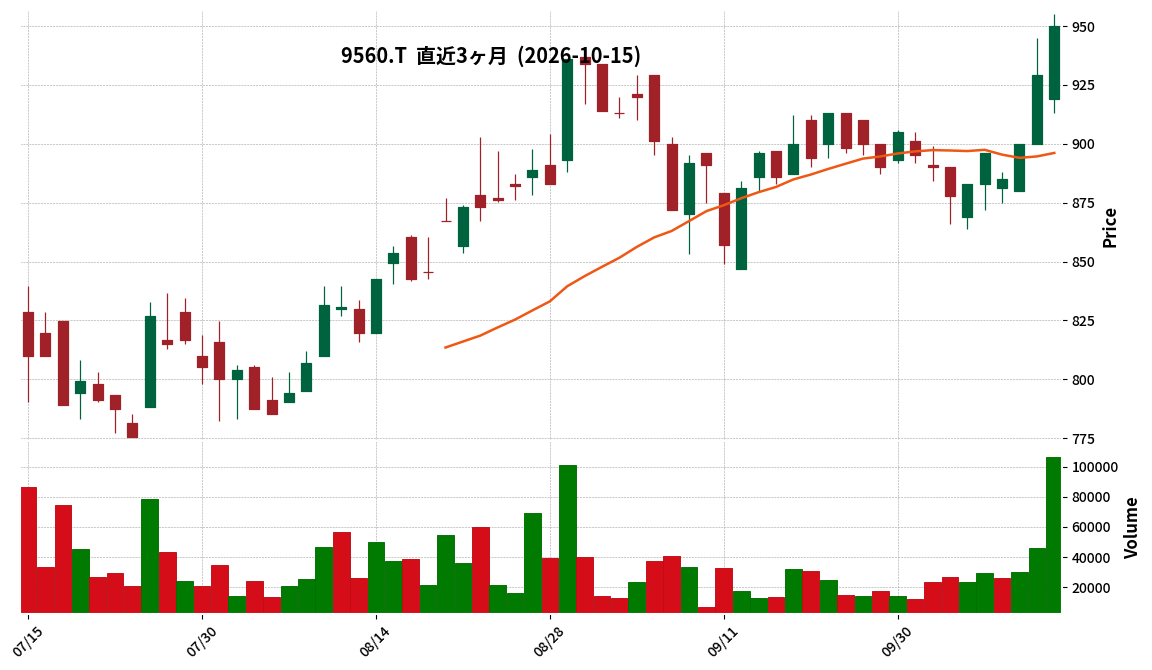
950.0
▲ +2.26%
📎 Source:G-プログリット Official IR →
This article is an AI-generated summary and analysis of official IR disclosures.
📄 Announcement (AI-Reviewed)
- The company clarified the discrepancy between the Q4 FY2026 sales of ¥2.5 billion and the FY2027 sales forecast of ¥9.5 billion, stating it was due to the transition to consolidated financials and the concentration of English Company’s sales in Q4. The actual Q4 (June-August) sales were revised to ¥2.262 billion.
- For children’s English learning services, a long-term approach is envisioned rather than short-term intensive courses, with competitors identified as English conversation schools and cram schools. Education solely focused on enjoyment of English is not currently a target area.
- New market entry will be explored through both M&A and in-house service development. In-house development will proceed in parallel, as M&A requires a willing counterparty.
- The impact of AI progress is viewed as largely positive, with significant product evolution (English conversation, curriculum customization) expected, while negative impacts are considered minimal.
- Regarding the goal of ¥100 billion in sales by 2035, the company stated that ¥50 billion from M&A and ¥50 billion from organic growth is a realistic target. The strategy involves gaining experience with realistically sized M&A deals before pursuing larger acquisitions.
3083|スターシーズ
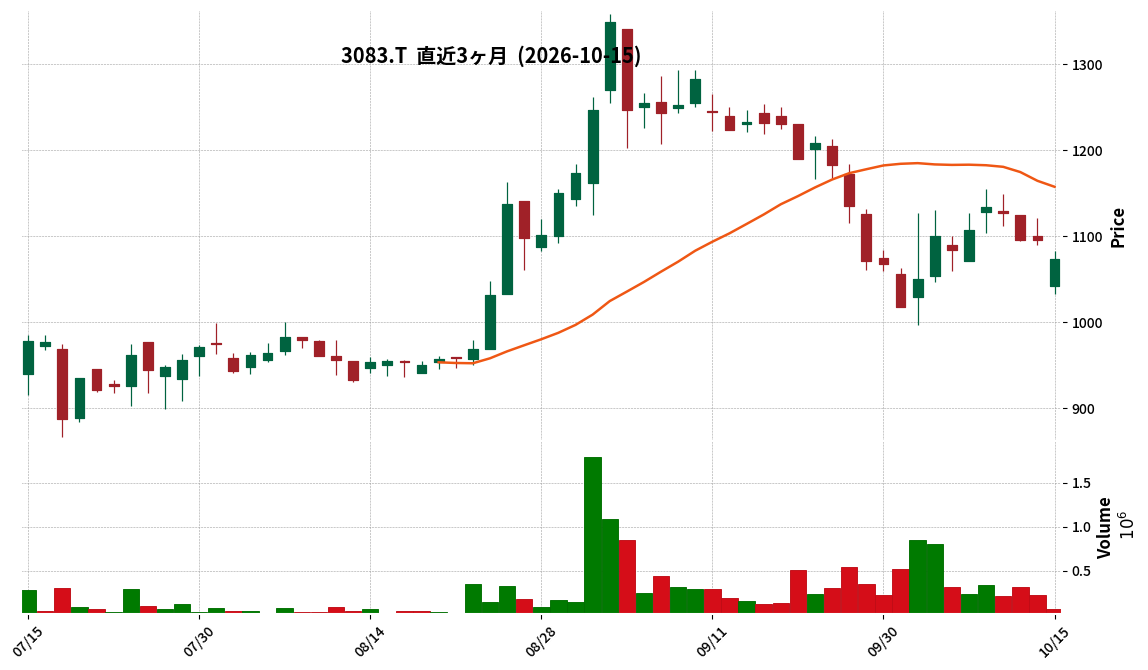
1073.0
▼ -2.01%
This article is an AI-generated summary and analysis of official IR disclosures.
📄 Announcement (AI-Reviewed)
- Starseeds Co., Ltd. announced a correction to a part of its “Q2 FY2027 Financial Results Briefing (Japanese GAAP) (Consolidated)” on October 15, 2026.
- The correction pertains to the content published on October 14, 2026, regarding the “Q2 FY2027 Financial Results Briefing (Japanese GAAP) (Consolidated)”.
- The specific correction is located in the document name displayed on the upper right (header section) of all pages following the table of contents in the attached financial results briefing material.
- Prior to the correction, the header read: “Starseeds Co., Ltd. (3083) Q2 FY2026 Financial Results Briefing (Consolidated)”.
- After the correction, the header now reads: “Starseeds Co., Ltd. (3083) Q2 FY2027 Financial Results Briefing (Consolidated)”.
🤖 AI Perspective
This correction addresses a typographical error in the fiscal period stated in the header of the previously released Q2 FY2027 financial results briefing. It appears to be a formal correction to the document’s presentation rather than a revision of the financial figures themselves. For investors, this could be seen as an indication of the company’s commitment to accuracy in its public disclosures, though it does not impact the reported financial performance.
1407|ウエストHD
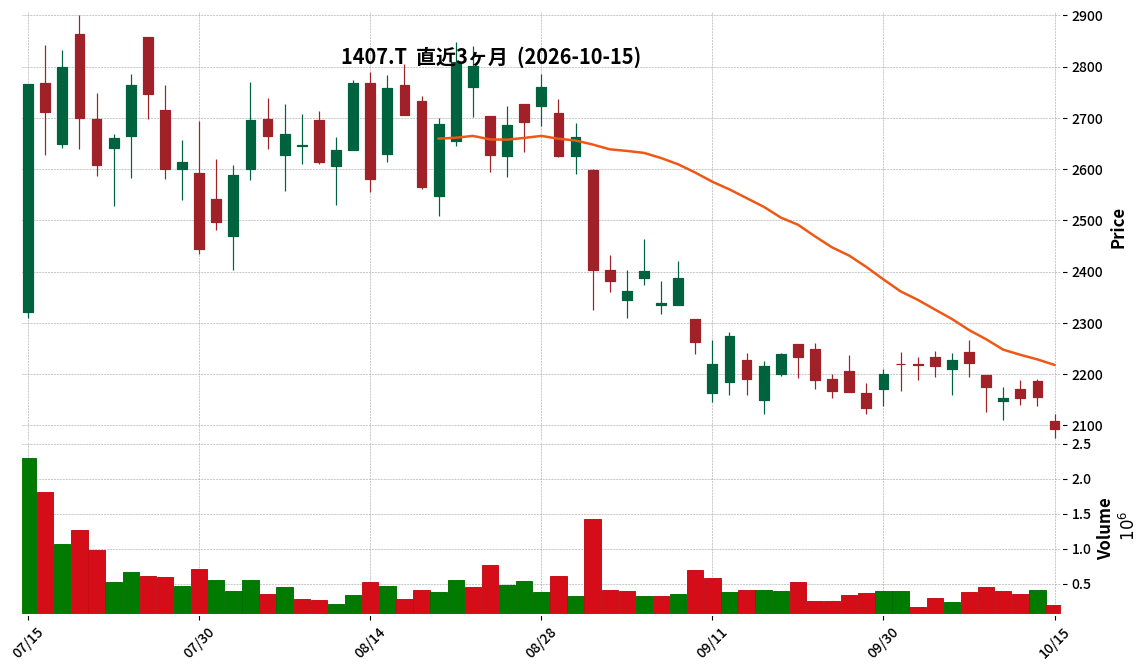
2094.0
▼ -2.88%
This article is an AI-generated summary and analysis of official IR disclosures.
📄 Announcement (AI-Reviewed)
- West Holdings Co., Ltd. announced its consolidated financial results for the fiscal year ended August 31, 2026.
- Consolidated net sales amounted to ¥56,649 million, representing a 19.9% increase from the previous fiscal year.
- Operating income reached ¥12,992 million, a substantial increase of 50.3% year-over-year.
- Net income attributable to owners of parent rose by 50.1% to ¥8,040 million.
- For the fiscal year ending August 31, 2027, the company forecasts consolidated net sales of ¥70,412 million (up 24.3%), operating income of ¥15,600 million (up 20.1%), and net income attributable to owners of parent of ¥9,379 million (up 16.6%).
- The annual dividend for FY2026 was ¥70.00 (¥35.00 at year-end), and the company projects ¥70.00 (¥35.00 at year-end) for FY2027.
🤖 AI Perspective
West Holdings demonstrated significant growth across its top and bottom lines in FY2026, with operating and net income showing increases of around 50%. This strong performance may suggest that the company’s strategic focus on expanding its renewable energy business is yielding positive results. The positive outlook for FY2027, projecting continued increases in sales and profits, could indicate management’s confidence in sustained favorable market conditions.
3608|TSI HD
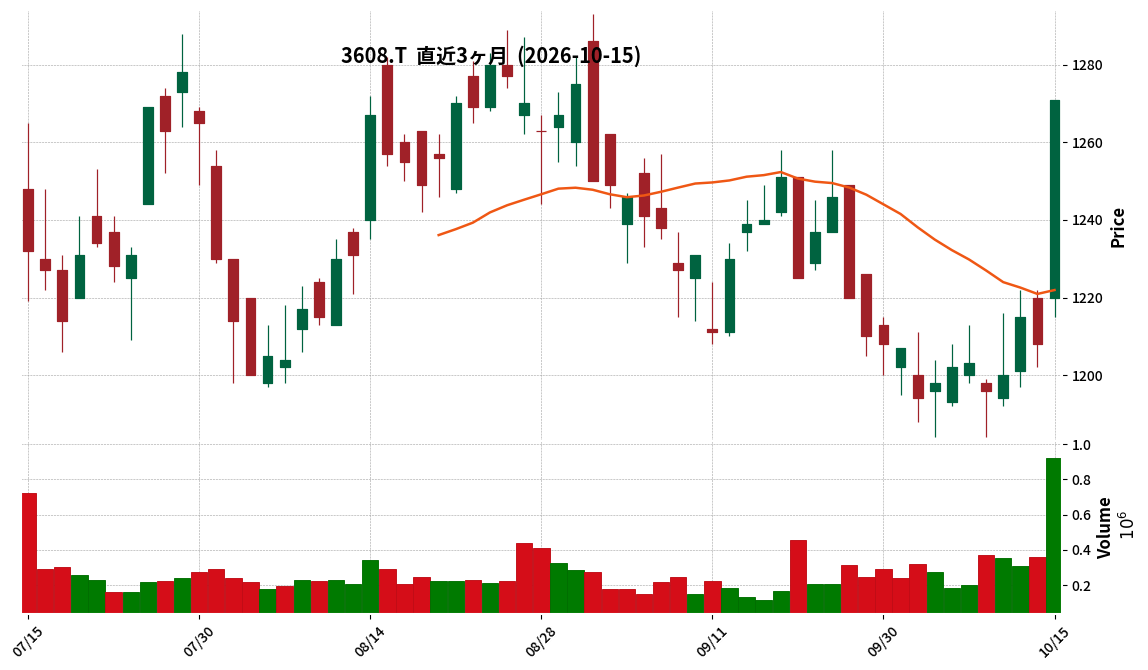
1271.0
▲ +5.22%
This article is an AI-generated summary and analysis of official IR disclosures.
📄 Announcement (AI-Reviewed)
- For H1 FY2027, net sales reached ¥88.9 billion (up 134.4% YoY), operating profit was ¥990 million (up 155.5% YoY), and net profit was ¥1.11 billion (down 85.1% YoY).
- The increase in net sales was attributed to the consolidation of Daytona International and Waterfront, strong performance in men’s casual wear, and the recovery of key women’s brands.
- Operating profit increased due to higher sales and an improved selling, general, and administrative expenses (SG&A) ratio.
- Domestic e-commerce sales rose to ¥12.8 billion (up 196.5% YoY), largely contributed by the two M&A companies.
- Inventories increased due to the new consolidation of three M&A companies; on an existing business basis, inventories were up 104.3% YoY due to early arrivals of autumn/winter items.
638A|P-ハイネス
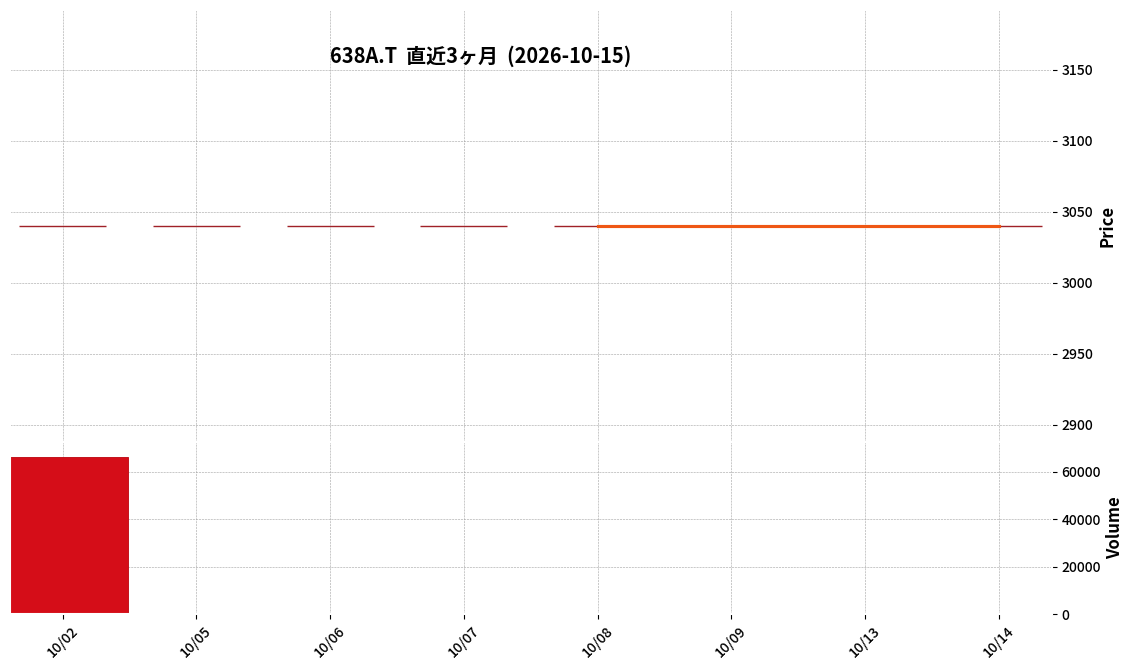
3040.0
▲ +0.00%
This article is an AI-generated summary and analysis of official IR disclosures.
📄 Announcement (AI-Reviewed)
- For the interim period of the fiscal year ending February 2027, consolidated results show net sales of ¥1,574 million, an operating loss of ¥262 million, an ordinary loss of ¥270 million, and a net loss attributable to parent company shareholders of ¥255 million.
- The absence of new property completions and deliveries during this interim consolidated accounting period impacted the business performance.
- Segment-wise, the “Churaku-bo Condominium Sales Business” recorded ¥925 million in net sales and a segment loss of ¥182 million. The “Churaku-bo Distribution Business” had ¥36 million in net sales and a segment loss of ¥24 million. The “Churaku-bo Management Business” recorded ¥607 million in net sales and a segment profit of ¥14 million. The “Other Businesses” segment reported ¥4 million in net sales and a segment profit of ¥0 million.
- As of the end of the interim period for FY2027, consolidated financial position shows total assets of ¥7,116 million, net assets of ¥566 million, and an equity ratio of 8.0% (a decrease of 3.9 percentage points from the end of the previous fiscal year).
- The full-year consolidated forecast for FY2027 projects net sales of ¥3,810 million (a 22.5% decrease year-on-year), an operating loss of ¥103 million, an ordinary loss of ¥60 million, a net loss attributable to parent company shareholders of ¥106 million, and basic earnings per share of -¥80.39.
🤖 AI Perspective
The interim period’s significant decline in revenue and profits appears to be primarily driven by the lack of new property completions and deliveries, a common characteristic in the real estate development sector. While the core “Churaku-bo Condominium Sales Business” continues to post losses, the “Churaku-bo Management Business” (a recurring revenue model) demonstrated profitability, which could be a stabilizing factor. The notable decrease in the equity ratio to 8.0% may warrant attention from investors as it indicates a shift in the company’s financial structure.
6521|G-オキサイド
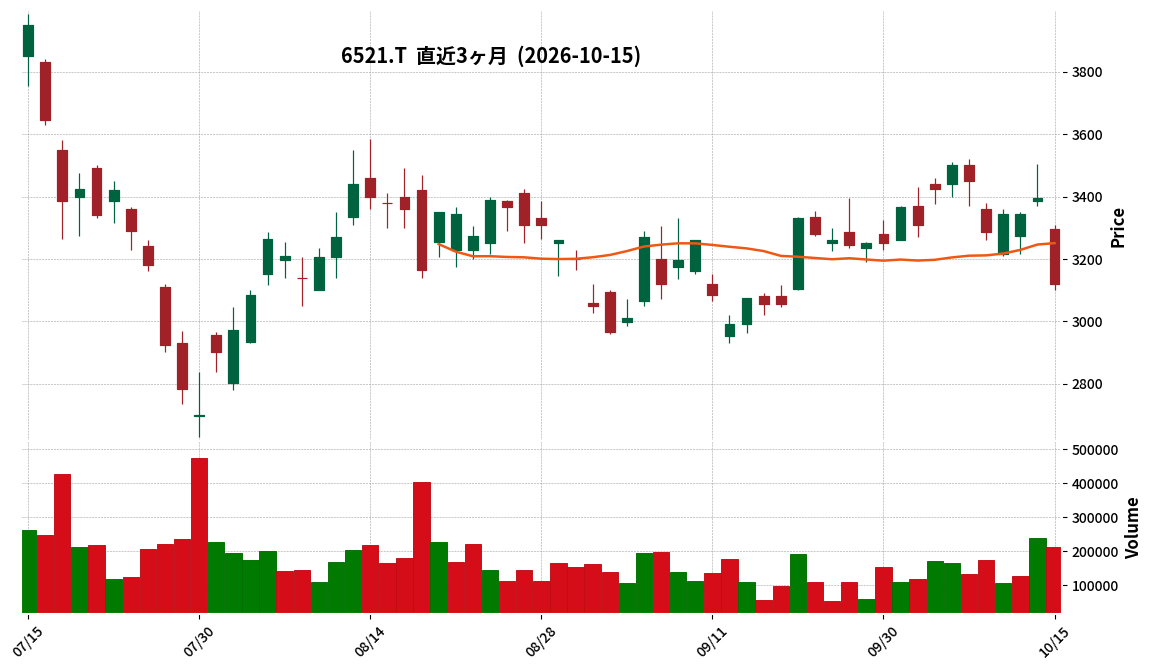
3120.0
▼ -8.10%
📎 Source:G-オキサイド Official IR →
This article is an AI-generated summary and analysis of official IR disclosures.
📄 Announcement (AI-Reviewed)
- For the second quarter of the fiscal year ending February 2027 (interim period), consolidated net sales reached ¥4,935 million, an 18.9% increase year-over-year.
- Operating income was ¥641 million (compared to a loss of ¥189 million in the prior-year period), ordinary income was ¥558 million (compared to a loss of ¥227 million), and net income attributable to owners of parent was ¥571 million (compared to a loss of ¥270 million), all turning profitable.
- The semiconductor business saw increased shipments of laser products and optical single crystal products, driven by the expanding semiconductor manufacturing equipment market, exceeding initial sales forecasts.
- The full-year consolidated performance forecast was revised upward, projecting net sales of ¥10,323 million (up 2.8% from previous forecast), operating income of ¥1,367 million (up 151.9%), ordinary income of ¥1,234 million (up 83.0%), and net income attributable to owners of parent of ¥1,328 million (previously a projected loss).
- Total assets at the end of the period stood at ¥15,394 million (up ¥621 million from the previous fiscal year-end), and net assets were ¥5,349 million (up ¥654 million).
🤖 AI Perspective
G-Oxide’s Q2 FY2027 results show a significant turnaround from a loss to profitability, coupled with strong revenue growth, which may capture investor attention. The performance appears to be significantly driven by the robust semiconductor business, suggesting the company is benefiting from market expansion, potentially related to AI demand. The upward revision of the full-year forecast could also be viewed as a positive indicator for the company’s future outlook and operational efficiency.
8614|東洋証
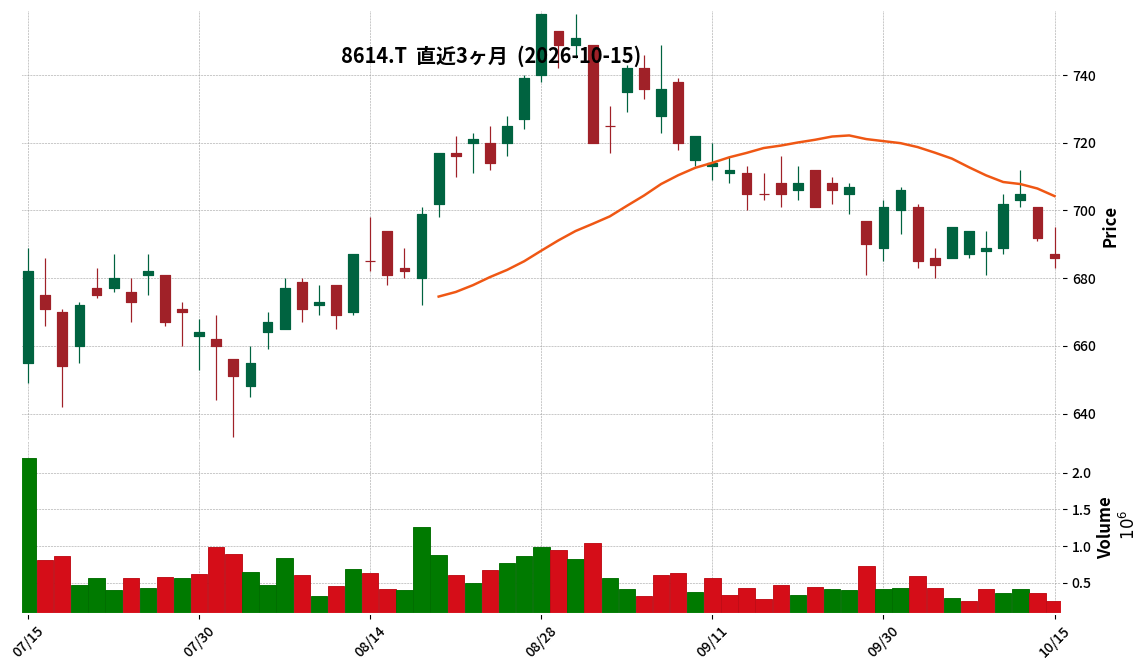
686.0
▼ -0.87%
This article is an AI-generated summary and analysis of official IR disclosures.
📄 Announcement (AI-Reviewed)
- Toyo Securities Co., Ltd. announced its preliminary consolidated financial results for the second quarter of the fiscal year ending March 2027 on October 15, 2026.
- For the second quarter of FY2027 (April 1, 2026 – September 30, 2026), preliminary consolidated figures show operating revenue of JPY 7,491 million, operating income of JPY 2,152 million, ordinary income of JPY 2,269 million, and net income attributable to parent company shareholders of JPY 2,510 million.
- Compared to the same period in the previous fiscal year (Q2 FY2026 actuals), operating revenue increased by 20.7%, operating income by 142.6%, ordinary income by 117.1%, and net income attributable to parent company shareholders by 69.3%.
- The primary reasons cited for the increase in performance are higher domestic stock brokerage commissions, Chinese stock commissions, and investment trust administration fees, despite a decrease in investment trust sales commissions.
- The official announcement is scheduled for October 29, 2026, and actual results may differ from these preliminary figures.
🤖 AI Perspective
The preliminary results indicate significant year-over-year growth across key profit metrics, with operating income showing particularly strong expansion. While a decline in investment trust sales commissions was noted, increased commissions from domestic and Chinese stock brokerage and investment trust administration fees appear to be key drivers of the positive performance. This may suggest a shift in revenue streams or robust activity in specific market segments. Investors may find it worthwhile to monitor the official release for more detailed insights into the underlying business segments.
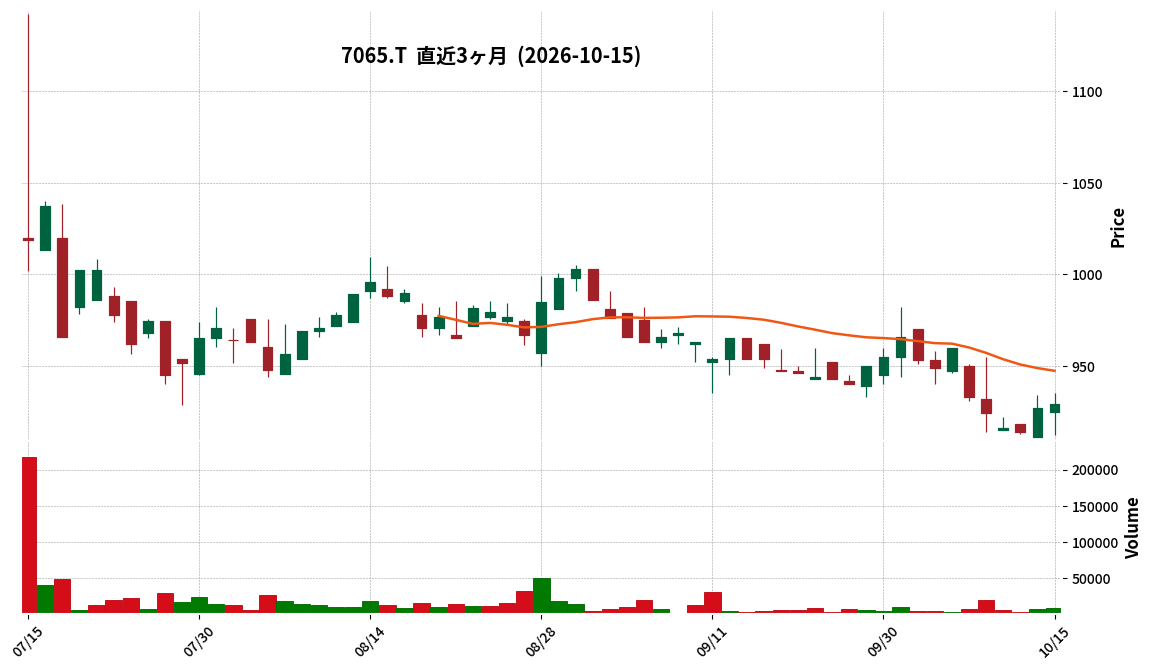
7065|ユーピーアール
929.0
▲ +0.22%
📎 Source:ユーピーアール Official IR →
This article is an AI-generated summary and analysis of official IR disclosures.
📄 Announcement (AI-Reviewed)
- UPR Co., Ltd. announced its consolidated financial results for the fiscal year ended August 2026.
- Net sales reached ¥15,631 million, marking a 1.8% increase compared to the previous fiscal year.
- Operating income was ¥818 million, an increase of 194.8% year-on-year.
- Ordinary income stood at ¥1,190 million (+58.8% YoY), and net income attributable to owners of parent was ¥753 million (+124.1% YoY).
- The year-end dividend for FY2026 August was ¥37 per share, up from ¥25 in the prior year.
- For the fiscal year ending August 2027, the company forecasts consolidated net sales of ¥15,700 million (+0.4% YoY), operating income of ¥330 million (-59.7% YoY), ordinary income of ¥600 million (-49.6% YoY), and net income attributable to owners of parent of ¥400 million (-46.9% YoY).
🤖 AI Perspective
UPR achieved substantial profit growth across key metrics in FY2026 August, with operating income nearly tripling, which may suggest significant operational improvements during the period. However, the company’s forecast for FY2027 August indicates a modest increase in sales but substantial declines in all profit categories, which could prompt investors to monitor the underlying factors and future business strategies. This contrast between strong current performance and a more conservative outlook warrants careful consideration.
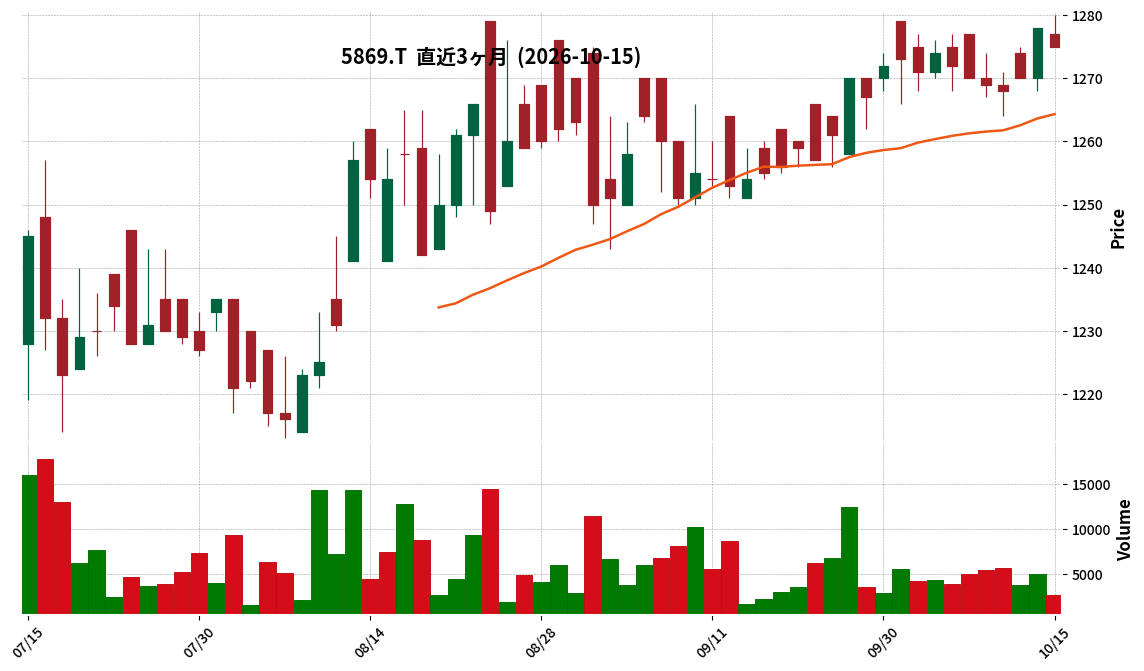
5869|早稲田学習研究会
1275.0
▼ -0.23%
📎 Source:早稲田学習研究会 Official IR →
This article is an AI-generated summary and analysis of official IR disclosures.
📄 Announcement (AI-Reviewed)
- Waseda Gakushu Kenkyukai announced its unaudited non-consolidated financial results for the first quarter of the fiscal year ending May 2027 (June 1, 2026 – August 31, 2026).
- For Q1 FY2027, the company reported Net Sales of ¥1,826 million, Operating Profit of ¥368 million, Ordinary Profit of ¥378 million, and Net Profit of ¥256 million.
- Basic earnings per share for the quarter were ¥25.38.
- As of the end of Q1 FY2027, total assets stood at ¥9,643 million, net assets at ¥7,187 million, and the equity ratio was 74.5%.
- The full-year forecast for FY2027 remains unchanged, projecting Net Sales of ¥7,468 million, Operating Profit of ¥1,500 million, Ordinary Profit of ¥1,524 million, Net Profit of ¥1,044 million, and Basic EPS of ¥103.45.
🤖 AI Perspective
Waseda Gakushu Kenkyukai’s first quarter results for FY22027 show a profitable start across all key financial metrics. While direct year-over-year comparisons are not provided due to a change in the fiscal year end, the reported figures suggest a solid performance, potentially leveraging seasonal demand for their educational services. The reaffirmation of the full-year forecast indicates management’s confidence in maintaining this positive trajectory.
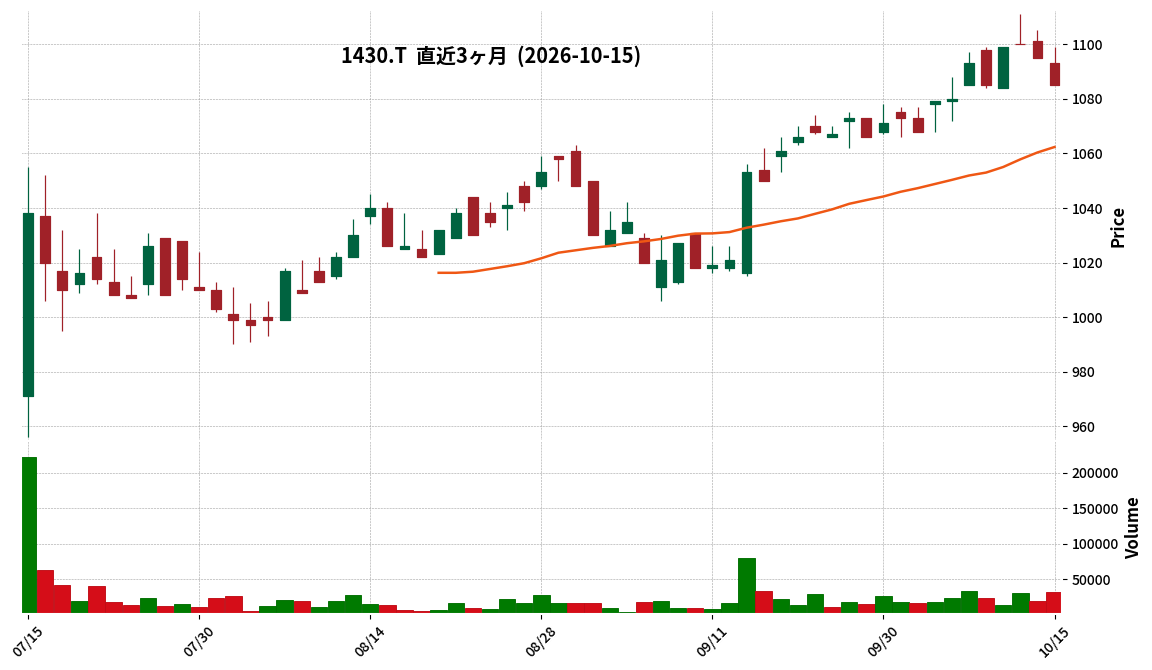
1430|ファーストコーポ
1085.0
▼ -0.91%
📎 Source:ファーストコーポ Official IR →
This article is an AI-generated summary and analysis of official IR disclosures.
📄 Announcement (AI-Reviewed)
- First Corporation Co., Ltd. announced its consolidated financial results for the first quarter of the fiscal year ending May 2027 (June 1, 2026, to August 31, 2026).
- Consolidated results show net sales of ¥7.188 billion (down 3.1% year-on-year), operating profit of ¥470 million (up 9.2% year-on-year), ordinary profit of ¥413 million (down 3.3% year-on-year), and net income attributable to owners of the parent of ¥269 million (down 4.8% year-on-year).
- By segment, the construction business reported net sales of ¥6.010 billion (up 5.0% year-on-year) and segment profit of ¥692 million (up 5.5% year-on-year). The real estate business reported net sales of ¥1.072 billion (down 34.8% year-on-year) and segment profit of ¥91 million (up 19.7% year-on-year).
- During the first consolidated quarter, the construction business secured 2 orders, with order intake totaling ¥20.611 billion and order backlog reaching ¥42.814 billion.
- The consolidated earnings forecast for the fiscal year ending May 2027 and the annual dividend forecast (¥51.00 per share for year-end) remain unchanged from the most recently published figures.
🤖 AI Perspective
First Corp.’s Q1 FY2027 results show a mixed picture with a decrease in net sales but an increase in operating profit, driven by the strong performance of its construction business. The construction segment’s robust order intake and backlog suggest a positive outlook for future revenue generation. The real estate segment, despite lower sales, improved profitability, which could indicate strategic adjustments. The unchanged full-year forecast suggests management’s confidence in achieving its initial targets, making the progression of their strategic plan worth monitoring.
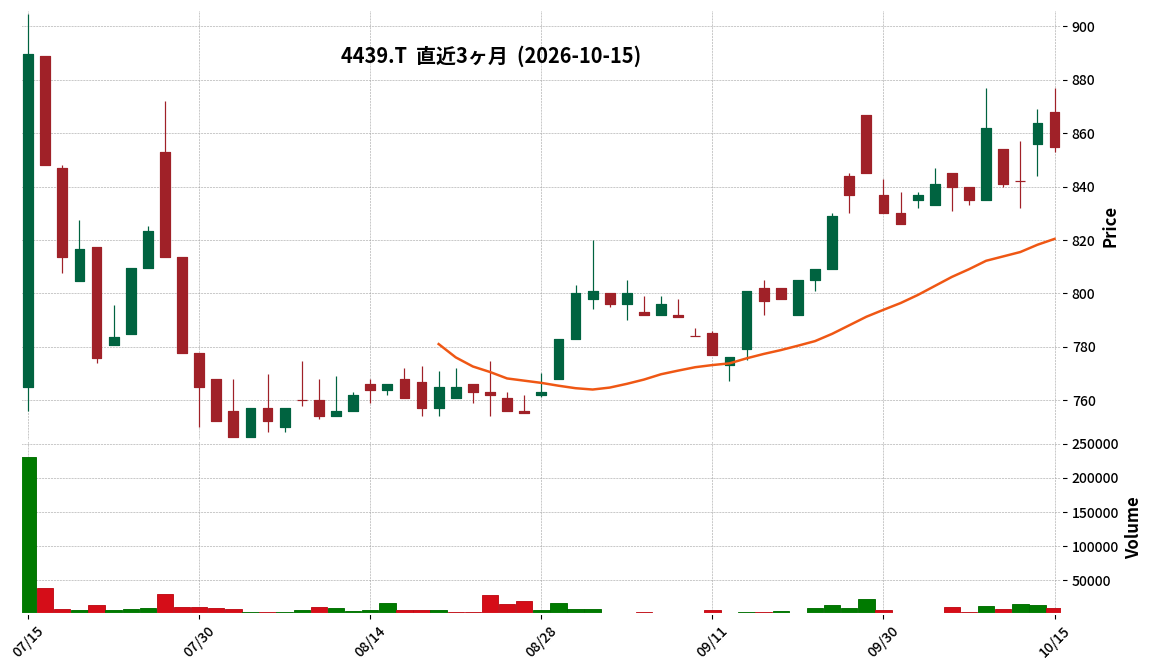
4439|東名
855.0
▼ -1.04%
This article is an AI-generated summary and analysis of official IR disclosures.
📄 Announcement (AI-Reviewed)
- Toumei Co., Ltd. (Code: 4439) announced its consolidated financial results for the fiscal year ended August 2026.
- Sales revenue for the period reached ¥32,579 million, marking a 12.1% increase year-on-year.
- Operating income was ¥3,569 million, up 8.4% from the previous fiscal year, while ordinary income grew by 6.6% to ¥3,606 million.
- Net income attributable to owners of the parent company increased by 1.5% to ¥2,470 million.
- Earnings per share (EPS) were ¥83.07, and the equity ratio stood at 65.5%.
- The annual dividend per share was ¥13.00 (¥6.00 interim, ¥7.00 year-end), a decrease from ¥19.00 in the prior year, but the payout ratio increased to 15.6% (from 11.7%). The dividend forecast for FY2027 August is ¥17.00 per share.
🤖 AI Perspective
Toumei demonstrated solid financial performance in FY2026 August, achieving year-on-year growth across all key profitability metrics including sales revenue, operating income, ordinary income, and net income. While the annual dividend per share saw a reduction compared to the previous year, the increased payout ratio may suggest a commitment to shareholder returns relative to current earnings. The improvement in the equity ratio could also indicate strengthening financial stability, which is worth monitoring by investors.
4015|G-ペイクラウドHD
545.0
▼ -1.62%
📎 Source:G-ペイクラウドHD Official IR →
This article is an AI-generated summary and analysis of official IR disclosures.
📄 Announcement (AI-Reviewed)
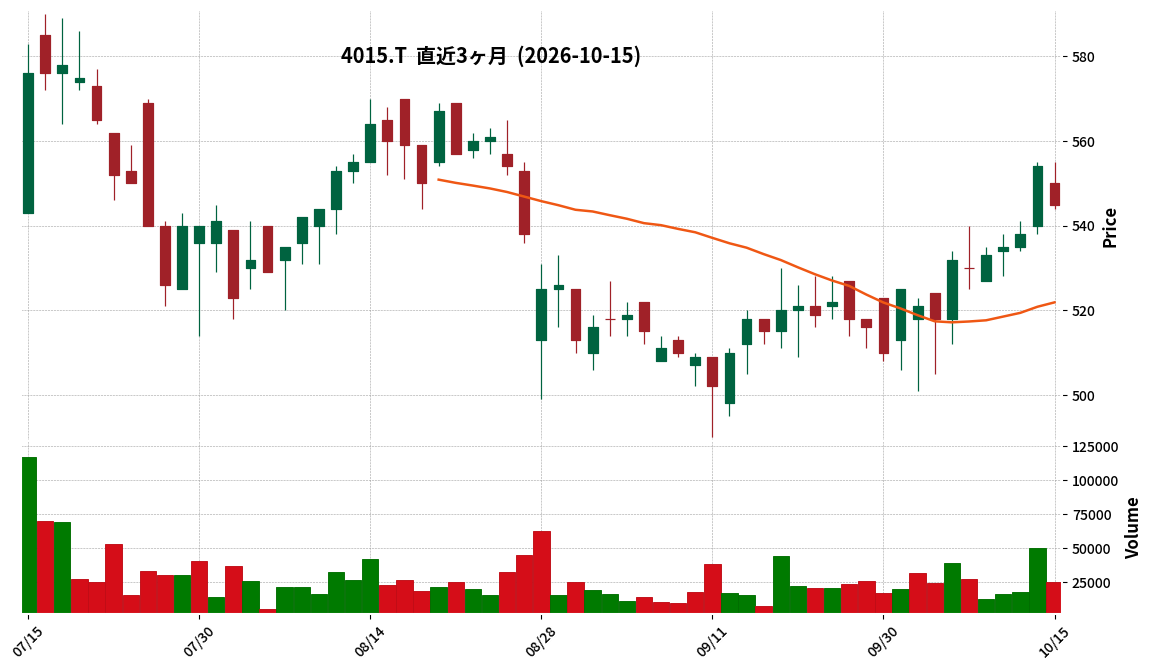
- G-PayCloud HD announced its consolidated financial results for the fiscal year ended August 31, 2026 (September 1, 2025 to August 31, 2026).
- Consolidated net sales reached ¥11,142 million (up 8.9% year-on-year), operating income was ¥828 million (up 13.3%), and ordinary income was ¥812 million (up 13.7%).
- Net profit attributable to owners of parent significantly increased to ¥418 million (up 191.4% year-on-year).
- Adjusted EBITDA stood at ¥1,357 million (up 5.3% year-on-year).
- For the fiscal year ending August 31, 2027, the company forecasts consolidated net sales of ¥13,000 million (up 16.7% year-on-year) and net profit attributable to owners of parent of ¥580 million (up 38.5% year-on-year).
🤖 AI Perspective
G-PayCloud HD’s FY2026 consolidated results show significant growth across revenue and profit metrics, particularly in net profit. This performance appears to be driven by increased settlement fee revenue in the cashless service business and expanded digital signage installations. The steady increase in adjusted EBITDA may suggest solid underlying operational strength.
1419|タマホーム
2762.0
▼ -0.36%
This article is an AI-generated summary and analysis of official IR disclosures.
📄 Announcement (AI-Reviewed)
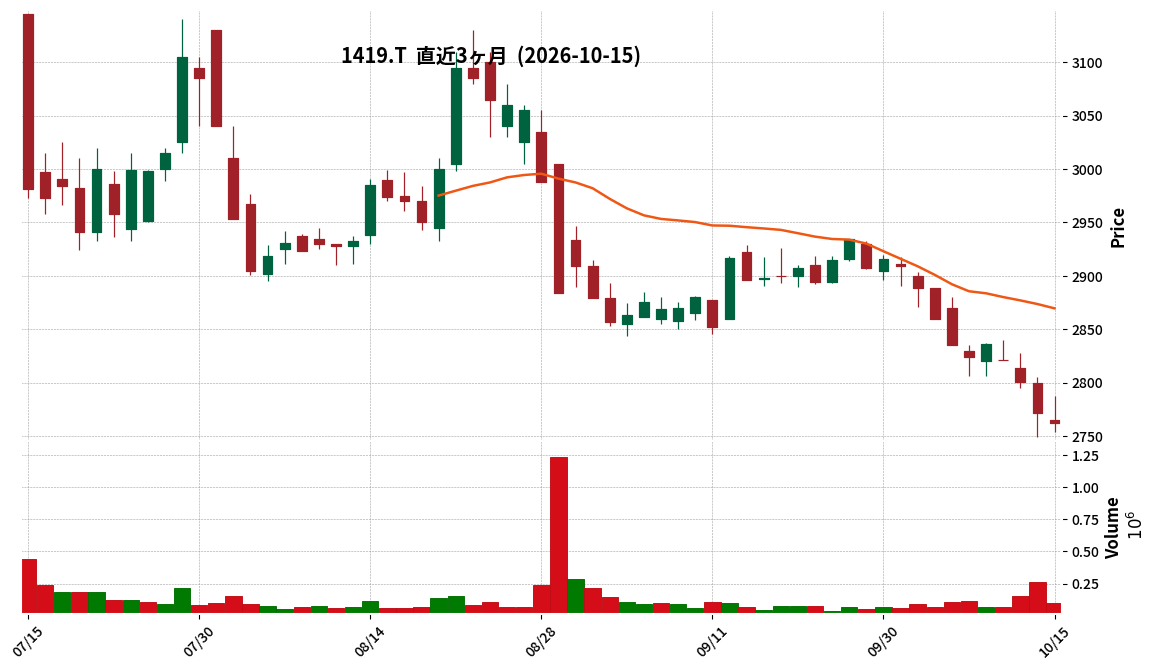
- Tamahome Co., Ltd. released the Q&A summary from its FY2027 Q1 earnings call (telephone conference) on October 15, 2026.
- Customer attendance at promotion campaigns has been strong, particularly from customers without land, leading to robust order growth in detached housing sales.
- Despite a year-over-year decrease in revenue and profit for Q1, performance is progressing largely as initially planned, with recovery anticipated from Q2 onwards.
- The strong performance in detached housing sales is attributed to an increase in customers opting for completed properties that can be delivered quickly, driven by rising interest rates.
- In the order-made housing business, profitability improvements were achieved through revised quotations based on material price trends and reviews of products/specifications.
🤖 AI Perspective
The Q&A summary suggests that Tamahome is demonstrating adaptability to changing market conditions, particularly with its strategies in detached housing and custom-built homes. The ability to meet increased demand for completed properties amidst rising interest rates may indicate a responsiveness to customer needs. Furthermore, the focus on profitability improvement in custom-built housing, through cost and pricing controls, could be a key factor for future performance.
Disclaimer: This article is for informational purposes only and does not constitute investment advice.
5078|セレコーポレーション
4880.0
▲ +6.78%
📎 Source:セレコーポレーション Official IR →
This article is an AI-generated summary and analysis of official IR disclosures.
📄 Announcement (AI-Reviewed)
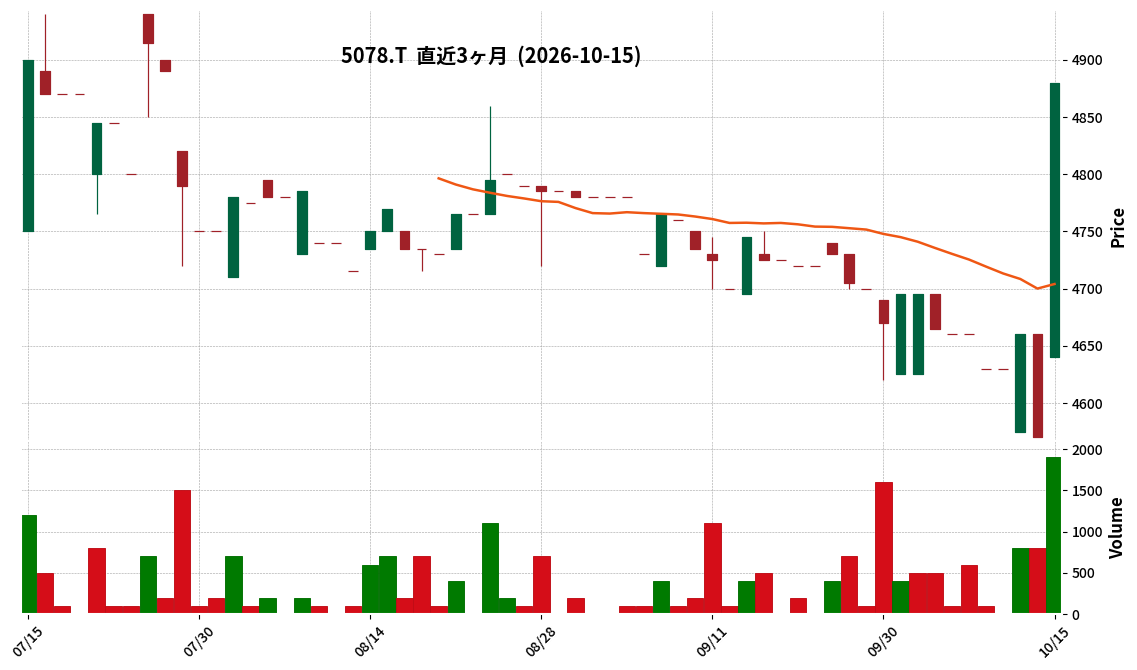
- Cele Corporation announced its consolidated financial results for the second quarter (interim) of the fiscal year ending February 2027.
- For the interim period, net sales reached ¥10,975 million, representing a 1.6% increase compared to the same period in the previous year.
- Operating profit was ¥764 million (down 27.0%), ordinary profit was ¥770 million (down 26.6%), and net income attributable to owners of parent was ¥513 million (down 25.1%).
- Interim earnings per share were ¥155.49.
- The full-year consolidated earnings forecast for the fiscal year ending February 2027 remains unchanged: net sales of ¥23,580 million (up 16.8% year-on-year), operating profit of ¥2,016 million (up 19.2% year-on-year), and net income attributable to owners of parent of ¥1,342 million (up 16.9% year-on-year).
- The year-end dividend forecast is ¥160.00 per share, an increase from ¥135.00 in the previous fiscal year.
🤖 AI Perspective
Cele Corporation’s Q2 FY2027 results show a slight increase in net sales but a decline in various profit metrics. The unchanged full-year forecast could suggest management anticipates a recovery in the second half of the fiscal year. The proposed increase in the year-end dividend may indicate a commitment to shareholder returns.
Disclaimer: This article is for informational purposes only and does not constitute investment advice.
5817|JMACS
1291.0
▼ -0.77%
This article is an AI-generated summary and analysis of official IR disclosures.
📄 Announcement (AI-Reviewed)
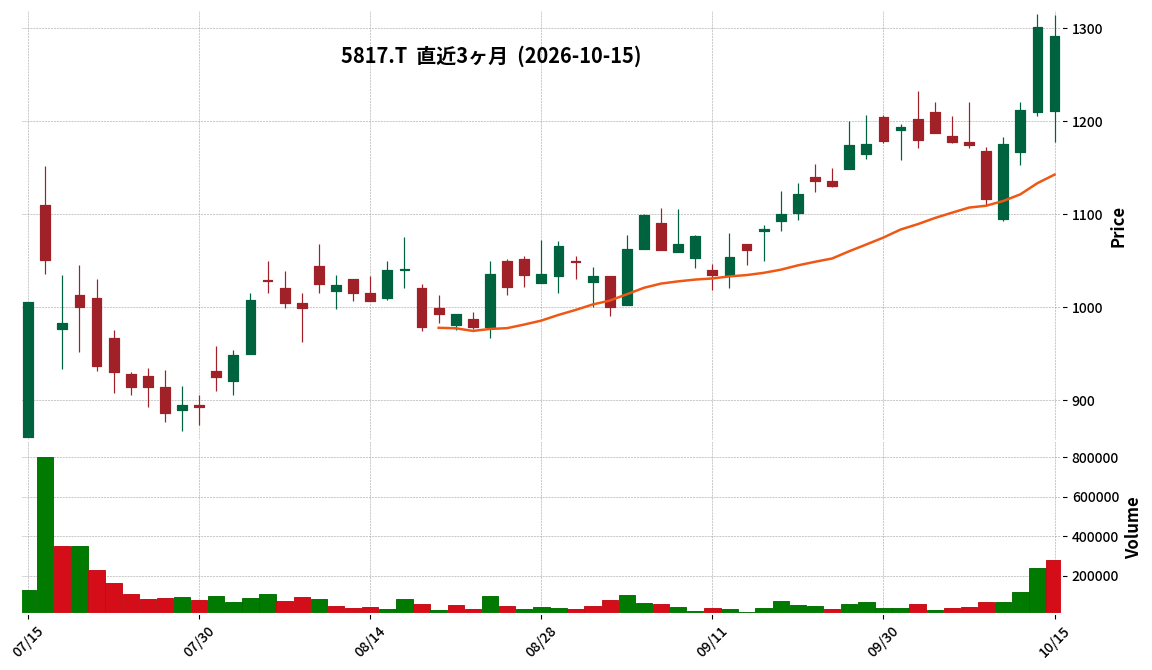
- J.M.A.C.S. announced its unaudited financial results for the second quarter of the fiscal year ending February 2027 on October 15, 2026.
- For the interim period, net sales were ¥3,543 million (up 24.0% year-on-year), operating profit was ¥500 million (up 105.2%), ordinary profit was ¥516 million (up 97.4%), and interim net profit was ¥378 million (up 106.9%).
- Interim net earnings per share stood at ¥67.24, compared to ¥32.50 in the prior year’s interim period.
- As of the interim period end, total assets were ¥10,657 million, net assets were ¥5,965 million, and the equity ratio was 56.0%.
- The full-year forecast for FY2027 has been revised upwards, projecting net sales of ¥7,000 million (up 16.1% year-on-year), operating profit of ¥691 million (up 37.8%), ordinary profit of ¥745 million (up 37.0%), net profit of ¥518 million (up 29.3%), and basic earnings per share of ¥92.08.
🤖 AI Perspective
J.M.A.C.S.’s interim results for FY2027 show significant growth across all key profit metrics, substantially outperforming the previous year. This performance appears to be driven by robust demand in the semiconductor industry and active engagement in plant and signal upgrade projects. The upward revision of the full-year forecast suggests that the company anticipates this positive momentum to continue, reflecting a favorable business environment and effective corporate strategies.
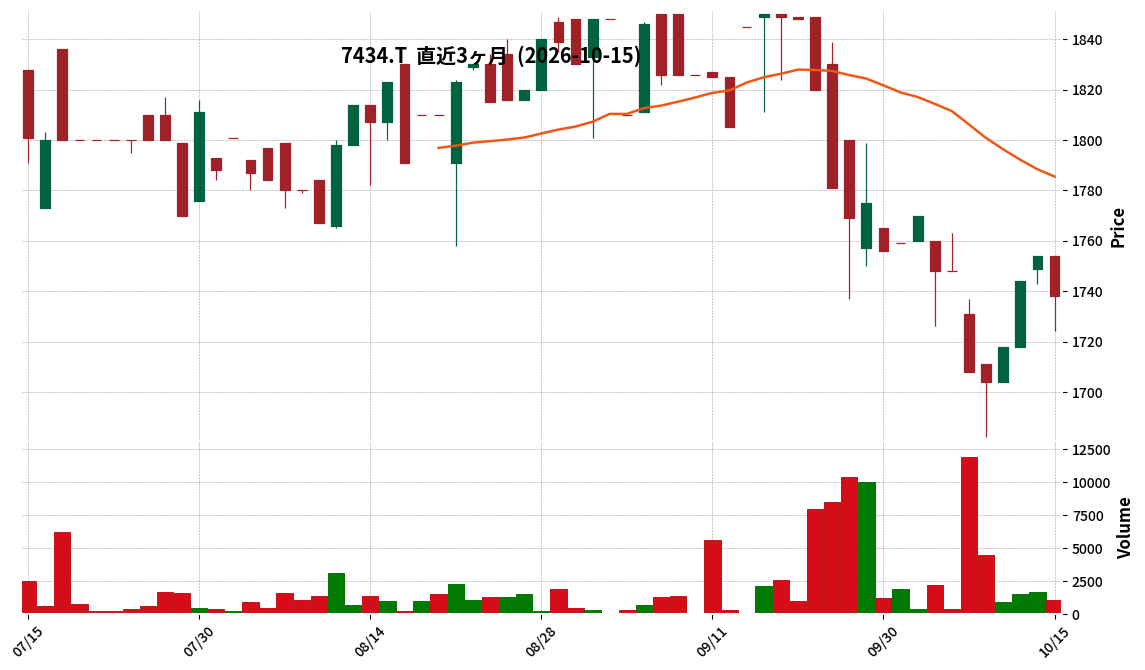
7434|オータケ
1738.0
▼ -0.91%
This article is an AI-generated summary and analysis of official IR disclosures.
📄 Announcement (AI-Reviewed)
- OTAKE Co., Ltd. has announced the determined disclosure date for its financial results for the fiscal year ending May 2026.
- The new scheduled disclosure date is Tuesday, October 27, 2026.
- This announcement follows the previously notified postponement of the FY2026 May financial results disclosure, which was originally communicated on June 26, 2026.
- The company expressed a deep apology to its shareholders, investors, and other stakeholders for the significant inconvenience and concern caused.
🤖 AI Perspective
While a delay in financial results can introduce uncertainty for market participants, the determination of a specific disclosure date suggests that the information disclosure process is progressing. Investors may find this clarity helpful, as it provides a firm date for the release of the delayed financial data, which is essential for ongoing analysis of the company’s performance.
Disclaimer: This article is for informational purposes only and does not constitute investment advice.
1452|P-横浜ライト工業
—
▲ +0.00%
📎 Source:P-横浜ライト工業 Official IR →
This article is an AI-generated summary and analysis of official IR disclosures.
📄 Announcement (AI-Reviewed)
- P-Yokohama Light Industry announced its consolidated interim results for the fiscal year ending February 2027 (March 1, 2026 – August 31, 2026).
- Consolidated net sales amounted to JPY 1,889 million (up 27.2% year-on-year for the interim period), operating income was JPY 231 million (up 9.3%), and ordinary income was JPY 226 million (up 5.2%).
- Net income attributable to owners of parent was JPY 141 million (down 7.8% year-on-year).
- Diluted EPS for the interim period was JPY 3,000.73.
- The full-year consolidated earnings forecast (net sales JPY 3,624 million, net income attributable to owners of parent JPY 124 million) remains unchanged from the most recently announced forecast.
🤖 AI Perspective
The increase in net sales, operating income, and ordinary income, juxtaposed with a decrease in net income attributable to owners of parent, is a key point for investors to consider. The unchanged full-year forecast suggests that the performance in the second half of the fiscal year will be crucial. An improved equity ratio of 51.7% may indicate a strengthening financial position.
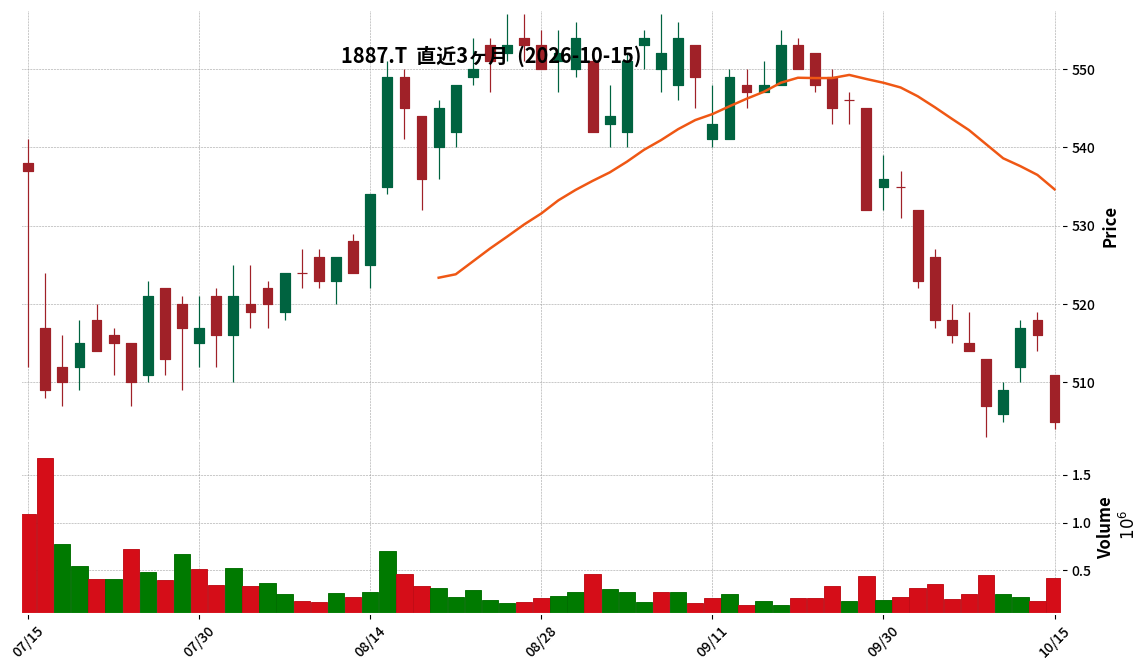
1887|日本国土開発
505.0
▼ -2.13%
This article is an AI-generated summary and analysis of official IR disclosures.
📄 Announcement (AI-Reviewed)
- Japan KOKUDO Development announced its consolidated financial results for the first quarter of FY2027 (June 1, 2026, to August 31, 2026).
- Consolidated net sales totaled ¥32,056 million, representing a 7.1% decrease compared to the same period of the previous fiscal year.
- Operating profit was ¥1,942 million (down 0.2% YoY), and ordinary profit was ¥1,954 million (down 0.8% YoY).
- Net income attributable to parent shareholders increased by 21.9% YoY to ¥1,587 million.
- The full-year consolidated earnings forecast and dividend forecast remained unchanged from the most recently published predictions.
- One new company, Ogo Solar Power LLC, was included in the scope of consolidation during this quarter.
🤖 AI Perspective
Despite a decline in sales, the significant increase in net income attributable to parent shareholders may draw investor attention, potentially due to improved profitability in the construction segment. However, the real estate segment recorded a loss due to upfront investment costs. The unchanged full-year forecasts suggest that the company’s management may have anticipated the current performance trends.
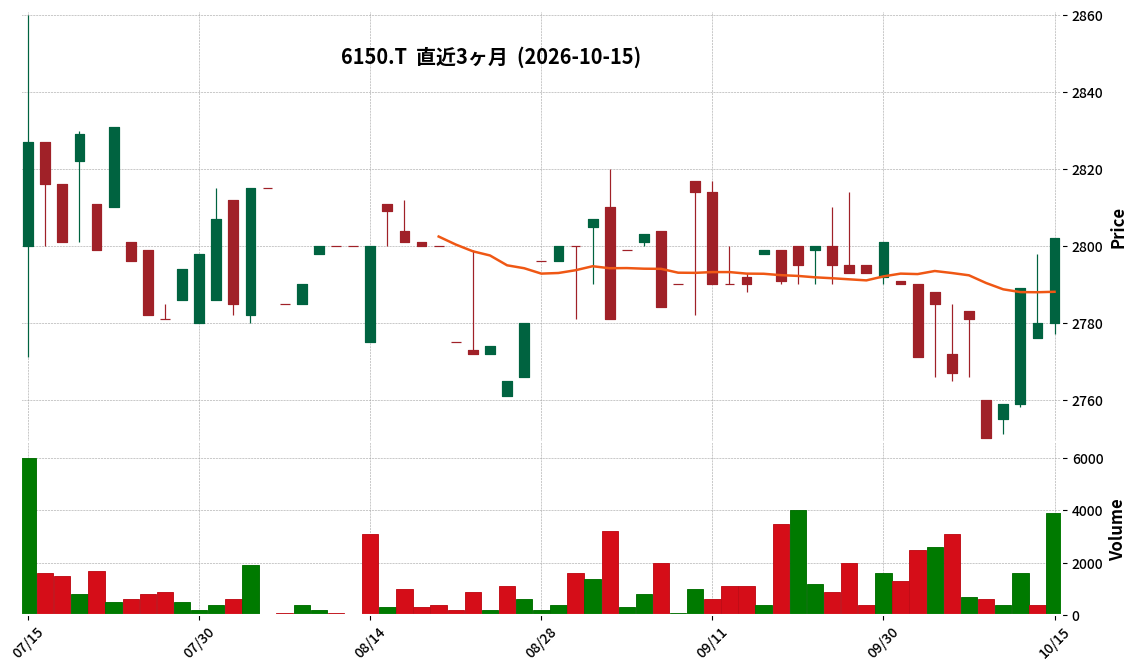
6150|タケダ機械
2802.0
▲ +0.79%
This article is an AI-generated summary and analysis of official IR disclosures.
📄 Announcement (AI-Reviewed)
- Takeda Machine announced its consolidated financial results for the first quarter of fiscal year 2027 (June 1, 2026 – August 31, 2026).
- Net sales for the quarter were ¥790 million, a decrease of 1.9% compared to the same period of the previous year.
- The company reported an operating loss of ¥39 million (compared to a loss of ¥13 million in the prior year), an ordinary loss of ¥34 million (compared to a loss of ¥9 million in the prior year), and a net loss attributable to parent company shareholders of ¥25 million (compared to a loss of ¥8 million in the prior year).
- Regarding the consolidated financial position, total assets stood at ¥7,212 million (down ¥555 million from the end of the previous fiscal year), net assets were ¥5,379 million (down ¥84 million), and the equity ratio was 74.6%.
- The full-year consolidated earnings forecast and dividend forecast for fiscal year 2027 remain unchanged from the most recently published figures.
🤖 AI Perspective
The slight decrease in sales and widening losses in Q1 may reflect challenging business conditions, including labor shortages and rising costs in the construction sector, which have led to suppressed capital expenditure and extended lead times for components. However, the reduction in total assets alongside an improved equity ratio could suggest a continued focus on maintaining a stable financial base. As the full-year forecast remains unchanged, ongoing monitoring of the company’s performance and market conditions will be essential for investors.
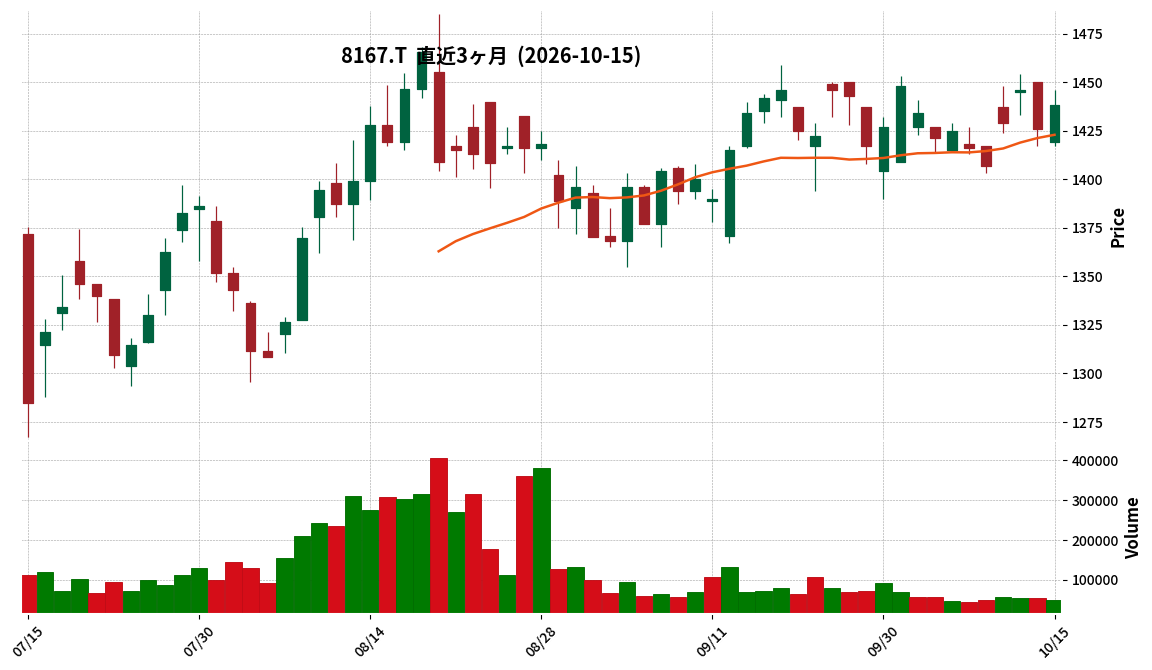
8167|リテールパートナーズ
1438.0
▲ +0.84%
📎 Source:リテールパートナーズ Official IR →
This article is an AI-generated summary and analysis of official IR disclosures.
📄 Announcement (AI-Reviewed)
- Retail Partners Co., Ltd. announced its consolidated financial results for the second quarter (interim period) of the fiscal year ending February 2027.
- Consolidated operating revenue for the interim period reached ¥143.392 billion, marking a 3.1% increase compared to the prior interim period.
- Consolidated operating income was ¥2.776 billion (down 17.2%), ordinary income was ¥3.295 billion (down 16.6%), and profit attributable to owners of parent was ¥2.034 billion (down 24.8%).
- During the interim period, three companies—Kodama Kashikoubou Co., Ltd., Delish Holdings Co., Ltd., and Soei Shokuhin Co., Ltd.—were added to the scope of consolidation, while Tomura Bokujo Co., Ltd. was excluded.
- The full-year dividend forecast for the fiscal year ending February 2027 remains at ¥40 per share (¥20 interim, ¥20 year-end), with no revisions from the latest announced forecast.
🤖 AI Perspective
While consolidated operating revenue increased, the decline across all profit metrics may draw attention to trends in cost of sales and selling, general, and administrative expenses. Additionally, the impact of changes in the scope of consolidation due to M&A activities on future performance could be a key area for investors to monitor.
9778|昴
5600.0
▲ +0.18%
This article is an AI-generated summary and analysis of official IR disclosures.
📄 Announcement (AI-Reviewed)
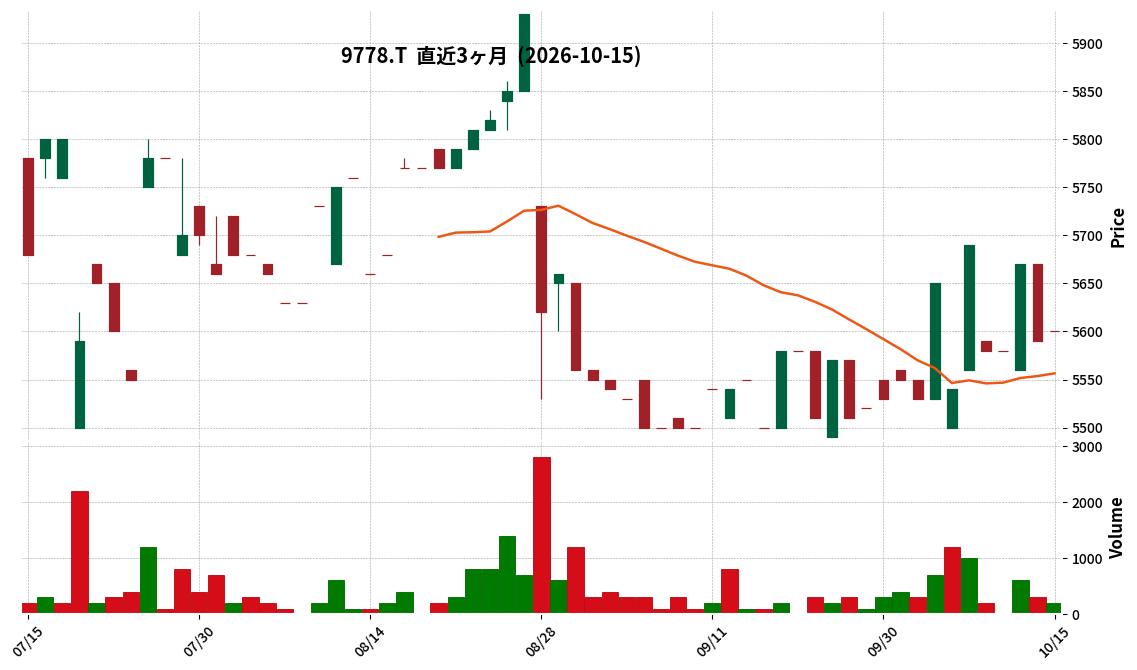
- For the second quarter of fiscal year 2027 (interim period), Subaru Corp. reported net sales of ¥1,608 million, a 1.5% increase compared to the prior interim period.
- The company recorded an operating loss of ¥14 million (vs. ¥60 million loss in prior interim period), an ordinary loss of ¥7 million (vs. ¥54 million loss), and a net loss of ¥26 million (vs. ¥36 million loss) for the same period.
- Segment sales included ¥469 million for the Preschool/Elementary School Division (up 7.8% YoY), ¥223 million for the High School Division (up 6.7% YoY), and ¥91 million for Individual Instruction (up 9.2% YoY), while the Junior High School Division saw ¥751 million (down 2.6% YoY).
- As of the end of the interim period, total assets stood at ¥6,476 million (down ¥398 million from the previous fiscal year-end), net assets at ¥3,551 million (down ¥69 million), and the equity ratio at 54.8%.
- The full-year forecast for fiscal year 2027 remains unchanged, projecting net sales of ¥3,459 million, operating profit of ¥195 million, ordinary profit of ¥204 million, and net profit of ¥133 million (¥224.74 per share).
🤖 AI Perspective
Subaru’s interim results show a modest increase in net sales year-over-year, yet operating, ordinary, and net profits remain in the red, albeit with reduced losses compared to the previous year. The growth in specific divisions like preschool/elementary, high school, and individual instruction may suggest targeted strategies are having some positive impact. The unchanged full-year forecast could indicate management’s confidence in a stronger performance in the latter half of the fiscal year.
2927|AFC-HD
845.0
▲ +0.00%
This article is an AI-generated summary and analysis of official IR disclosures.
📄 Announcement (AI-Reviewed)
- AFC-HD AMS Life Science Co., Ltd. (Code: 2927) has announced its consolidated financial results for the fiscal year ended August 2026.
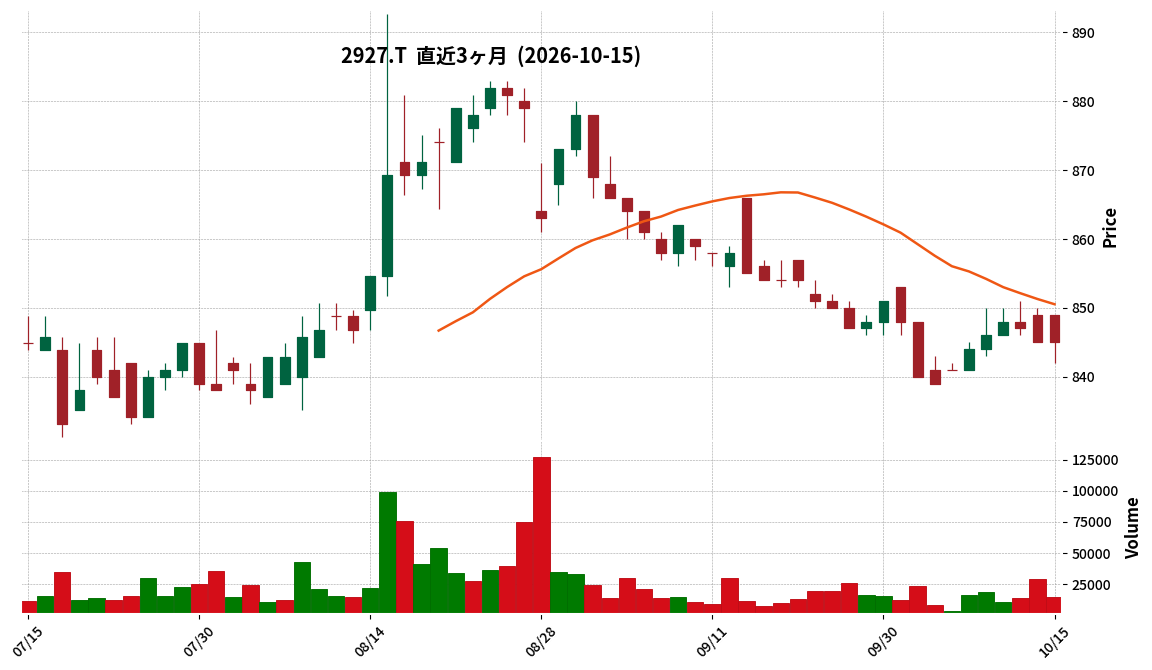
- For FY2026, consolidated net sales were ¥34,324 million (up 5.1% year-on-year), and operating income was ¥2,455 million (up 1.9% year-on-year).
- Ordinary income decreased by 2.2% to ¥2,390 million, and net income attributable to owners of the parent decreased by 17.2% to ¥1,198 million. This was due to the recognition of an impairment loss of ¥435 million on goodwill and fixed assets as an extraordinary loss.
- The annual dividend per share was ¥40 (interim ¥18, year-end ¥22), an increase from ¥34 in the previous fiscal year.
- For FY2027, the company forecasts consolidated net sales of ¥35,473 million (up 3.3% year-on-year), operating income of ¥2,623 million (up 6.9% year-on-year), and net income attributable to owners of the parent of ¥1,658 million (up 38.3% year-on-year).
🤖 AI Perspective
AFC-HD achieved increased sales and operating income in FY2026, but the recognition of an impairment loss on goodwill and fixed assets as an extraordinary loss led to a decrease in net income attributable to owners of the parent. However, the company projects significant growth in net income for FY2027, which may suggest confidence in its future performance when excluding the one-off impairment impact. The increased dividend and active promotion of new businesses (real estate/construction and tourism) are also worth monitoring as indicators of strategic direction.
353A|エレコミ
—
▲ +0.00%
This article is an AI-generated summary and analysis of official IR disclosures.
📄 Announcement (AI-Reviewed)
- ELECOM Co., Ltd. reported net sales of 1,165,203 thousand yen for the first quarter of FY2027, an increase of 11.3% year-on-year.
- Operating profit stood at 2,512 thousand yen, a 95.0% decrease from the previous year, while ordinary profit was 1,944 thousand yen, down 96.3% year-on-year.
- The company recorded a net loss of 2,095 thousand yen for the quarter, compared to a profit of 31,354 thousand yen in the same period last year.
- By business segment, maintenance services generated sales of 486,823 thousand yen (up 6.7% YoY), and renovation services generated sales of 678,217 thousand yen (up 14.9% YoY).
- During the first quarter, the Oita branch was newly established. Furthermore, the Kochi and Itami branches opened in September 2026, and the Kitami branch in October, bringing the total number of branches and sales offices to 55.
🤖 AI Perspective
While sales showed solid growth, the significant decline in profits is noteworthy, attributed to increased upfront investments in human resources for mid-to-long-term growth. This indicates the company is in an investment phase, and investors may focus on how future sales growth balances with profit recovery. The consistent growth in maintenance and renovation services, coupled with aggressive expansion into new regions through branch openings, could be a foundation for strengthening future revenue streams.
9388|Q-パパネッツ
—
▲ +0.00%
📎 Source:Q-パパネッツ Official IR →
This article is an AI-generated summary and analysis of official IR disclosures.
📄 Announcement (AI-Reviewed)
- For the second quarter of the fiscal year ending February 2027, net sales reached ¥3,372 million, marking a 13.5% increase year-on-year.
- Operating profit for the same period was ¥383 million (up 5.6% YoY), ordinary profit was ¥381 million (up 7.1% YoY), and interim net profit was ¥263 million (up 10.7% YoY).
- Sales in the Management Company Support business totaled ¥2,500,759 thousand (up 10.8% YoY), while sales in the Interior Total Support business reached ¥854,097 thousand (up 22.3% YoY).
- The financial position at the end of the interim period showed total assets of ¥2,489 million, net assets of ¥1,187 million, and an equity ratio of 47.7%.
- The forecast for the full-year dividend for February 2027 is a total of ¥25.00 per share, comprising an interim dividend of ¥15.00 and a year-end dividend of ¥10.00.
190A|G-Chordia
55.0
▼ -1.79%
📎 Source:G-Chordia Official IR →
This article is an AI-generated summary and analysis of official IR disclosures.
📄 Announcement (AI-Reviewed)
- G-Chordia announced its financial results (non-consolidated) for the fiscal year ended August 2026 (September 1, 2025 – August 31, 2026).
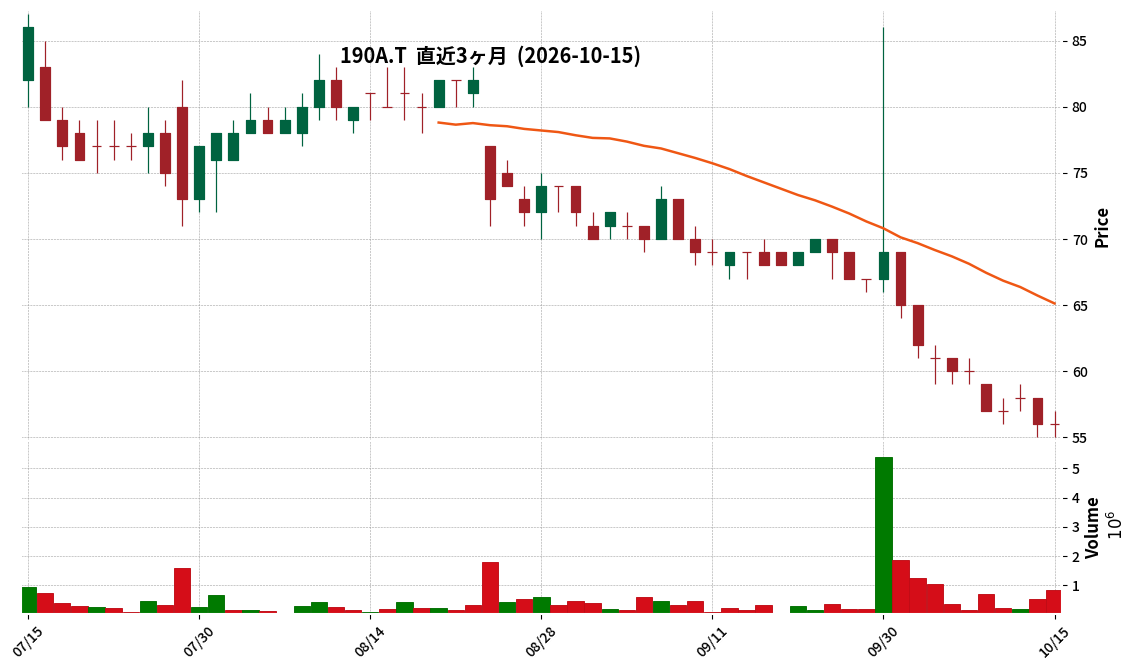
- Business revenue for FY2026 August was not stated. Operating loss was ¥(1,473) million (compared to ¥(1,789) million in the previous year), ordinary loss was ¥(1,450) million (compared to ¥(1,769) million), and net loss was ¥(1,455) million (compared to ¥(1,785) million).
- Net loss per share was ¥(19.74) (compared to ¥(26.03) in the previous year).
- The equity ratio was 90.7% (compared to 90.8% in the previous year), and cash and cash equivalents at the end of the period stood at ¥2,052 million (compared to ¥2,548 million).
- For the lead pipeline, rogocekib (CLK inhibitor), 27 out of 28 patients in the IE cohort of the Phase 1/2 clinical trial were enrolled as of August 2026, with full enrollment of 28 patients completed in September. In Japan, rogocekib also received Orphan Drug Designation for relapsed or refractory Acute Myeloid Leukemia (AML) in August 2026.
- The company has not provided a financial outlook for the fiscal year ending August 2027, stating that it is not possible to make a reasonable estimate at this time.
🤖 AI Perspective
As a biopharmaceutical company in the R&D phase, G-Chordia’s financials reflect an ongoing operating loss due to upfront investments, with no business revenue reported. However, the reduction in operating loss compared to the previous period and the steady progress in clinical trials, particularly with rogocekib, are important indicators for future business development. The Orphan Drug Designations for rogocekib in both Japan and the U.S. could be a key factor for its potential market entry.
198A|G-ポストプライム
168.0
▲ +5.00%
📎 Source:G-ポストプライム Official IR →
This article is an AI-generated summary and analysis of official IR disclosures.
📄 Announcement (AI-Reviewed)
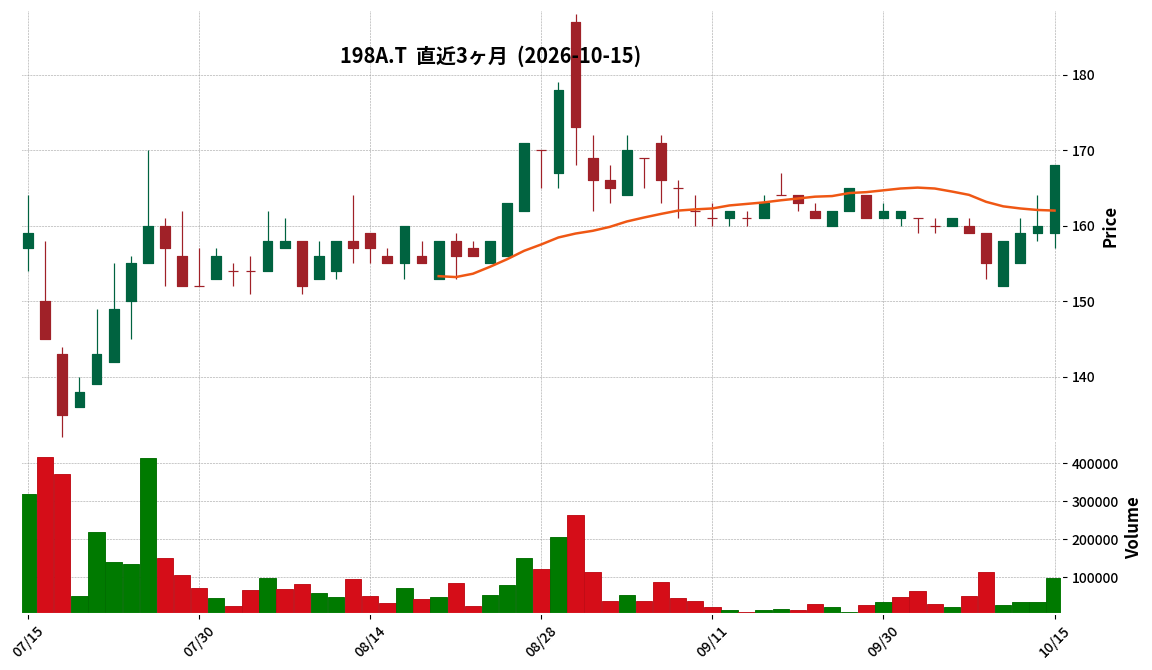
- G-Postprime reported consolidated net sales of ¥84 million for the first quarter of fiscal year 2027 (June 1, 2026 – August 31, 2026), a 49.8% decrease year-on-year.
- For the same period, the company recorded an operating loss of ¥39 million (compared to an operating loss of ¥87 million in the prior year), an ordinary loss of ¥36 million (compared to an ordinary loss of ¥80 million), and a net loss attributable to owners of the parent of ¥41 million (compared to a net loss of ¥83 million in the prior year).
- The “Platform Business” segment generated ¥83 million in sales, a 55.8% decrease year-on-year, and an operating loss of ¥6 million.
- The company decided to withdraw from the “Trading Platform Business” on June 17, 2026, and terminated services by the end of September 2026. This segment reported sales of ¥0 million, a 56.7% decrease year-on-year, and an operating loss of ¥33 million.
- During the first quarter, the company newly consolidated Infinity Life Co., Ltd. and Cube Co., Ltd. Cube Co., Ltd. was in a state of insolvency, with negative equity of ¥669 million, at the end of the first quarter.
🤖 AI Perspective
G-Postprime’s Q1 FY2027 results show a significant year-on-year decline in revenue, yet a reduction in various loss figures. This shift may be attributed to the strategic withdrawal from the Trading Platform Business and the restructuring of its business portfolio through new subsidiaries. The financial status of the newly consolidated Cube Co., Ltd., which is in a state of insolvency, and the ongoing efforts to rebuild the revenue base of the “Platform Business” could be key areas for investors to monitor going forward.
205A|G-ロゴスHD
1564.0
▼ -1.64%
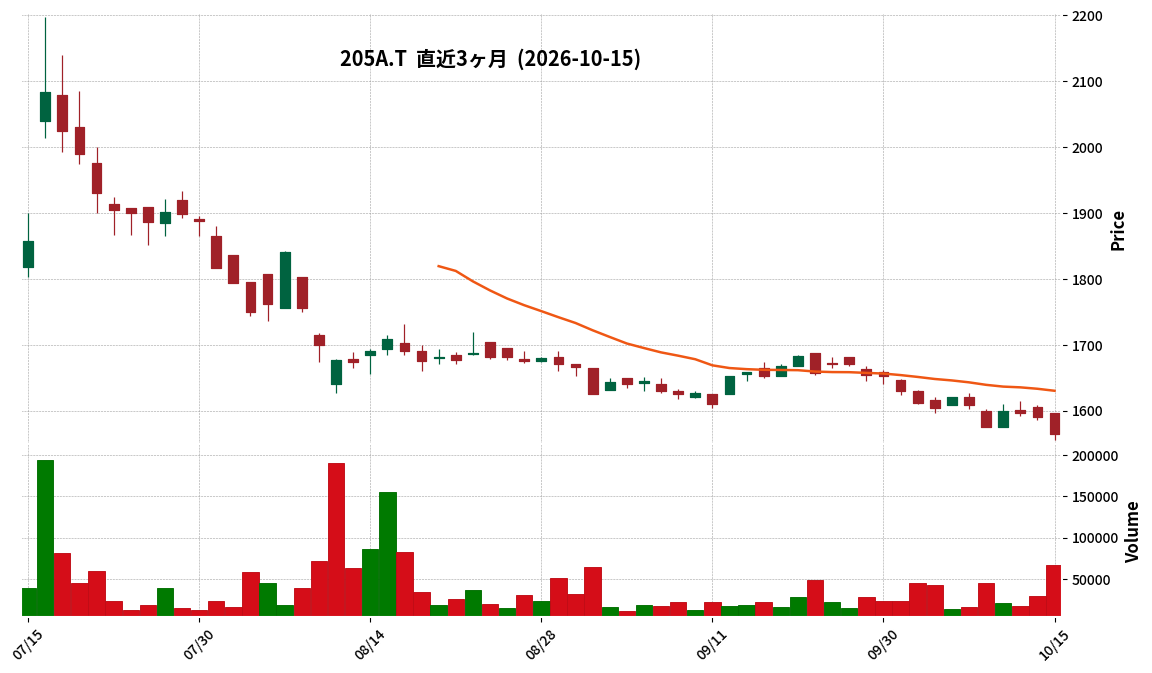
📎 Source:G-ロゴスHD Official IR →
This article is an AI-generated summary and analysis of official IR disclosures.
📄 Announcement (AI-Reviewed)
- For the first quarter of the fiscal year ending May 2027, consolidated net sales were ¥6,058 million, a decrease of 16.1% compared to the prior year’s first quarter.
- The company reported an operating loss of ¥1,019 million (compared to an operating loss of ¥711 million in the prior year) and an ordinary loss of ¥1,063 million (compared to an ordinary loss of ¥738 million in the prior year).
- Net loss attributable to owners of parent was ¥730 million (compared to a net loss of ¥531 million in the prior year).
- Total consolidated assets at the end of the first quarter amounted to ¥26,819 million, an increase of ¥3,593 million from the end of the previous fiscal year, primarily due to increases in uncompleted construction costs by ¥2,966 million and real estate for sale by ¥1,832 million.
- A significant change in the scope of consolidation includes the addition of LHD-1 Co., Ltd. (now Courage Home Co., Ltd.).
🤖 AI Perspective
The reported decline in Q1 revenue and widening losses may be influenced by the characteristic seasonality of the housing business, where sales often concentrate in the fourth quarter due to project completion timings. The increase in total assets, driven by uncompleted construction costs and real estate for sale, could indicate an accumulation of work-in-progress assets expected to convert into future sales. The expansion of the consolidated scope with a new subsidiary might suggest strategic moves towards future business growth.
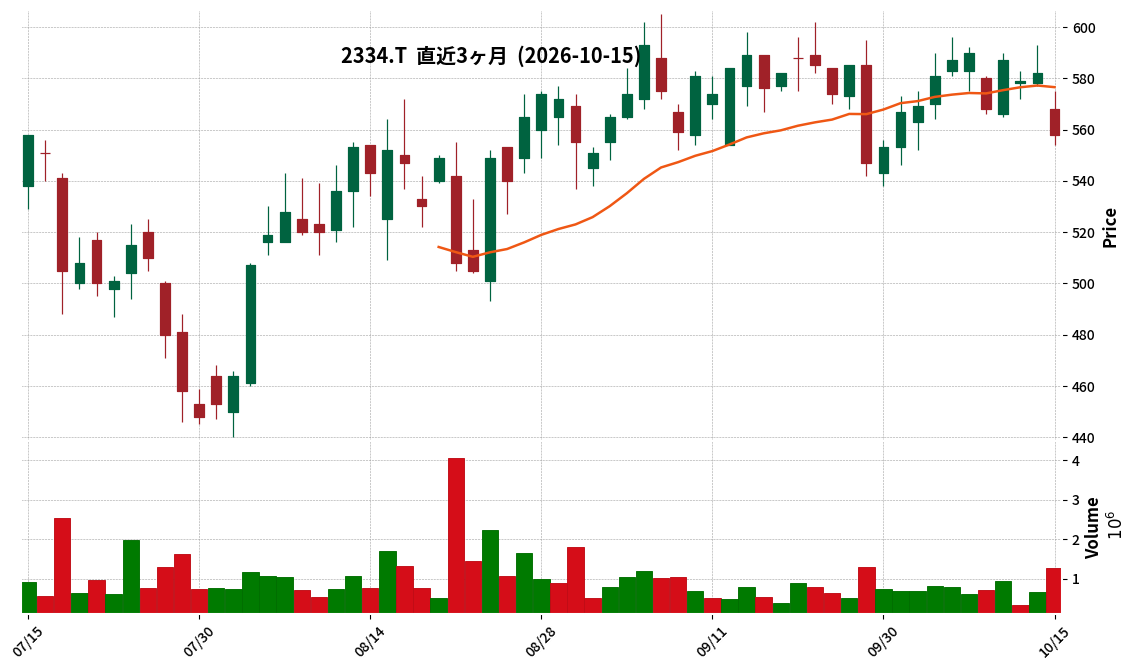
2334|G-イオレ
558.0
▼ -4.12%
This article is an AI-generated summary and analysis of official IR disclosures.
📄 Announcement (AI-Reviewed)
- G-eole resolved to make WOODMAN Co., Ltd. a wholly-owned subsidiary via stock swap at its Board of Directors meeting on October 15, 2026, and signed a stock swap agreement on the same date.
- The effective date of the stock swap is scheduled for November 30, 2026.
- As a result of this stock swap, changes are expected in G-eole’s major shareholders and its largest major shareholder.
- For each share of WOODMAN stock, 5,727.38 shares of G-eole common stock will be allocated, with G-eole delivering an estimated 3,436,428 shares.
- WOODMAN forecasts sales of JPY 12,845 million and operating profit of JPY 350 million for the fiscal year ending September 2026, and possesses technologies such as the “IMMERSIA” immersion cooling solution.
🤖 AI Perspective
This announcement suggests a strategic move by G-eole to bolster its AI Computation Layer (AIDC business), which is central to its “AI Economy” growth strategy. Integrating WOODMAN’s AI data center development and construction capabilities could accelerate the launch of G-eole’s Neo-Cloud business and strengthen its three-layer integrated model. The stock swap method, by minimizing cash outflow and aligning the long-term interests of WOODMAN’s shareholders with G-eole’s, may be seen as a way to maximize the benefits of this integration.
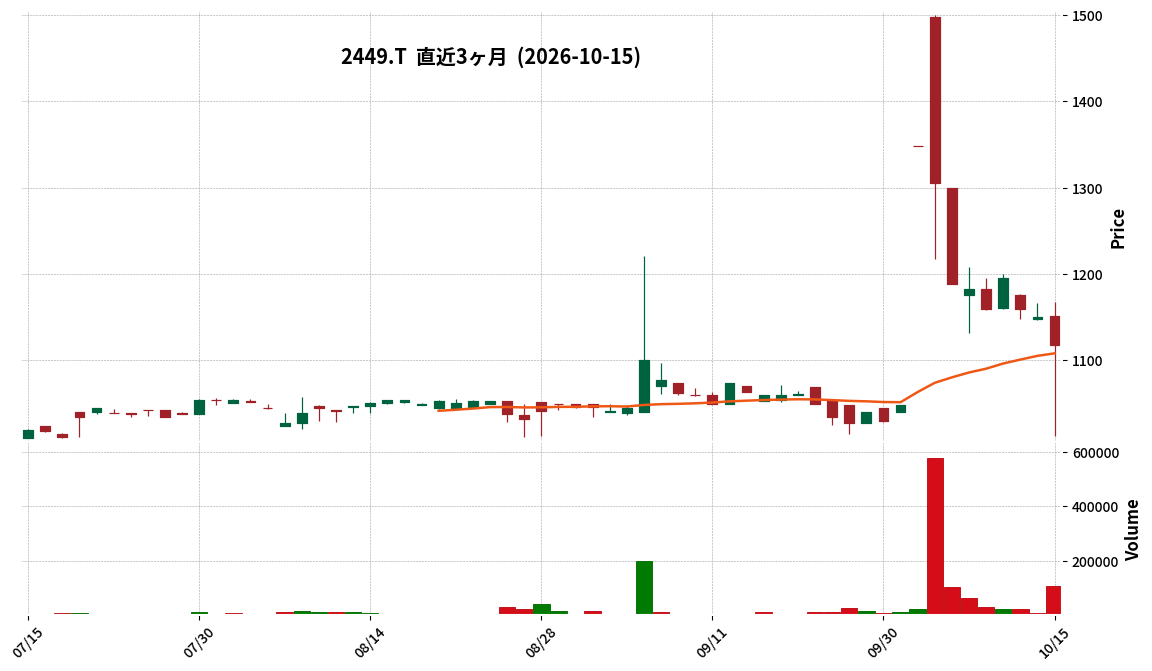
2449|プラップJ
1118.0
▼ -2.78%
This article is an AI-generated summary and analysis of official IR disclosures.
📄 Announcement (AI-Reviewed)
- PRAP Japan Inc. has announced its consolidated financial results for the fiscal year ended August 31, 2026.
- For FY2026, consolidated net sales were ¥7,760 million (up 5.0% year-on-year), operating profit was ¥742 million (up 3.4%), ordinary profit was ¥758 million (up 3.6%), and profit attributable to owners of parent was ¥478 million (up 0.5%).
- Earnings per share for the period were ¥107.55.
- The consolidated performance forecast for FY2027 projects net sales of ¥10,000 million (up 28.9% year-on-year), operating profit of ¥1,100 million (up 48.1%), ordinary profit of ¥1,100 million (up 45.1%), and profit attributable to owners of parent of ¥620 million (up 29.6%).
- The year-end dividend was ¥43.00 per share, making the annual total dividend ¥43.00.
🤖 AI Perspective
PRAP Japan’s FY2026 results show an increase in net sales, operating profit, ordinary profit, and profit attributable to owners of parent, indicating growth across key financial metrics. A notable point for investors is the robust forecast for FY2027, projecting a 28.9% increase in net sales and a 48.1% increase in operating profit, suggesting the company anticipates significant future expansion. This outlook may imply that strategic business enhancements and investments in the digital sector, aligned with the company’s medium-term management plan, are expected to contribute substantially to future earnings.
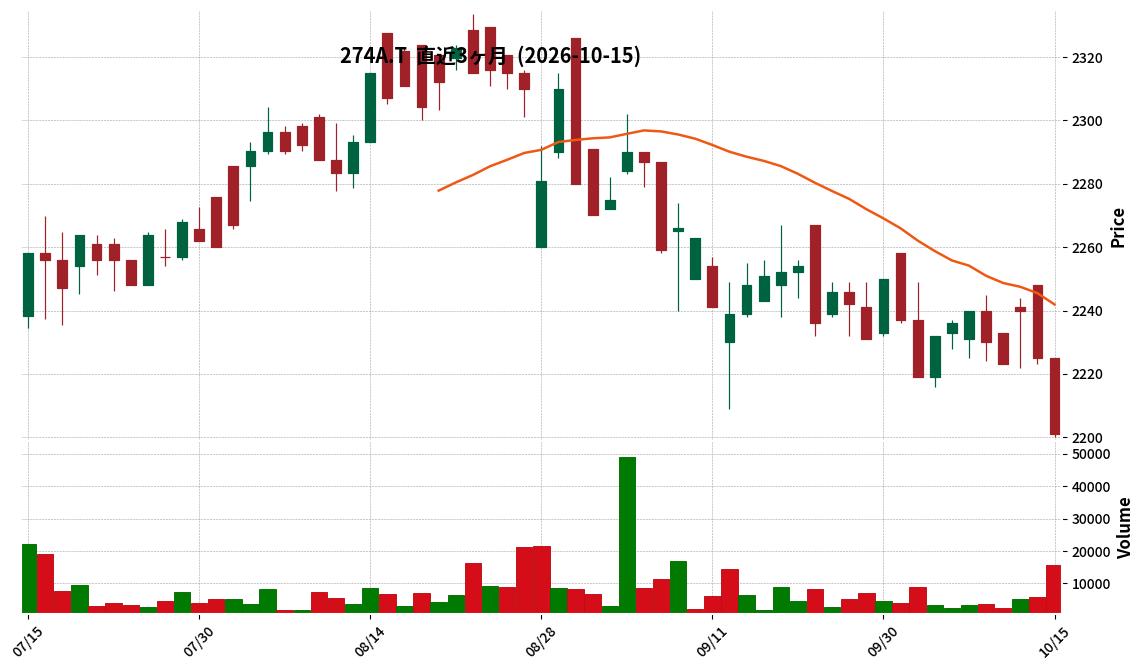
274A|ガーデン
2201.0
▼ -1.08%
This article is an AI-generated summary and analysis of official IR disclosures.
📄 Announcement (AI-Reviewed)
- Garden Co., Ltd. announced its non-consolidated financial results for the second quarter (interim period) of the fiscal year ending February 2027.
- Net sales for the interim period amounted to ¥9,518 million, representing a 7.9% increase compared to the same period last year.
- Operating profit was ¥217 million (a 72.9% decrease year-on-year), ordinary profit was ¥138 million (an 81.7% decrease), and interim net profit was ¥101 million (a 79.6% decrease).
- Interim basic earnings per share decreased to ¥14.19 from ¥72.16 in the prior year’s interim period.
- The full-year forecast for FY2027 has been revised, projecting net sales of ¥19,450 million, operating profit of ¥430 million, ordinary profit of ¥280 million, and net profit of ¥10 million.
- As of the end of the interim period, total assets stood at ¥19,886 million, net assets at ¥7,428 million, and the equity ratio was 37.4%.
- During the period, Garden opened 26 new stores (13 directly managed, 13 franchised) and closed 5, resulting in a total of 220 stores at the end of the interim period.
🤖 AI Perspective
While sales show an increase, the significant decline in profits may suggest increased investment in strategic initiatives such as new store openings, the “Ikkakuya” and “Abura Soba Sohonten” hybrid strategy, and M&A activities aimed at brand expansion. Investors may want to monitor the company’s ability to translate these growth strategies into improved profitability in the latter half of the fiscal year, especially given the revised full-year forecast.
277A|グロービング
1696.0
▼ -5.04%
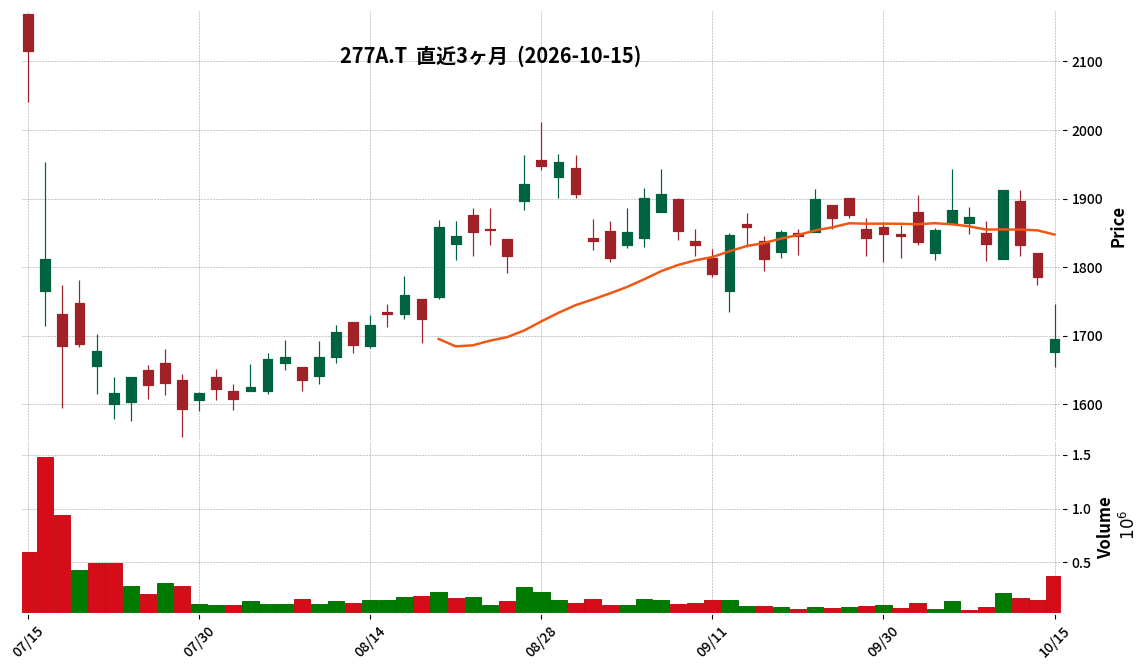
This article is an AI-generated summary and analysis of official IR disclosures.
📄 Announcement (AI-Reviewed)
- GLOBE-ING announced its consolidated financial results for the first quarter of FY2027 (June 1, 2026 to August 31, 2026).
- Revenue was ¥3,212 million, an increase of 20.8% compared to the same period of the previous year.
- Operating profit was ¥923 million, a decrease of 3.1% compared to the same period of the previous year.
- Profit attributable to owners of the parent for the quarter was ¥631 million, down 2.6% year-on-year.
- The consolidated full-year earnings forecast (Revenue ¥16,100 million, Operating Profit ¥4,830 million, Profit attributable to owners of the parent ¥3,381 million) and dividend forecast (year-end ¥21.40, total annual ¥35.60) remain unchanged from the latest announcement.
- The Consulting business reported external customer revenue of ¥3,134 million (up 21.7% year-on-year) and segment profit of ¥1,268 million (up 9.6%).
- The AI business reported external customer revenue of ¥78 million (down 7.9% year-on-year) and segment profit of ¥31 million (down 46.5%).
🤖 AI Perspective
GLOBE-ING’s first quarter showed robust revenue growth but a decline in operating profit, which may indicate increasing operational costs or strategic investments. The AI business, in particular, experienced a decrease in both revenue and profit, which could be a factor in the overall profit reduction. However, the Consulting business continues to demonstrate solid growth, contributing significantly to the company’s top-line expansion.
2798|Y’s
2993.0
▼ -0.23%
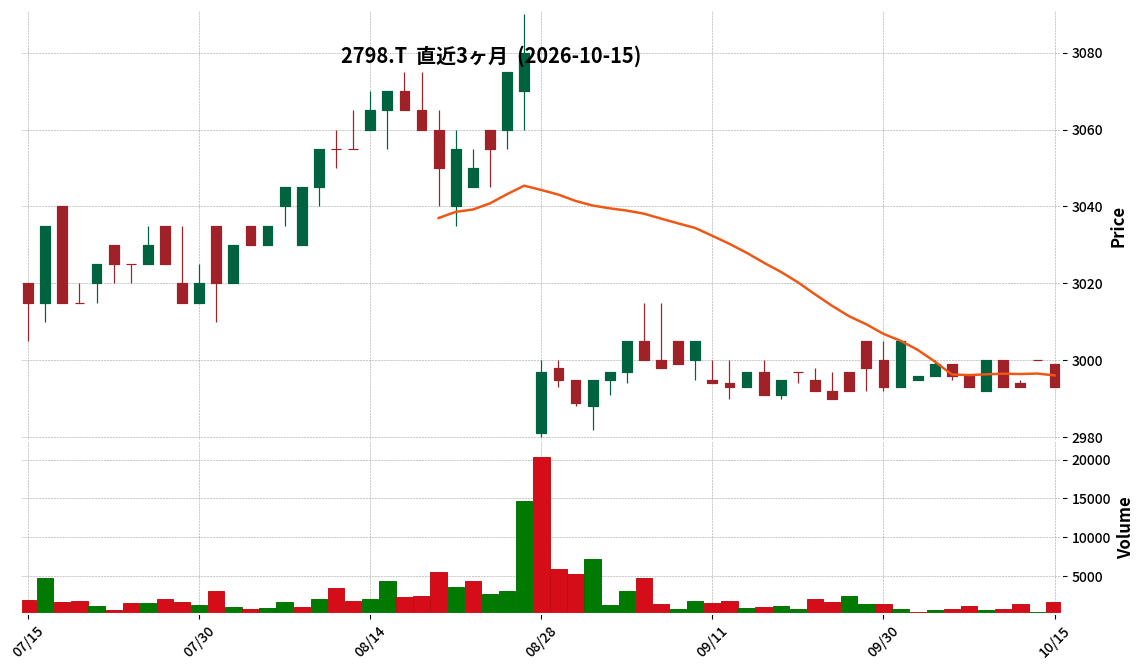
This article is an AI-generated summary and analysis of official IR disclosures.
📄 Announcement (AI-Reviewed)
- Y’s reported consolidated net sales of ¥7,069 million for the second quarter of the fiscal year ending February 2027, representing a 9.8% increase compared to the same period last year.
- Operating profit reached ¥157 million (+63.6% YoY), and ordinary profit was ¥168 million (+32.3% YoY).
- Net income attributable to owners of parent significantly increased to ¥382 million (+218.1% YoY).
- The full-year consolidated earnings forecast for the fiscal year ending February 2027 has been revised upwards, projecting net sales of ¥14,649 million (+12.3% YoY) and net income attributable to owners of parent of ¥536 million (+161.2% YoY).
- From this interim period, Y’s consolidated Yamano-ue Hotel Co., Ltd. (deemed acquisition date: May 31, 2026).
2934|G-Jフロンティア
1982.0
▲ +0.76%
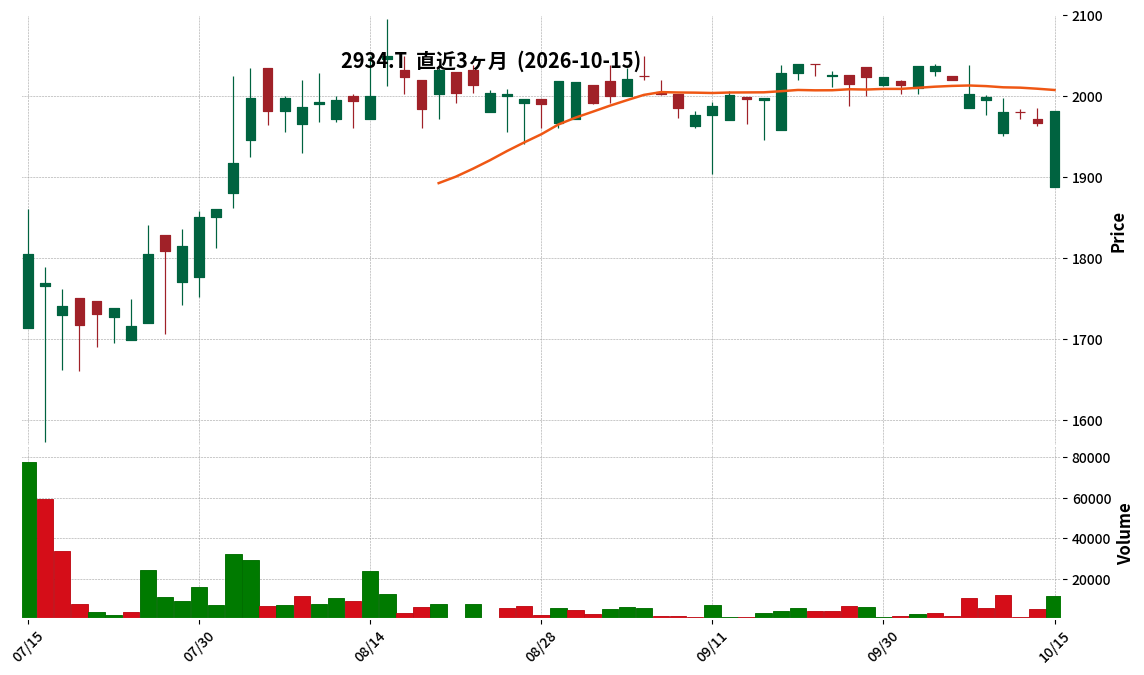
📎 Source:G-Jフロンティア Official IR →
This article is an AI-generated summary and analysis of official IR disclosures.
📄 Announcement (AI-Reviewed)
- G-J Frontier announced its consolidated financial results for the first quarter of the fiscal year ending May 2027 (June 1, 2026, to August 31, 2026).
- Net sales reached ¥5,899 million, representing an 18.0% increase compared to the same quarter of the previous fiscal year.
- EBITDA amounted to ¥236 million, marking an 89.7% increase year-on-year.
- Operating income turned profitable at ¥83 million (compared to an operating loss of ¥17 million in the prior year’s Q1), and ordinary income also turned profitable at ¥68 million (compared to an ordinary loss of ¥4 million in the prior year’s Q1).
- Net loss attributable to parent company shareholders was ¥10 million, a reduction from the ¥36 million loss reported in the same quarter of the previous year.
- The full-year consolidated earnings forecast remains unchanged from the most recently published figures, projecting net sales of ¥26,500 million, EBITDA of ¥1,700 million, operating income of ¥1,050 million, ordinary income of ¥1,000 million, and net income attributable to parent company shareholders of ¥550 million.
🤖 AI Perspective
G-J Frontier’s Q1 FY2027 results show significant growth in net sales and EBITDA, alongside a return to profitability for operating and ordinary income. This performance appears to be driven by the advancement of its “SOKUYAKU Healthcare Economic Zone,” centered on its online medical consultation and medication guidance platform, as well as progress in its D2C and B2B businesses. While the company continues to report a net loss, the reduction in its magnitude could suggest a positive trend in its path towards sustained profitability.
2936|G-ベースフード
275.0
▼ -0.72%
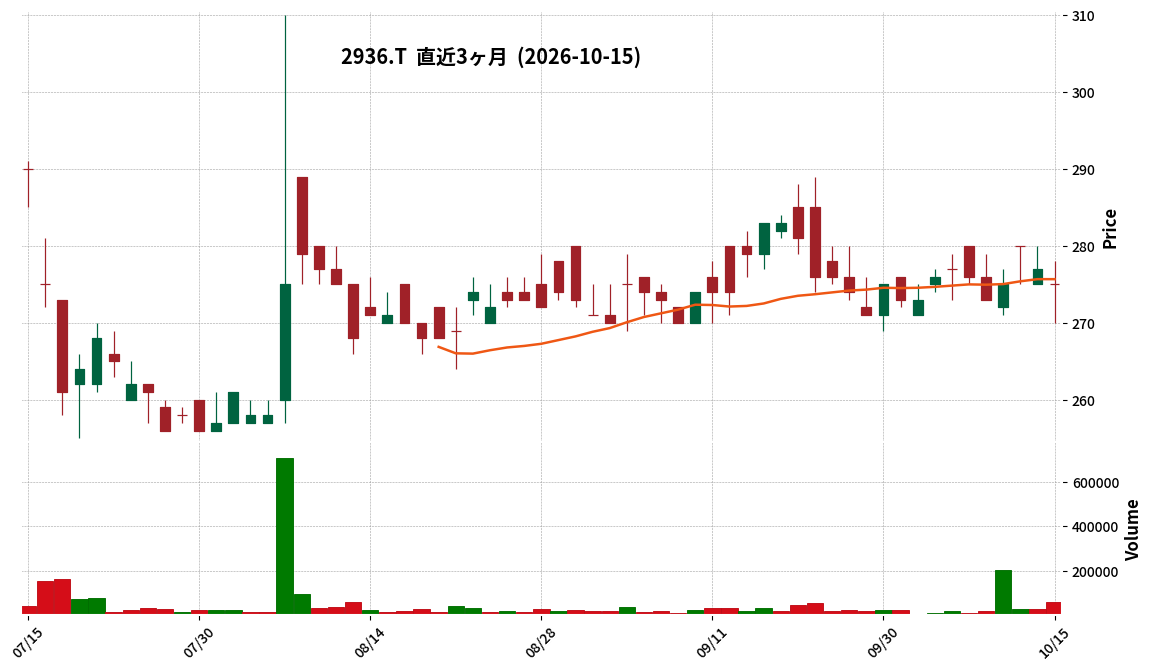
📎 Source:G-ベースフード Official IR →
This article is an AI-generated summary and analysis of official IR disclosures.
📄 Announcement (AI-Reviewed)
- Base Food Inc. announced its financial results for the second quarter (interim period) of the fiscal year ending February 2027 (March 1, 2026, to August 31, 2026).
- Net sales for the interim period reached ¥8,352 million, marking an 8.5% increase compared to the same period in the previous year.
- The company reported an operating loss of ¥194 million, an ordinary loss of ¥195 million, and a net loss of ¥255 million, indicating an expansion of losses compared to the prior year’s interim period.
- Subscription members for direct-to-consumer (D2C) channels increased to 259,000, and the number of retail stores for wholesale sales expanded to 49,633, both showing an increase from the end of the previous quarter.
- The full-year forecast remains unchanged, projecting net sales of ¥16,256 million (up 7.0% year-on-year) and operating profit of ¥62 million (down 71.4% year-on-year), with net sales progress at 51.4% as of the end of Q2.
🤖 AI Perspective
G-BASE FOOD’s Q2 FY2027 results show solid sales growth, with progress towards the full-year sales target exceeding the planned pace, which is a key positive. The expansion of operating and net losses is attributed to a decrease in gross profit margin due to sales strategy revisions, increased advertising investment for new customer acquisition, and R&D expenditures, suggesting these investments are strategic for future growth. The rise in both subscription members and retail store count may indicate an expanding operational footprint and customer base.
304A|G-フォルシア
2138.0
▼ -0.09%
📎 Source:G-フォルシア Official IR →
This article is an AI-generated summary and analysis of official IR disclosures.
📄 Announcement (AI-Reviewed)
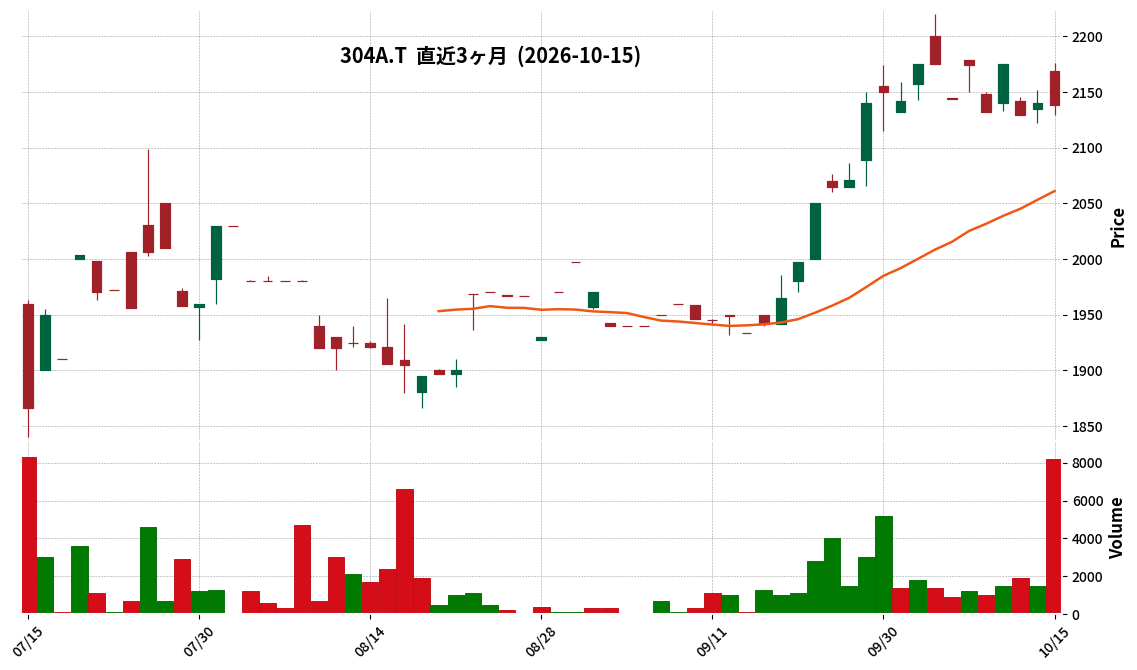
- FORCIA Inc. (G-FORCIA) has announced its financial results for the second quarter (interim period) of the fiscal year ending February 2027.
- Net sales reached JPY 1,806 million, marking a 64.5% increase compared to the same interim period of the previous year.
- Operating profit was JPY 345 million (up 933.1% year-on-year), ordinary profit was JPY 348 million (up 896.9% year-on-year), and interim net income was JPY 202 million (up 830.9% year-on-year).
- The company attributed the strong performance to progress in multiple projects for major clients and the booking of sales from certain large-scale projects due to a revision in revenue recognition timing in the previous fiscal year.
- The full-year business forecast remains unchanged from the announcement made on April 14, 2026, in the “Financial Results for the Fiscal Year Ended February 2026.”
🤖 AI Perspective
This interim report shows substantial year-over-year growth across net sales and all profit metrics, indicating significant business expansion. The remarkable 933.1% increase in operating profit specifically suggests a strong improvement in profitability. Factors cited include advancements in key customer projects and adjustments in revenue recognition, which may be important for evaluating the sustainability and stability of future business performance.
3223|エスエルディー
1000.0
▲ +0.00%
📎 Source:エスエルディー Official IR →
This article is an AI-generated summary and analysis of official IR disclosures.
📄 Announcement (AI-Reviewed)
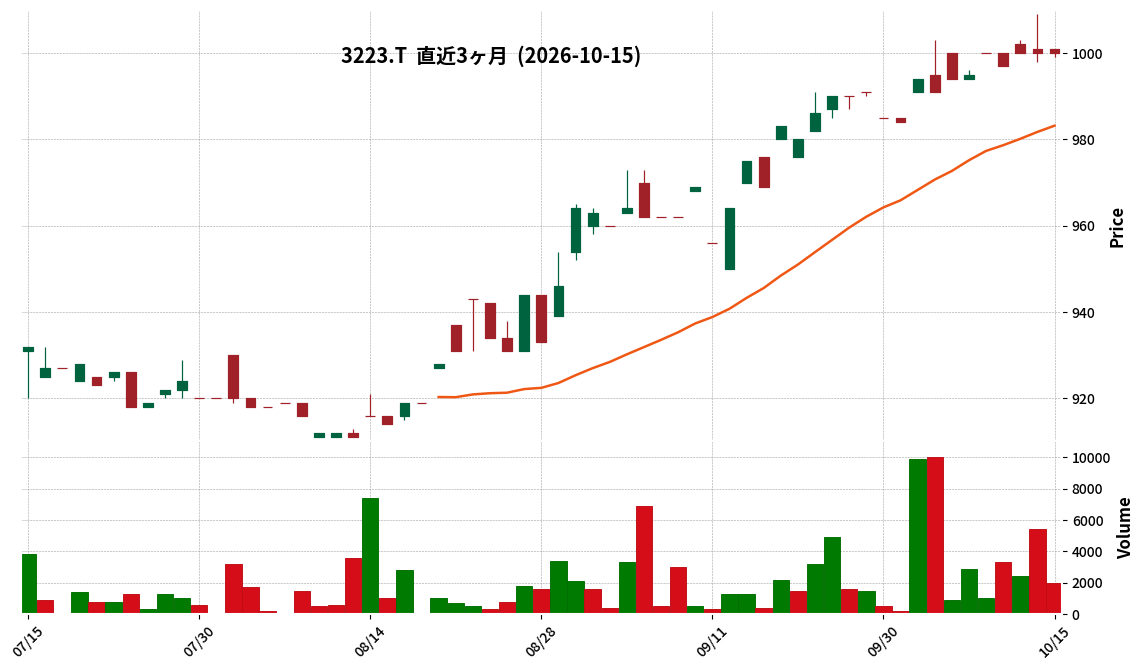
- SLD Inc. announced its unaudited non-consolidated financial results for the second quarter (interim period) of the fiscal year ending February 2027.
- For the interim period, net sales were ¥1,721 million, representing a 7.5% decrease compared to the same period last year.
- Operating income decreased by 63.1% year-on-year to ¥33 million, and ordinary income decreased by 62.3% to ¥35 million.
- The company reported an interim net loss of ¥15 million, a decline from the ¥82 million net profit in the prior year’s interim period.
- The full-year earnings forecast for the fiscal year ending February 2027 has been revised, projecting net sales of ¥3,307 million (down 9.5% year-on-year) and a net loss of ¥52 million.
🤖 AI Perspective
The reported decline in revenue and profits, culminating in an interim net loss, suggests challenges in both the food and beverage and content planning services segments, potentially influenced by external factors such as weather and cost increases, as well as underperforming temporary collaboration cafes. The downward revision of the full-year forecast indicates that these challenges are expected to persist, making future strategic initiatives to improve business performance a key area for investors to monitor.
325A|G-TENTIAL
1932.0
▲ +0.21%
📎 Source:G-TENTIAL Official IR →
This article is an AI-generated summary and analysis of official IR disclosures.
📄 Announcement (AI-Reviewed)
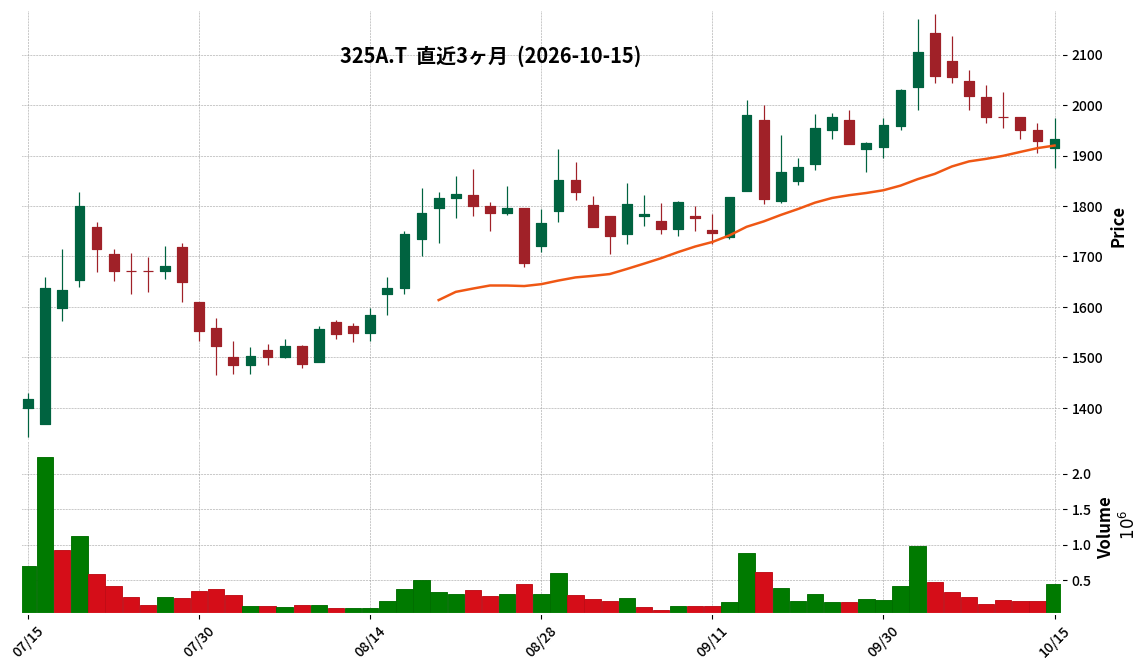
- G-TENTIAL announced its financial results (non-consolidated) for the fiscal year ended August 2026 (September 1, 2025 – August 31, 2026).
- For FY2026 August, revenue was ¥33,218 million, operating profit was ¥3,818 million, ordinary profit was ¥3,819 million, and net profit was ¥2,402 million.
- Due to a change in the fiscal year-end date, the comparative period for FY2025 August differs, thus year-on-year percentage changes are not provided.
- Basic earnings per share were ¥106.16, and the equity ratio was 52.7%.
- For the FY2027 August, the company forecasts revenue of ¥41,000-45,000 million, operating profit of ¥4,100-5,300 million, ordinary profit of ¥4,093-5,293 million, and net profit of ¥2,783-3,599 million.
🤖 AI Perspective
G-TENTIAL’s FY2026 August results provide clear figures for revenue and profits, indicating the company’s operational scale and profitability. The report highlights strong sales of its “BAKUNE” recovery wear series and new product developments as key contributors to its performance. The disclosed FY2027 August forecast could offer insights into the company’s future strategic direction and growth aspirations for investors to consider.
339A|G-プログレス
843.0
▼ -7.57%
📎 Source:G-プログレス Official IR →
This article is an AI-generated summary and analysis of official IR disclosures.
📄 Announcement (AI-Reviewed)
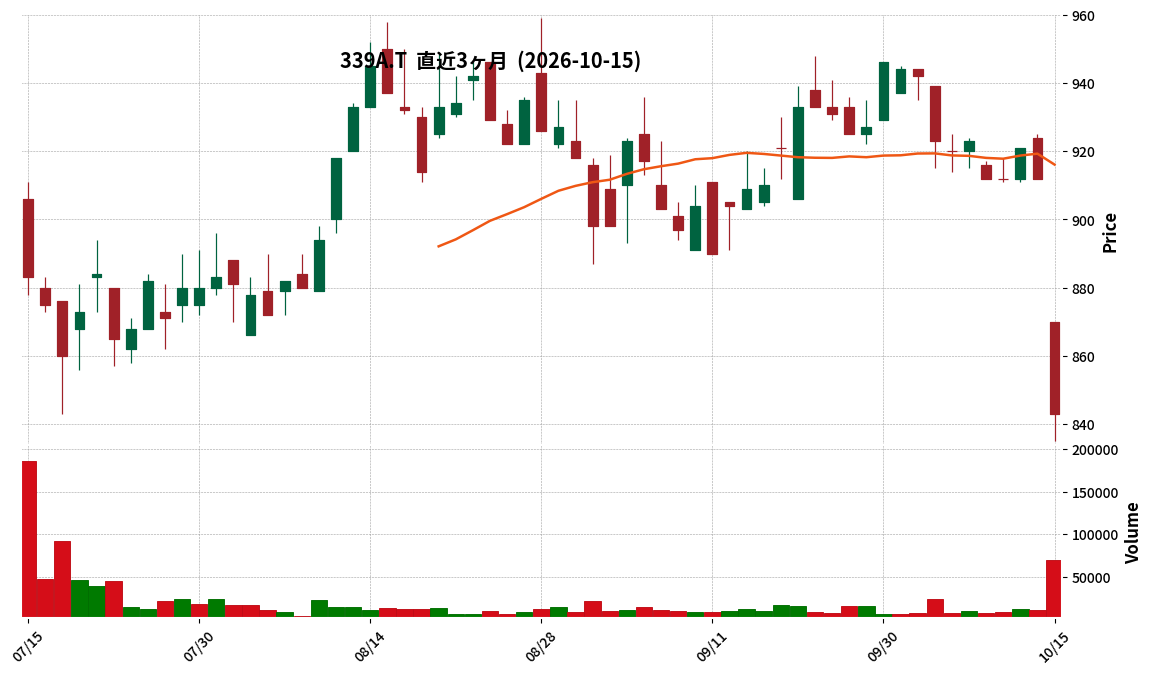
- G-PROGRESS released the presentation script for the Q2 FY2027 earnings briefing on October 15, 2026.
- For the first half of FY2027, consolidated net sales were ¥3,000 million (up 0.9% YoY) and consolidated gross profit was ¥1,271 million (down 1.6% YoY).
- The solution ratio, which combines net sales from the Solution and Digital Twin businesses, increased by 1.7 percentage points YoY to 59.5% of consolidated net sales.
- The progress rate against full-year forecasts as of Q2 was 43.5% for net sales and 34.9% for operating income, deemed on track due to an expected concentration of project acceptances in the second half.
- The number of personnel in the Solution business increased by 12.7% YoY to 221 as of August 2026, attributed to new hires and transfers from the Engineering business.
- The consolidated gross profit margin was 42.4%, with an expectation for improvement as project acceptances in the Solution business progress.
🤖 AI Perspective
Despite uncertainties in the manufacturing sector leading to a concentration of project acceptances in the second half, the company indicates steady progress in increasing its solution ratio and meeting full-year forecasts. The expansion of Solution business personnel and the integration of AI with digital twin technology appear to be key elements of their growth strategy. While a temporary decrease in per-person sales unit price and gross profit margin is noted, these are expected to improve with the progression of project acceptances in the latter half of the fiscal year.
Disclaimer: This article is for informational purposes only and does not constitute investment advice.
340A|G-ジグザグ
319.0
▼ -1.24%
This article is an AI-generated summary and analysis of official IR disclosures.
📄 Announcement (AI-Reviewed)
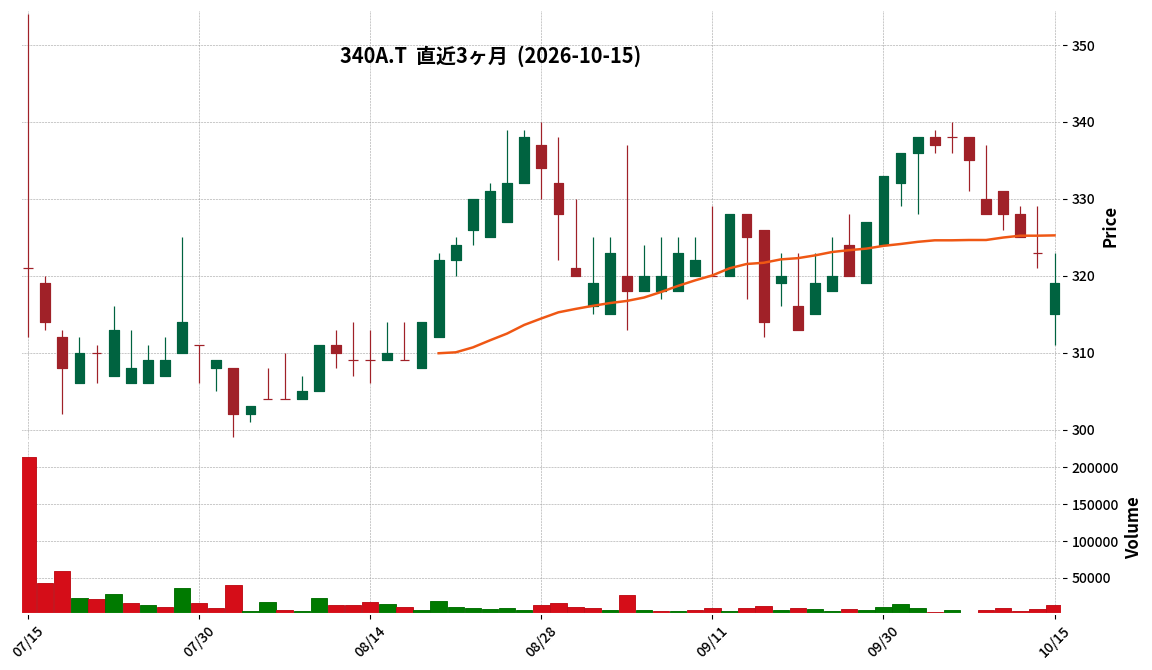
- G-zigzag, Inc. reported revenue of ¥420 million for the first quarter of fiscal year 2027, representing a 25% increase year-on-year and a new record for quarterly revenue.
- Operating profit for the same period was ¥50 million, a decrease of 10% compared to the previous year’s corresponding quarter.
- Progress rates against full-year forecasts were 23% for revenue and 26% for operating profit.
- Gross Merchandise Volume (GMV) increased by 25% year-on-year, with all regions showing growth, including Asia remaining robust, North America increasing by 36%, and Europe by 40%.
- The decline in operating profit was attributed to strategic investments made as planned to strengthen the customer acquisition capabilities of partner shops.
🤖 AI Perspective
G-zigzag’s Q1 FY2027 results indicate continued robust growth in revenue, reaching a new quarterly record. The decrease in operating profit, attributed to strategic upfront investments, may suggest a focus on future expansion rather than short-term profitability. The significant GMV growth in North America and Europe, in addition to strong performance in Asia, could indicate successful regional strategies and diversification.
3440|日創グループ
850.0
▼ -0.47%
This article is an AI-generated summary and analysis of official IR disclosures.
📄 Announcement (AI-Reviewed)
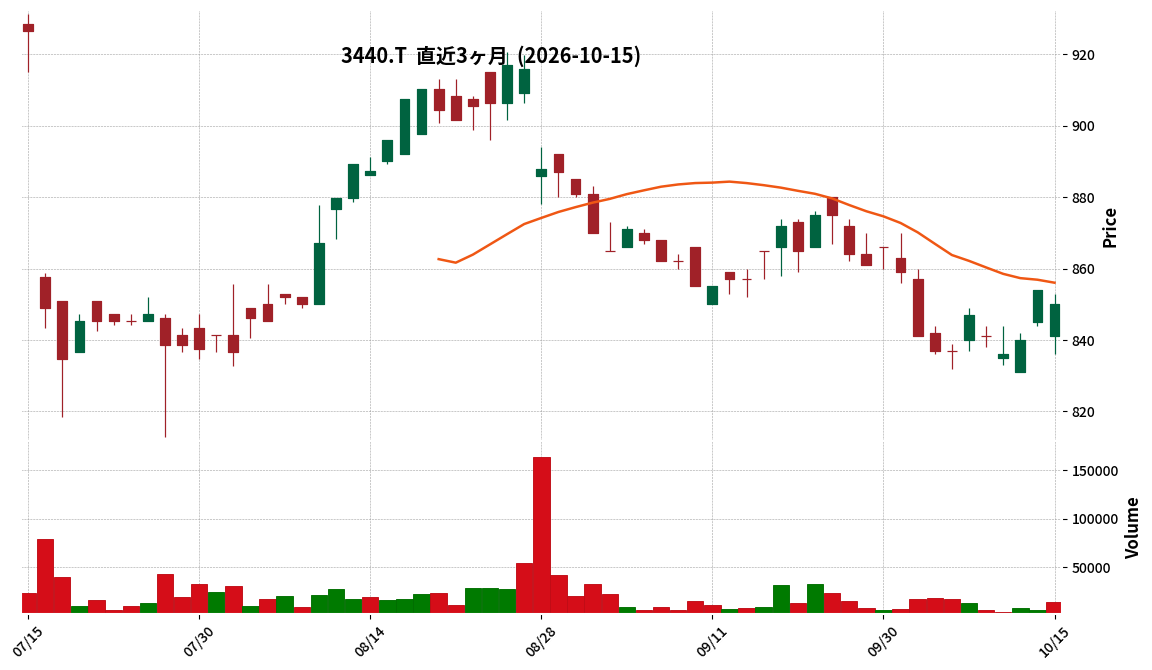
- Nisso Group reported consolidated financial results for the fiscal year ended August 2026, with net sales of ¥21,512 million (down 6.6% year-on-year), operating profit of ¥620 million (down 55.1%), ordinary profit of ¥605 million (down 56.8%), and net profit attributable to owners of parent of ¥517 million (down 43.6%).
- Consolidated EBITDA for the fiscal year ended August 2026 was ¥1,648 million (down 23.1% year-on-year), and ROE was 4.0% (down 3.4 percentage points).
- The annual dividend per share was ¥42.00 (compared to ¥40.00 in the previous fiscal year).
- For the fiscal year ending August 2027, the company forecasts consolidated net sales of ¥27,000 million (up 25.5% year-on-year), operating profit of ¥900 million (up 45.0%), ordinary profit of ¥730 million (up 20.6%), and net profit attributable to owners of parent of ¥260 million (down 49.7%).
- Effective from the current consolidated fiscal year, the company included B SLASH HOLDINGS Co., Ltd. and its subsidiaries in the scope of consolidation and changed the name of the reporting segment from “Tile Business” to “Lifestyle Business.”
🤖 AI Perspective
The fiscal year ended August 2026 saw a decline in sales and various profit metrics compared to the previous year, which may be attributed to a rebound from concentrated large-scale projects in the prior period and reduced metal sandwich panel sales. However, certain businesses benefited from subsidiary contributions, and the scope of consolidation was also modified. While the forecast for the next fiscal year projects an increase in sales and operating profit, the anticipated decrease in net profit attributable to owners of parent suggests a potential impact from changes in the business portfolio that could be worth monitoring.
3548|バロック
645.0
▲ +0.00%
This article is an AI-generated summary and analysis of official IR disclosures.
📄 Announcement (AI-Reviewed)
- Baroque Japan Limited (3548) announced its consolidated financial results for the second quarter of fiscal year 2027 (interim period: March 1, 2026, to August 31, 2026).
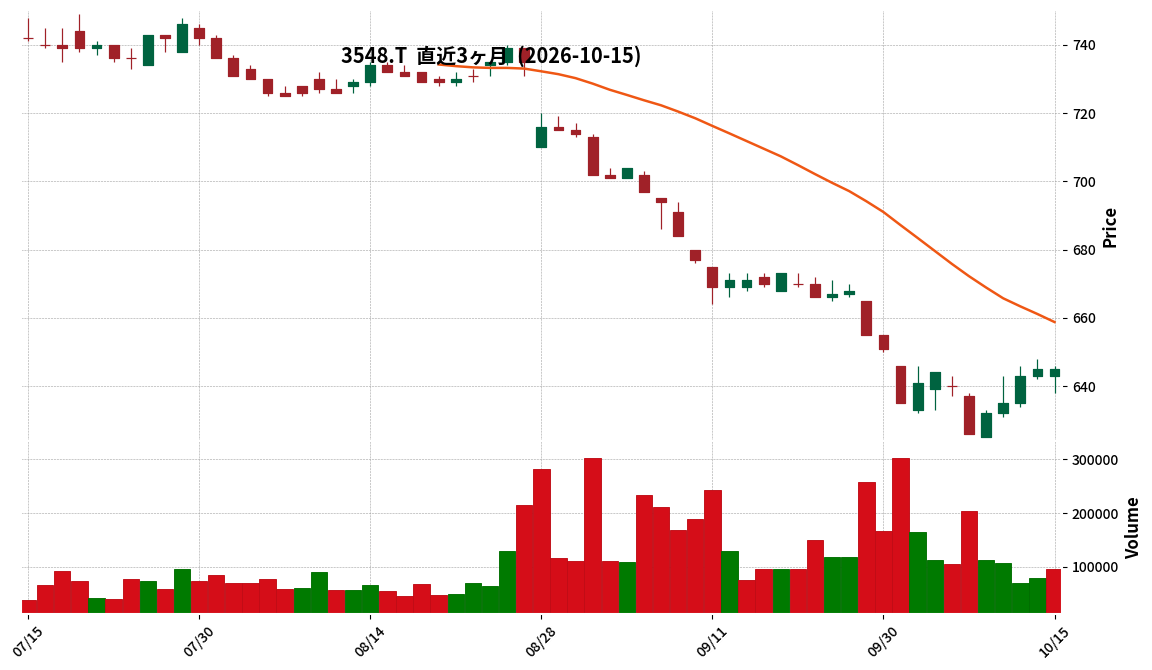
- Consolidated net sales amounted to ¥23,469 million, representing a 5.4% decrease compared to the same period of the previous year.
- The company reported an operating loss of ¥904 million (compared to a loss of ¥77 million in the prior year’s interim period) and an ordinary loss of ¥1,028 million (compared to a loss of ¥15 million in the prior year’s interim period).
- Net loss attributable to owners of parent was ¥1,495 million (compared to a profit of ¥11 million in the prior year’s interim period).
- The full-year consolidated earnings forecast has been revised, projecting net sales of ¥50,832 million (a 1.3% decrease year-on-year), operating profit of ¥111 million (a 65.4% decrease year-on-year), and a net loss attributable to owners of parent of ¥696 million.
🤖 AI Perspective
The decrease in consolidated net sales and the widening operating loss during the interim period appear to be key highlights of this earnings release. The domestic business faced challenges, including a sales decline for AZUL BY MOUSSY and EC shipping delays due to new system implementation, despite some brands achieving increased same-store sales. The downward revision of the full-year earnings forecast, projecting a net loss, may suggest a cautious outlook on future business conditions.
3645|メディカルネット
254.0
▼ -0.39%
📎 Source:メディカルネット Official IR →
This article is an AI-generated summary and analysis of official IR disclosures.
📄 Announcement (AI-Reviewed)
- Medical Net Co., Ltd. announced its consolidated financial results for the first quarter of the fiscal year ending May 2027 (June 1, 2026, to August 31, 2026).
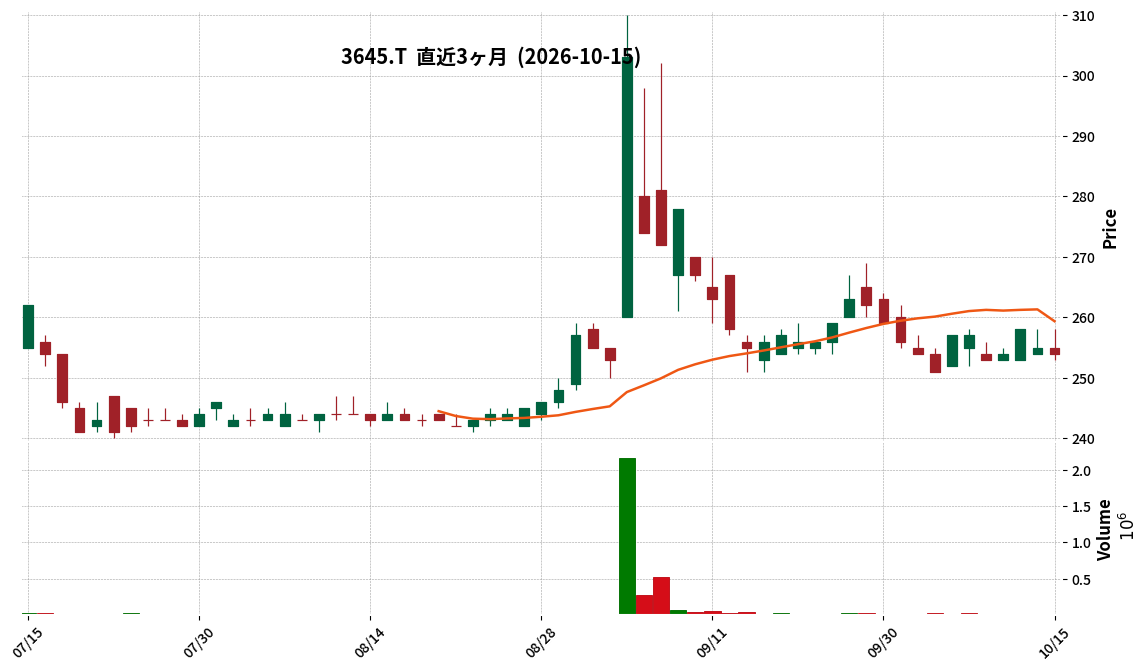
- Consolidated net sales for the first quarter totaled ¥1,554 million, representing a 0.4% decrease compared to the same period in the previous year.
- The company reported an operating loss of ¥21 million (compared to an operating profit of ¥24 million in the prior year period), an ordinary loss of ¥36 million (compared to an ordinary profit of ¥53 million), and a net loss attributable to parent company shareholders of ¥42 million (compared to a net profit of ¥21 million).
- Sales in the Media & Platform business segment were ¥206 million (down 18.8% year-on-year), with a segment profit of ¥74 million (down 40.8% year-on-year).
- Within the Healthcare Institution Management Support business, the dental clinic operation division, specifically the three clinics in Thailand, reported an increase in total sales compared to the prior year period.
🤖 AI Perspective
Medical Net’s Q1 FY2027 results show a slight decline in revenue and a shift to losses at each profit level, which may indicate the impact of decelerated advertising spend in the Media & Platform business. The company’s proactive investments in content enhancement, AI system improvements, and new service development, as well as foreign exchange losses, appear to be influencing profitability. Investors may wish to monitor the progress of these strategic investments and their potential to drive future growth.
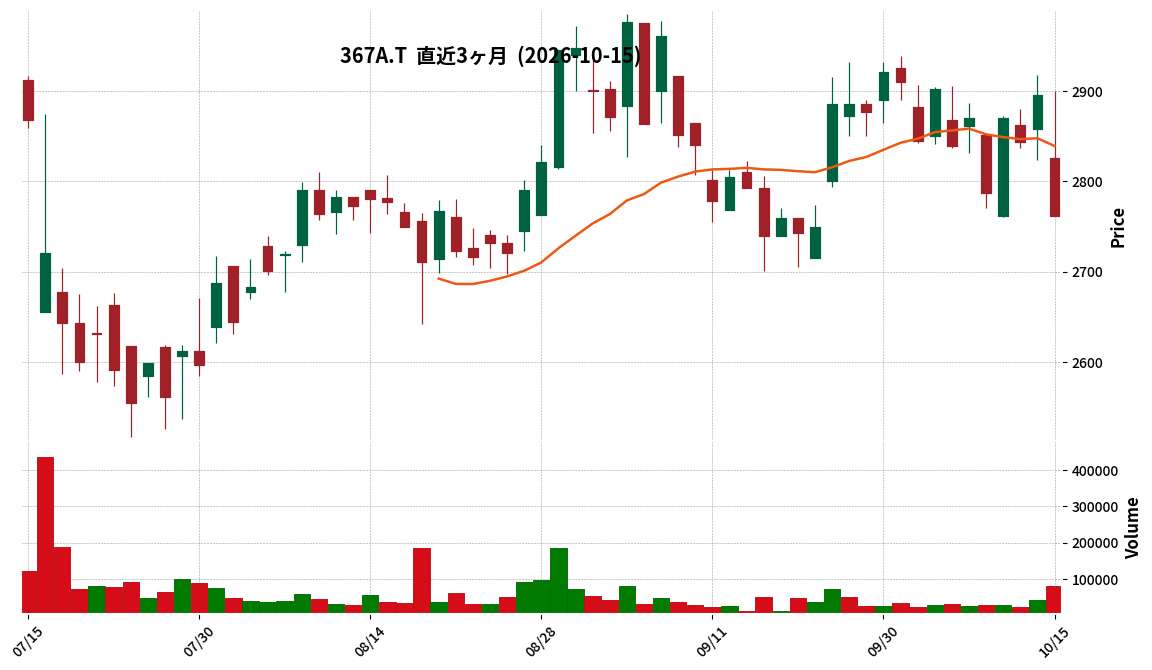
367A|プリモGHD
2762.0
▼ -4.63%
This article is an AI-generated summary and analysis of official IR disclosures.
📄 Announcement (AI-Reviewed)
- Primo Global Holdings announced its consolidated financial results for the fiscal year ended August 31, 2026 (September 1, 2025 – August 31, 2026).
- Consolidated revenue was ¥31,571 million (up 12.7% year-on-year), operating profit was ¥3,903 million (up 24.6% year-on-year), and profit attributable to owners of parent was ¥2,395 million (up 34.1% year-on-year).
- Basic earnings per share for FY2026 was ¥273.23, and diluted earnings per share was ¥259.00.
- The annual dividend per share was ¥120.00 (interim ¥60.00, year-end ¥60.00), an increase from ¥105.00 in FY2025.
- For the fiscal year ending August 31, 2027, the company forecasts consolidated revenue of ¥34,800 million (up 10.2% year-on-year) and profit attributable to owners of parent of ¥2,900 million (up 21.1% year-on-year).
- One new entity, Primo Diamond Malaysia Sdn. Bhd., was added to the scope of consolidation during the period.
🤖 AI Perspective
Primo Global Holdings demonstrated robust growth in FY2026, achieving double-digit increases across revenue and profit categories, reaching record highs. This performance indicates the company’s success in accelerating its mid-term management plan goals by one year, likely driven by enhanced brand value both domestically and internationally, alongside new store openings in overseas markets. The ability to mitigate the impact of rising precious metal prices on gross profit margin through product price revisions and cost improvement initiatives appears to be a noteworthy aspect of these results.
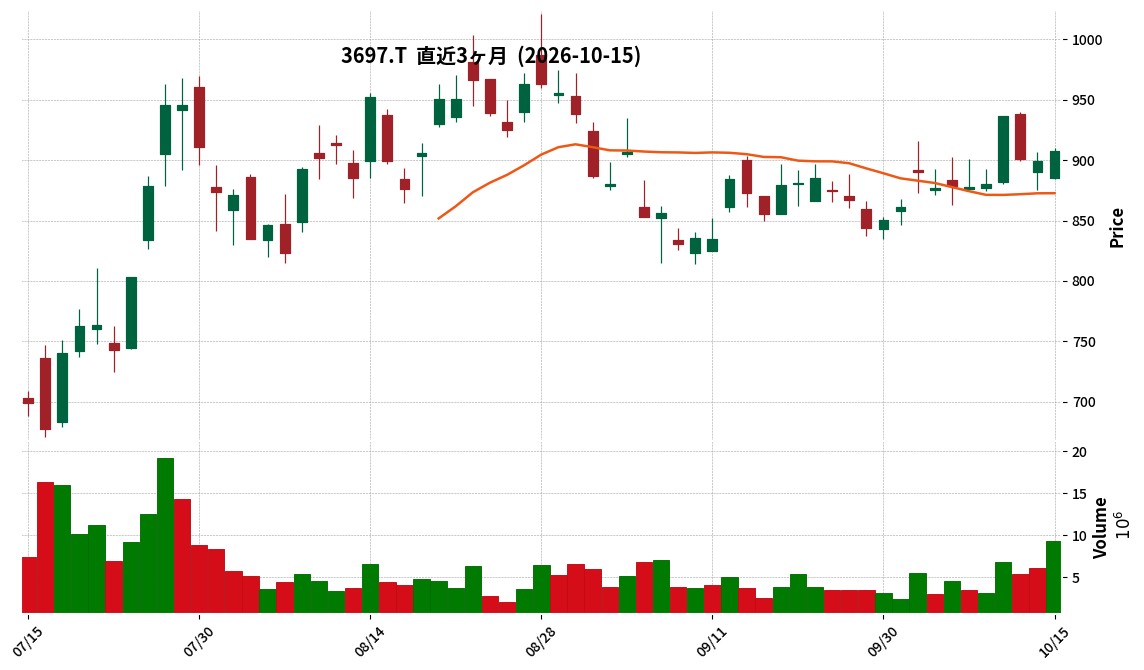
3697|SHIFT
908.0
▲ +0.94%
This article is an AI-generated summary and analysis of official IR disclosures.
📄 Announcement (AI-Reviewed)
- SHIFT Inc. announced its consolidated financial results for the fiscal year ended August 31, 2026 (September 1, 2025 to August 31, 2026).
- Net sales reached ¥161,600 million (up 24.5% year-on-year), and operating profit was ¥17,445 million (up 11.6% year-on-year).
- Ordinary profit decreased to ¥13,320 million (down 12.3% year-on-year), and net income attributable to owners of the parent decreased to ¥7,430 million (down 16.8% year-on-year).
- The annual dividend for FY2026 was ¥4.53 per share for the year-end.
- For the fiscal year ending August 31, 2027, the company forecasts consolidated net sales of ¥190,000 million (up 17.6% year-on-year), adjusted operating profit of ¥25,000 million (up 23.4% year-on-year), and adjusted net income attributable to owners of the parent of ¥16,500 million (up 63.0% year-on-year).
- During the period, two new companies, NISSEICOM Corporation and STEP Co., Ltd., were included in the scope of consolidation.
🤖 AI Perspective
SHIFT Inc.’s FY2026 results show growth in net sales and operating profit, but a decline in ordinary profit and net income attributable to owners of the parent. This may be attributed to factors such as a deterioration in equity method investment losses (negative ¥3,861 million). The forecast for FY2027 indicates significant growth across net sales, adjusted operating profit, and adjusted net income, suggesting that the company’s M&A strategy continues to drive business expansion. This outlook could be a key point for investors to monitor going forward.
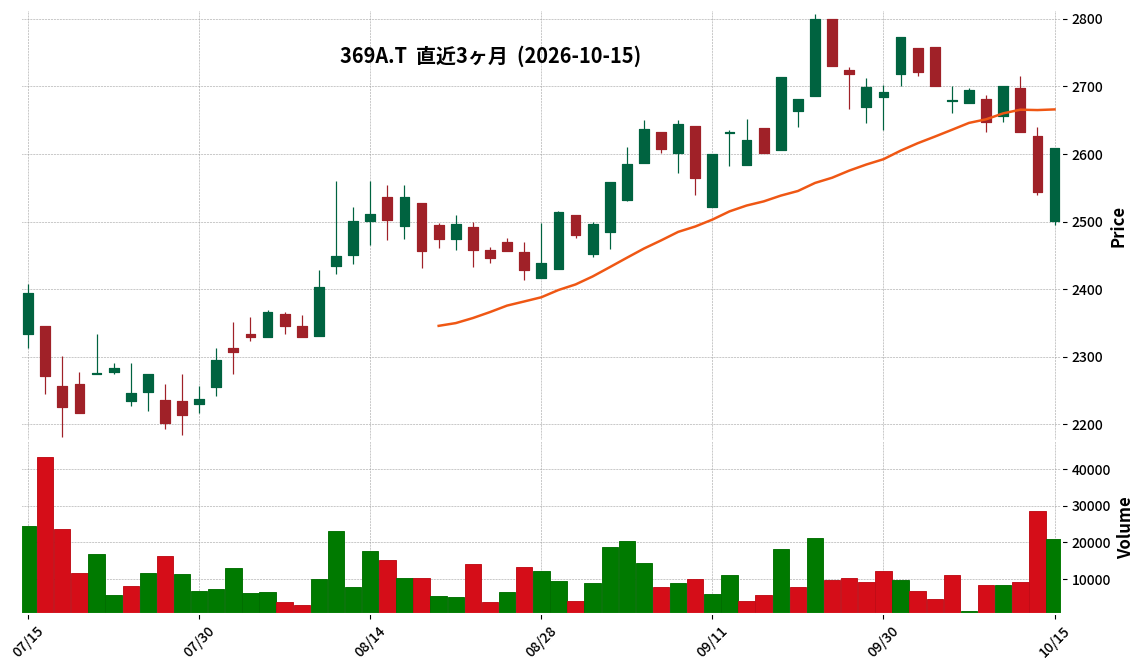
369A|G-エータイ
2609.0
▲ +2.56%
This article is an AI-generated summary and analysis of official IR disclosures.
📄 Announcement (AI-Reviewed)
- G-A-Thai Co., Ltd. resolved to amend its year-end dividend forecast per share for the fiscal year ending August 31, 2026, at its Board of Directors meeting held on October 15, 2026.
- The revised year-end dividend forecast is ¥40.00 per share, up from the previously announced ¥27.00 per share.
- Consequently, the total annual dividend forecast has been revised from ¥54.00 to ¥67.00 per share.
- The company stated that the revision is based on its fundamental policy of implementing appropriate shareholder returns, balancing strategic investments for business growth while maintaining financial soundness and earnings stability.
- It was determined that a shareholder return with a payout ratio of approximately 50% is appropriate, considering the performance for the fiscal year ending August 2026 and recent market trends.
- This matter will be submitted for approval at the Ordinary General Meeting of Shareholders scheduled for late November 2026.
🤖 AI Perspective
This dividend forecast revision by G-A-Thai appears to be a direct outcome of the company’s stated shareholder return policy, taking into account both its performance and prevailing market conditions. The increase in the year-end dividend may signal a strengthened commitment to returning profits to shareholders. The company’s mention of targeting a payout ratio of approximately 50% could suggest a framework for its future dividend policy.
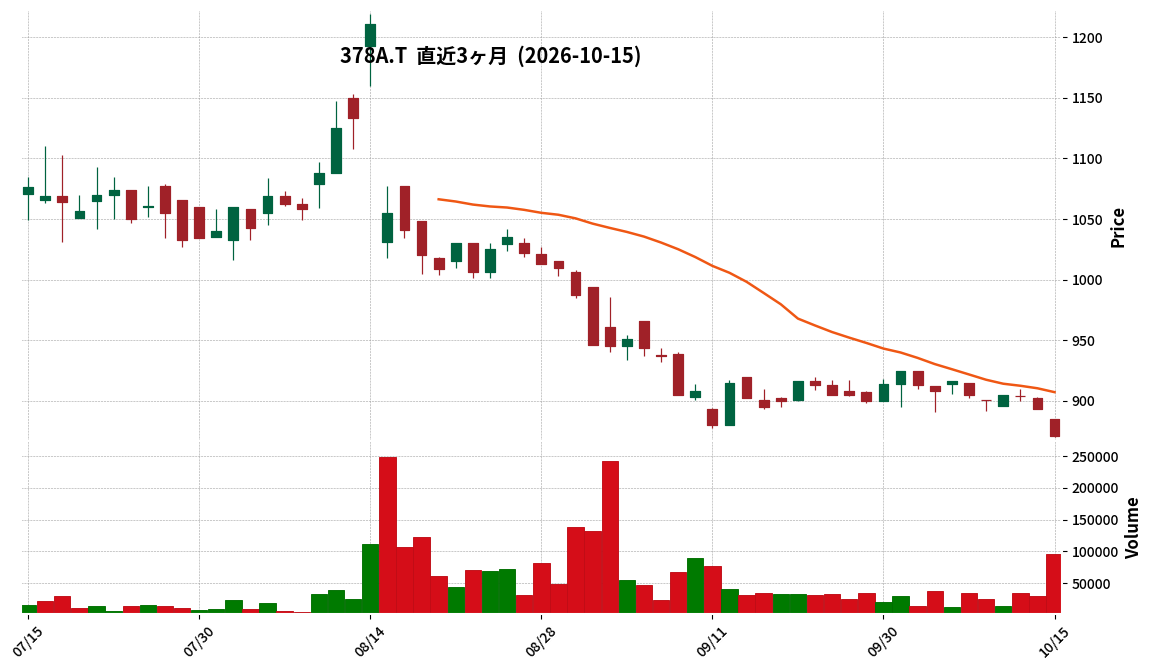
378A|G-ヒット
871.0
▼ -2.46%
This article is an AI-generated summary and analysis of official IR disclosures.
📄 Announcement (AI-Reviewed)
- G-HIT announced, following a board resolution on October 15, 2026, its decision to acquire all shares of Nadia Inc. and xbs Inc., making them wholly-owned subsidiaries.
- The shares of both companies will be acquired from Dekem Inc., an intermediate holding company 100% owned by SHIFT Inc.
- Nadia Inc. operates as a digital creative studio specializing in corporate branding consulting, while xbs Inc. focuses on application development, UI/UX design, and website production.
- The acquisition price for Nadia shares is JPY 1,175,000 thousand, and for xbs shares is JPY 115,000 thousand, totaling JPY 1,290,000 thousand for the target companies’ common stock. The estimated total cost, including advisory fees of JPY 65,000 thousand, is approximately JPY 1,355,000 thousand.
- The execution date for the share acquisition is scheduled for October 30, 2026.
🤖 AI Perspective
This acquisition appears consistent with G-HIT’s M&A strategy to strengthen peripheral services that offer synergy with its core outdoor advertising business. By integrating Nadia’s IP utilization expertise and xbs’s technological capabilities, G-HIT aims to differentiate and add value to its outdoor advertising media, while enhancing its cross-media service offerings. The mutual utilization of creative talent is expected to boost the group’s overall competitive advantage, which could be a key area for investors to monitor.
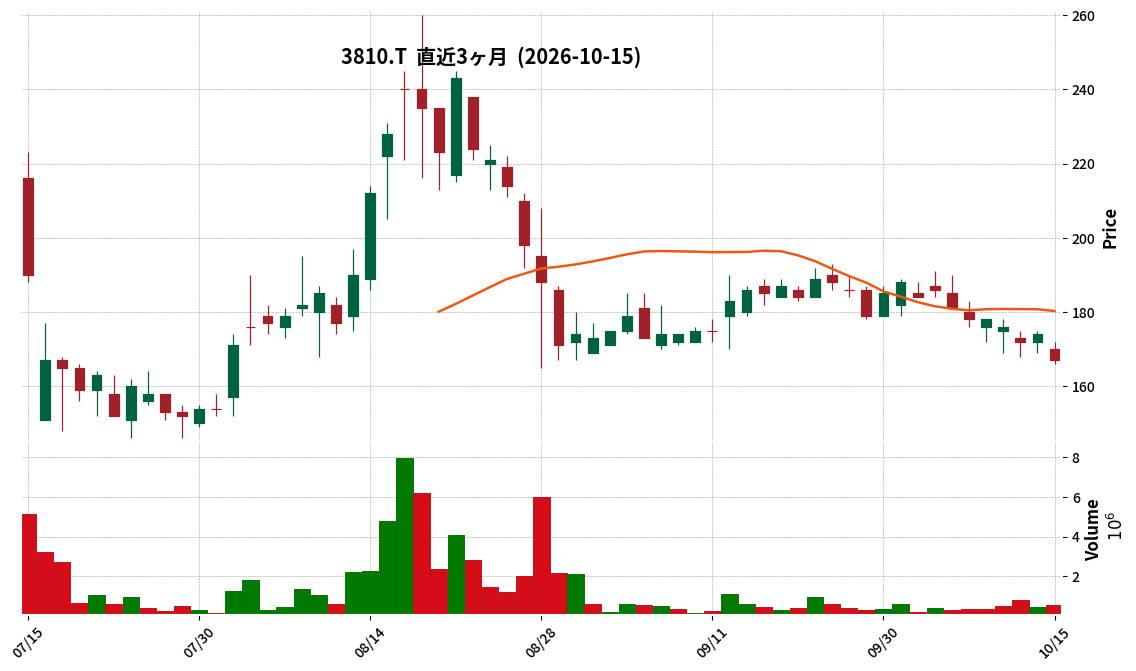
3810|サイバーステップHD
167.0
▼ -4.02%
📎 Source:サイバーステップHD Official IR →
This article is an AI-generated summary and analysis of official IR disclosures.
📄 Announcement (AI-Reviewed)
- Cyberstep Holdings, Inc. announced its consolidated financial results for the first quarter of the fiscal year ending May 2027 (June 1, 2026, to August 31, 2026).
- Net sales for the quarter reached ¥864 million, representing a 79.1% increase compared to the same period in the previous year.
- The company reported a consolidated operating loss of ¥596 million, an ordinary loss of ¥611 million, and a net loss attributable to parent company shareholders of ¥631 million.
- Basic earnings per share for the quarter were △¥7.71.
- The consolidated earnings forecast and dividend forecast for the fiscal year ending May 2027 remain undetermined due to difficulties in making reasonable calculations at this stage.
- During the consolidated cumulative period, Kokorotsunagu Co., Ltd. was newly included in the scope of consolidation as a significant change.
- Sales to external customers in the online game business were ¥673 million (up 53.9% year-on-year), with a segment loss of ¥70 million.
🤖 AI Perspective
Cyberstep HD’s Q1 results show a significant increase in sales, yet losses have expanded compared to the prior year. This trend may suggest the company is in a phase of strategic investment, focusing on expanding its core online crane game “Toreba” and pursuing M&A for new revenue streams. With the full-year forecast still undetermined, investors might closely monitor future business developments and the progress of these monetization efforts.
6555|MSコンサル
433.0
▲ +1.41%
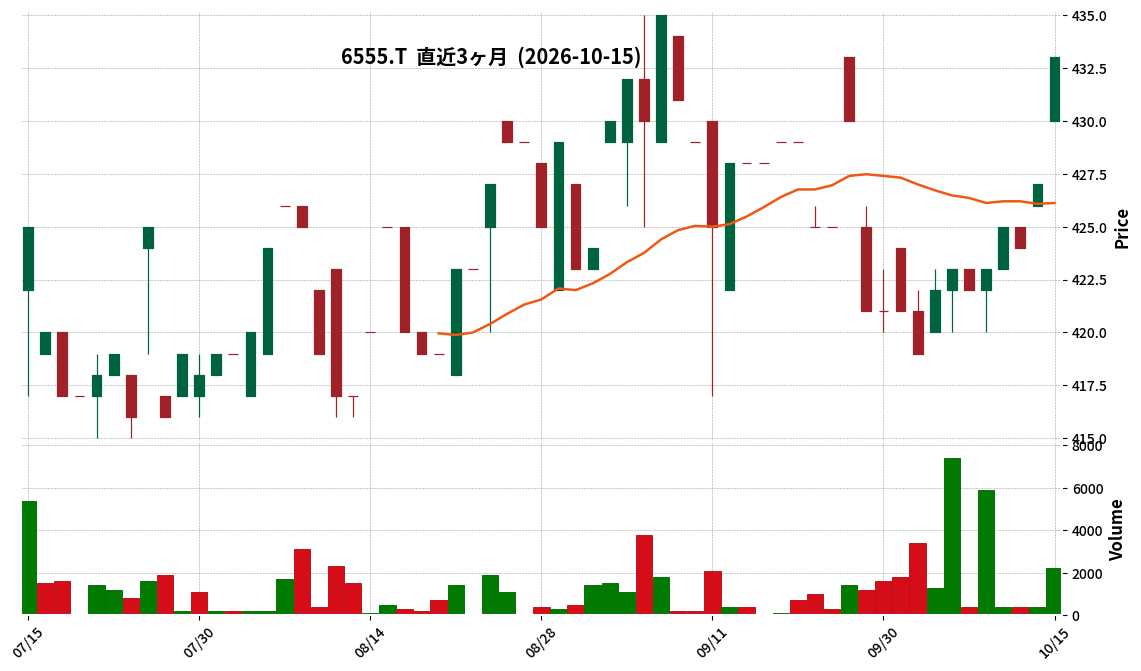
This article is an AI-generated summary and analysis of official IR disclosures.
📄 Announcement (AI-Reviewed)
- MS&Consulting Co., Ltd. announced its consolidated financial results for the second quarter (interim period: March 1, 2026 – August 31, 2026) of the fiscal year ending February 2027.
- Revenue reached ¥1,307 million, marking a 5.1% increase compared to the same interim period last year.
- Operating profit surged by 117.3% year-on-year to ¥150 million.
- Interim profit attributable to owners of the parent company increased by 85.1% year-on-year to ¥97 million.
- The full-year consolidated earnings forecast (Revenue: ¥2,757 million, Operating Profit: ¥355 million, Profit attributable to owners of the parent: ¥220 million) remains unchanged from the most recently published figures.
- Basic earnings per share for the interim period stood at ¥21.46.
🤖 AI Perspective
MS&Consulting’s significant profit growth, notably the operating profit far outpacing revenue growth, may suggest successful cost management and improved operational efficiency. The company’s focus on pricing optimization and expanding its consulting services appears to be yielding positive results. With the full-year forecast remaining unchanged, it could indicate the company anticipates continued stable performance in the latter half of the fiscal year.
1418|インターライフ
600.0
▼ -0.83%
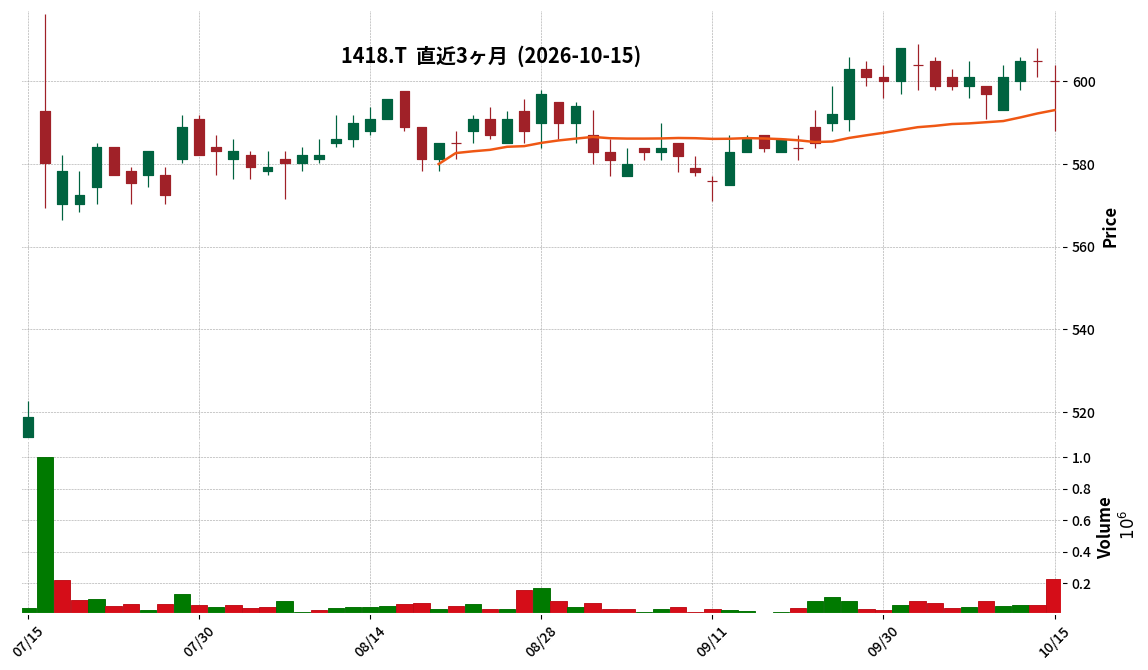
📎 Source:インターライフ Official IR →
This article is an AI-generated summary and analysis of official IR disclosures.
📄 Announcement (AI-Reviewed)
- Interlife Holdings Inc. announced its consolidated financial results for the second quarter (interim period) of the fiscal year ending February 2027.
- For the interim period of FY2027, consolidated performance showed Net Sales of ¥9,657 million (up 8.3% year-on-year), Operating Income of ¥1,216 million (up 33.0%), Ordinary Income of ¥1,238 million (up 36.4%), and Net Income Attributable to Owners of Parent of ¥986 million (up 50.5%).
- The Interior Construction Business segment recorded Net Sales of ¥5,874 million (up 16.9% year-on-year) and Segment Income of ¥771 million (up 101.1% year-on-year).
- The annual dividend forecast has been revised from ¥30.00 per share (FY2026 actual) to ¥36.00 per share for FY2027. This includes an interim dividend of ¥15.00 and a year-end dividend forecast of ¥21.00 (ordinary dividend ¥15.00, special dividend ¥6.00).
- The consolidated full-year earnings forecast for FY22027 has been revised to Net Sales of ¥17,000 million (up 4.1% year-on-year), Operating Income of ¥1,350 million (up 15.7%), Ordinary Income of ¥1,370 million (up 18.5%), and Net Income Attributable to Owners of Parent of ¥1,100 million (up 32.8%).
🤖 AI Perspective
Interlife Holdings has demonstrated significant growth in its Q2 FY2027 results, with notable increases across all profit metrics, particularly a 50.5% rise in Net Income Attributable to Owners of Parent. This strong performance appears to be largely driven by the robust growth in its Interior Construction Business segment. The upward revision of both the annual dividend forecast and the full-year earnings guidance suggests a positive outlook from the company regarding its future business prospects.
245A|G-INGS
2500.0
▼ -1.96%
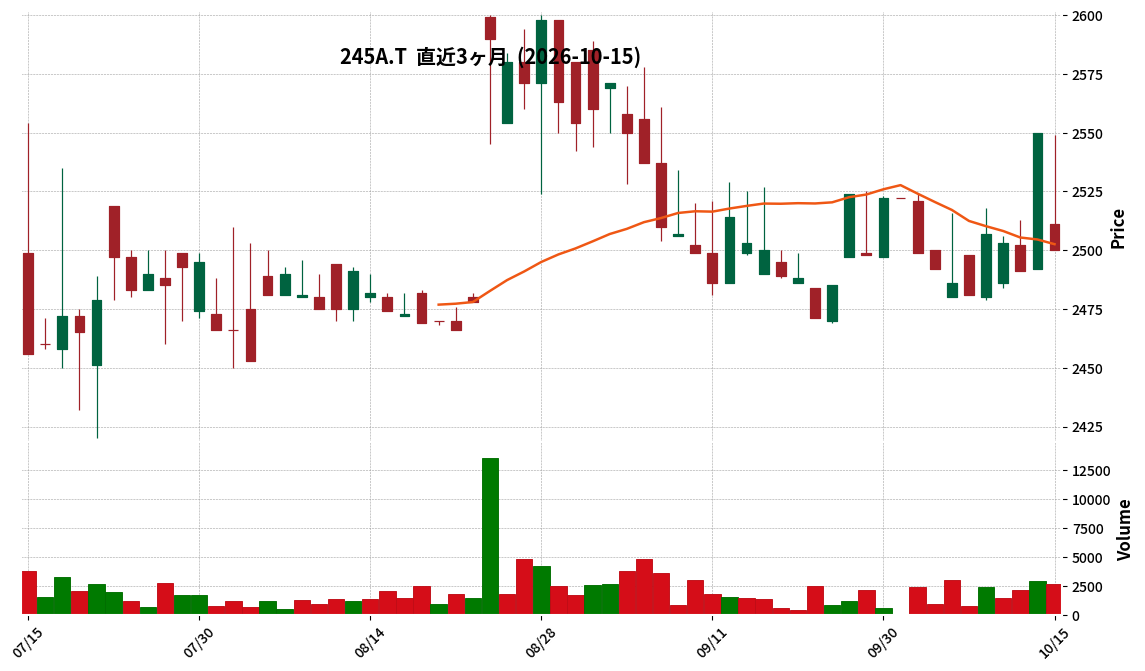
This article is an AI-generated summary and analysis of official IR disclosures.
📄 Announcement (AI-Reviewed)
- G-INGS Co., Ltd. has announced its non-consolidated financial results for the fiscal year ended August 2026.
- For the fiscal year ended August 2026, net sales were ¥9,353 million (up 21.0% year-on-year), operating profit was ¥618 million (up 25.9%), ordinary profit was ¥595 million (up 32.4%), and net profit was ¥390 million (up 43.2%).
- Basic earnings per share were ¥154.66, and diluted earnings per share were ¥151.42.
- The year-end dividend for the fiscal year ended August 2026 was set at ¥31.00 per share, with total annual dividends also at ¥31.00 (payout ratio 20.0%).
- The forecast for the fiscal year ending August 2027 projects net sales of ¥10,858 million (up 16.1% year-on-year), operating profit of ¥690 million (up 11.7%), ordinary profit of ¥659 million (up 10.7%), and net profit of ¥434 million (up 11.5%).
- The ramen business opened 12 new directly managed stores, achieving a 105.0% increase in existing store sales compared to the previous year.
- The restaurant business opened 3 new directly managed stores, with existing store sales increasing by 106.4% year-on-year.
🤖 AI Perspective
G-INGS’s fiscal year 2026 results demonstrate robust performance with double-digit growth in both sales and profits, suggesting a strong operational momentum. The expansion of both the ramen and restaurant segments, driven by new store openings and increased existing store sales, appears to be a key factor in these results. The positive outlook for FY2027 and the declaration of a year-end dividend may also indicate management’s confidence in continued business growth.
251A|P-ニューロマジック
256.0
▲ +0.00%
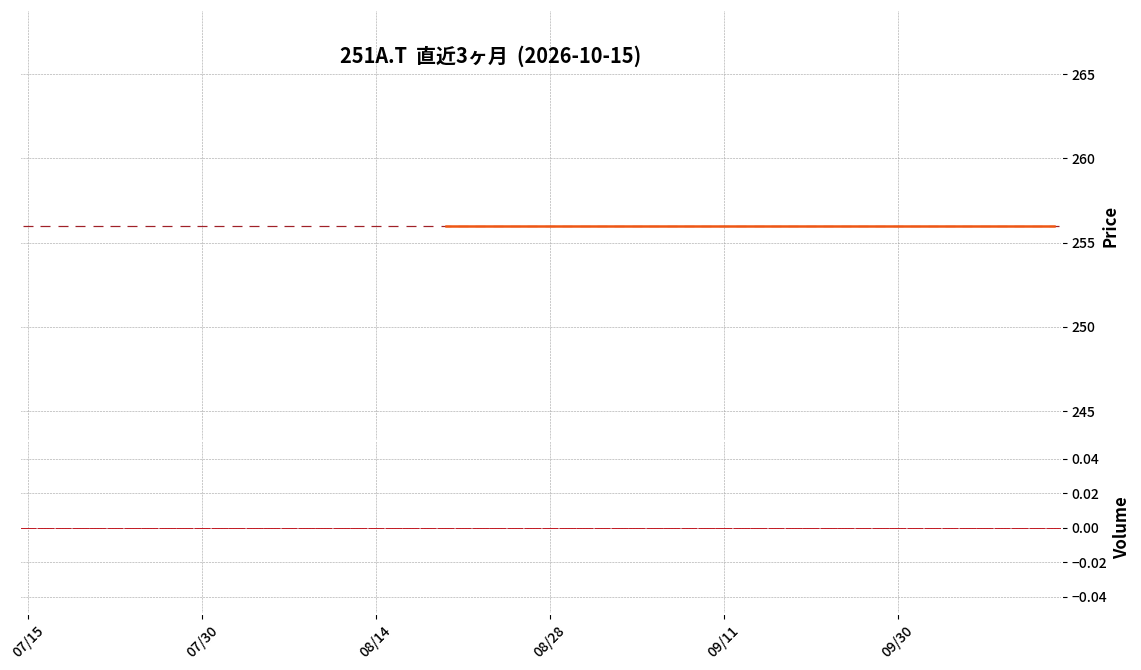
📎 Source:P-ニューロマジック Official IR →
This article is an AI-generated summary and analysis of official IR disclosures.
📄 Announcement (AI-Reviewed)
- P-ニューロマジック reported consolidated net sales of JPY 507,351 thousand for the first half of FY2027 (March 1, 2026 – August 31, 2026), marking a 10.9% decrease compared to the same period last year.
- Operating income resulted in a loss of JPY 40,639 thousand, a reversal from an operating profit of JPY 15,210 thousand in the prior corresponding period.
- Ordinary income also turned into a loss of JPY 41,767 thousand, compared to an ordinary profit of JPY 21,980 thousand in the previous interim period.
- Net income attributable to owners of the parent recorded a loss of JPY 49,562 thousand, a shift from a net income of JPY 24,157 thousand in the prior interim period.
- The primary reasons cited for the decline in performance include a decrease in orders from key clients and the loss of major projects through both agencies and direct dealings.
🤖 AI Perspective
P-ニューロマジック’s latest interim results highlight a significant decline in revenue and a shift from profitability to losses across all key metrics. The reported decrease in orders from major clients and the failure to secure large projects appear to be critical factors impacting performance. As the company operates within a single “Experience Design Business” segment, these results may suggest the need for strategic adjustments to address market challenges and competitive pressures.
280A|G-TMH
993.0
▼ -7.11%
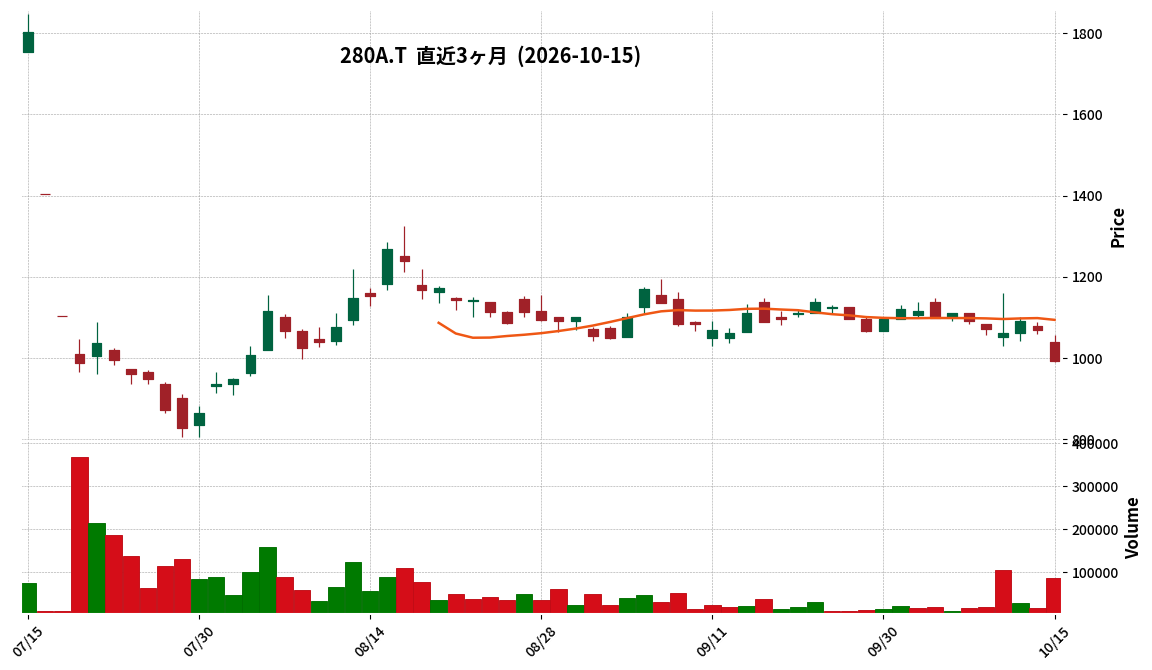
This article is an AI-generated summary and analysis of official IR disclosures.
📄 Announcement (AI-Reviewed)
- For the third quarter cumulative period of the fiscal year ending November 2026, consolidated net sales were JPY 2,516 million, operating loss was JPY 122 million, and ordinary loss was JPY 129 million.
- Sales progress against the full-year consolidated earnings forecast (revised on July 15, 2026) is 79.2%. The operating loss and ordinary loss are within 44.5% and 45.2% of the full-year forecast’s loss amount, respectively.
- A subsidiary in China (Shanghai City) commenced operations in October 2026.
- Sales of parts sales and repair services secured JPY 778 million, an increase of +1% year-on-year.
- Total order backlog for equipment sales services was JPY 530 million, compared to JPY 1,680 million in the same period last year.
🤖 AI Perspective
While consolidated sales are tracking at 79.2% of the full-year forecast, the operating loss remaining within the projected range may suggest the impact of upfront investments in the agency business. The start of operations for the China subsidiary is noteworthy as a strategic move to strengthen global sales capabilities and build new businesses in the future. The continued increase in parts sales and repair services could indicate the robustness of the business foundation as a stable revenue source.
2884|ヨシムラ・F・HD
559.0
▼ -2.27%
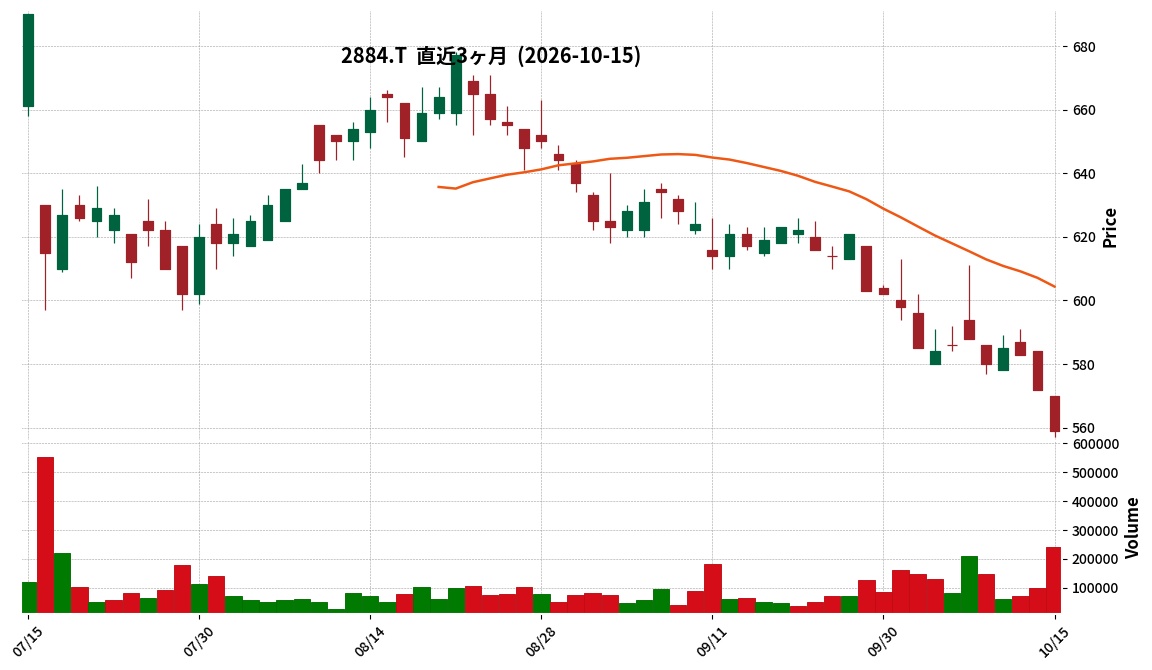
📎 Source:ヨシムラ・F・HD Official IR →
This article is an AI-generated summary and analysis of official IR disclosures.
📄 Announcement (AI-Reviewed)
- Yoshimura F. Holdings reported consolidated net sales of ¥29,004 million for the second quarter (interim period) of the fiscal year ending February 2027, representing a 4.5% increase year-over-year.
- Operating profit was ¥868 million (down 5.7% year-over-year), and ordinary profit was ¥864 million (down 1.0% year-over-year).
- Net income attributable to owners of the parent significantly increased by 128.3% to ¥1,205 million, primarily due to the recognition of compensation received and negative goodwill as extraordinary gains.
- Net sales to external customers for the manufacturing segment were ¥23,577 million (up 2.4% year-over-year), with segment profit at ¥1,187 million (down 10.1% year-over-year).
- Net sales to external customers for the sales segment were ¥5,303 million (up 14.1% year-over-year), with segment profit at ¥162 million (up 132.3% year-over-year).
- The consolidated full-year forecast for FY2027 remains unchanged, projecting net sales of ¥57,500 million, operating profit of ¥2,000 million, ordinary profit of ¥1,700 million, and net income attributable to owners of the parent of ¥1,400 million.
🤖 AI Perspective
While consolidated net sales increased, operating and ordinary profits declined, which may suggest pressure from rising costs or reduced sales in some segments. However, the substantial increase in net income attributable to owners of the parent was driven by extraordinary gains, indicating that the breakdown of income statement components could be a key focus for investors.
3266|ファンドクリG
79.0
▲ +0.00%
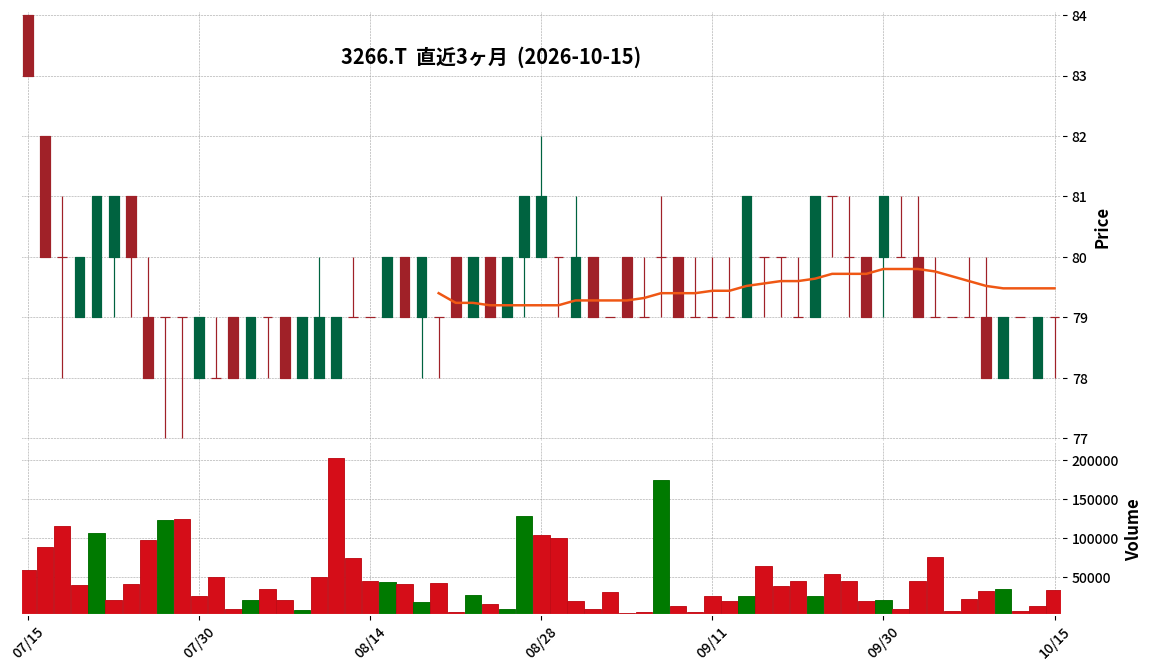
📎 Source:ファンドクリG Official IR →
This article is an AI-generated summary and analysis of official IR disclosures.
📄 Announcement (AI-Reviewed)
- For the cumulative third quarter of the fiscal year ending November 2026, sales revenue was 2,782 million JPY, an increase of 11.0% compared to the same period in the previous year.
- The company reported an operating loss of △22 million JPY for the period (compared to an operating profit of 76 million JPY in the prior year’s period).
- Ordinary loss for the period was △114 million JPY (compared to an ordinary profit of 23 million JPY in the prior year’s period).
- Net loss attributable to parent shareholders was △78 million JPY (compared to a net profit of 7 million JPY in the prior year’s period).
- Total assets at the end of the third quarter stood at 9,584 million JPY (an increase of 2,268 million JPY from the previous fiscal year-end), while net assets decreased by 80 million JPY to 3,231 million JPY.
- The company announced no revision to its full-year consolidated performance forecast for FY2026, which projects sales revenue of 6,200 million JPY, operating profit of 580 million JPY, ordinary profit of 530 million JPY, and net profit attributable to parent shareholders of 345 million JPY.
🤖 AI Perspective
While sales revenue showed growth, the company recorded operating, ordinary, and net losses attributable to parent shareholders for the cumulative third quarter, which is a key area for investor attention. The unchanged full-year forecast could suggest management anticipates a recovery in profitability towards the fiscal year-end. Changes in the balance sheet, particularly the increase in inventories and borrowings, may indicate ongoing investment in business activities.
Disclaimer: This article is for informational purposes only and does not constitute investment advice.
3281|R-GLP
128700.0
▲ +1.50%
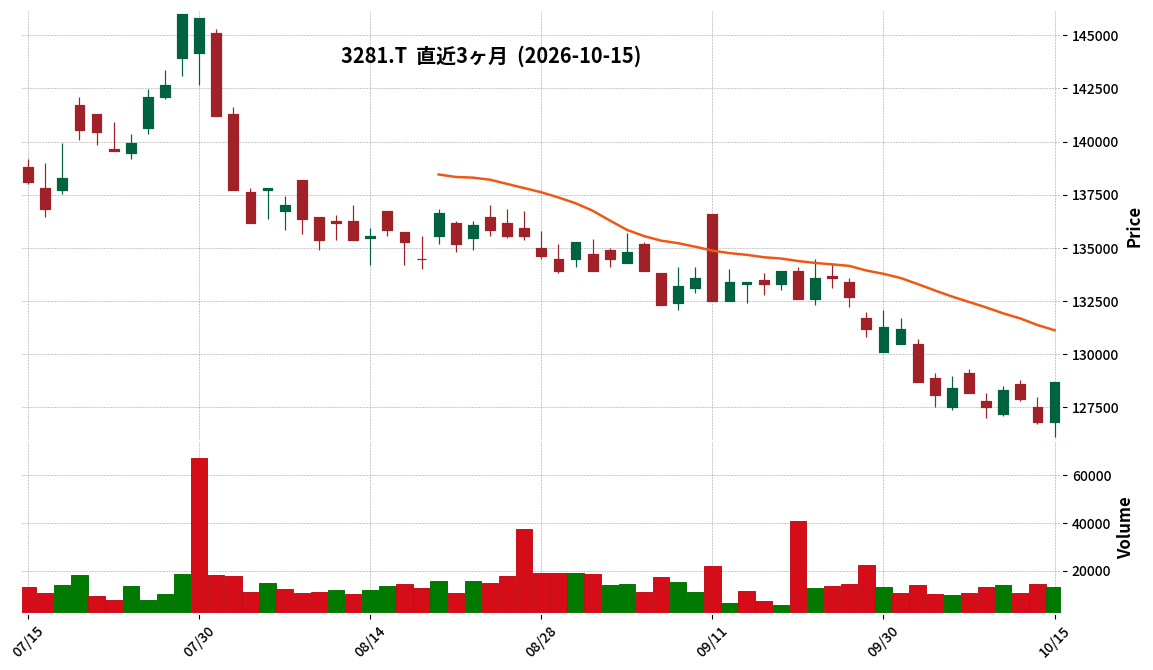
This article is an AI-generated summary and analysis of official IR disclosures.
📄 Announcement (AI-Reviewed)
- R-GLP announced its financial results presentation for the 29th fiscal period ending August 2026 on October 15, 2026.
- Core DPU for FY2026/8 settled at ¥2,851, exceeding the initial forecast by 9.9%.
- Total DPU for the same period reached a record high of ¥3,660, surpassing the initial forecast by 19.7%.
- Rent increase rate at contract maturity for FY2026/8 was 10.1%, with 14-16% projected for FY2027/2.
- Rent increase rate due to CPI-linked clauses for FY2026/8 was 7.4%, with 7-8% projected for FY2027/2.
- In FY2026/8, GLP Tokai was sold, and a sale agreement for Marq Tomisato (scheduled for completion in February 2027) was signed, with a total transfer price premium of 678% over book value expected.
- DPU is projected at ¥3,444 for FY2027/2 and ¥3,386 for FY2027/8.
- The level of Ordinary Property Distribution (OPD) was raised from 30% to 40% of depreciation.
- The medium-term core DPU growth target is set at an annualized rate of 4.0%+ by August 2028.
🤖 AI Perspective
The announcement highlights a record-high DPU for the fiscal year ending August 2026, significantly exceeding initial forecasts. This performance appears to be primarily driven by accelerated internal growth, disciplined capital allocation, and a higher-than-expected gain from property sales. The increase in the Ordinary Property Distribution (OPD) level could be viewed as a strengthened commitment to unitholder returns.
373A|G-リップス
1529.0
▲ +0.00%
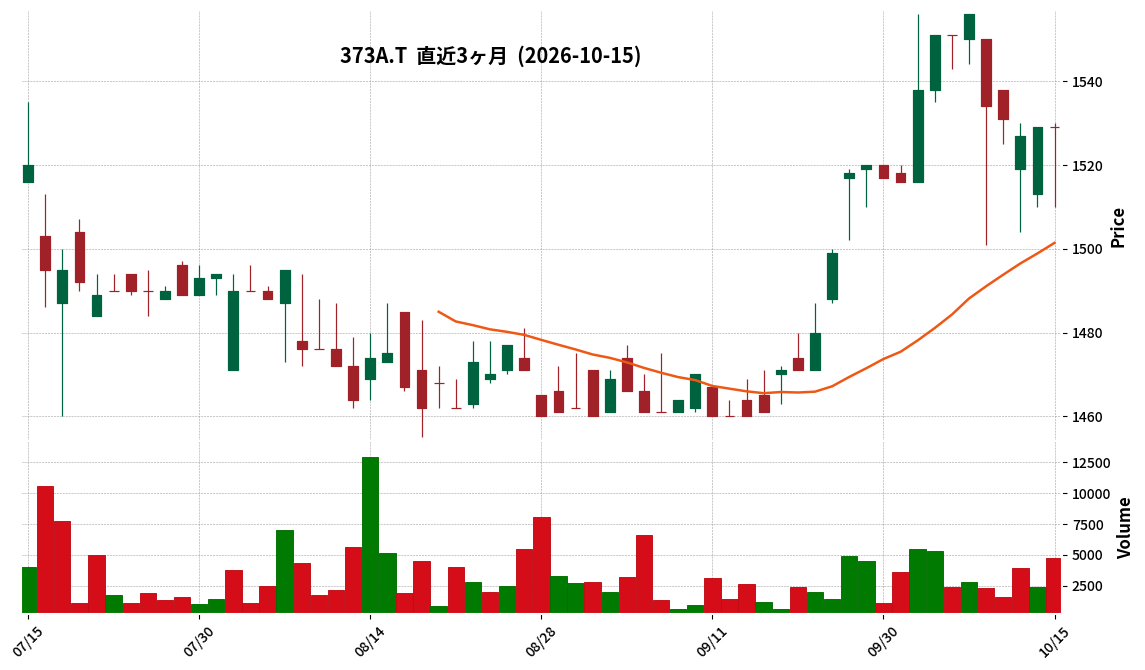
This article is an AI-generated summary and analysis of official IR disclosures.
📄 Announcement (AI-Reviewed)
- G-LIPPS reported net sales of ¥4,666 million for the fiscal year ended August 2026 (September 1, 2025, to August 31, 2026), marking a 5.8% increase year-on-year.
- Operating profit decreased by 28.7% year-on-year to ¥676 million. Ordinary profit was down 27.2% to ¥684 million, and net profit for the period decreased by 23.9% to ¥496 million.
- As of the end of August 2026, total assets stood at ¥4,557 million, net assets at ¥4,115 million, and the equity ratio was 90.3%.
- The product business segment recorded sales of ¥4,283 million (+7.9% YoY) and segment profit of ¥548 million (-30.2% YoY).
- The salon franchise business segment reported sales of ¥382 million (-13.1% YoY) and segment profit of ¥128 million (-21.5% YoY).
🤖 AI Perspective
G-LIPPS’s FY2026 results show revenue growth but a decline in profits, which the company attributes to increased advertising and personnel expenses. This suggests strategic investments in growth may have temporarily impacted profitability. However, a high equity ratio of 90.3% indicates a robust financial position, which could provide stability for future initiatives.
4016|MITHD
1003.0
▼ -2.72%
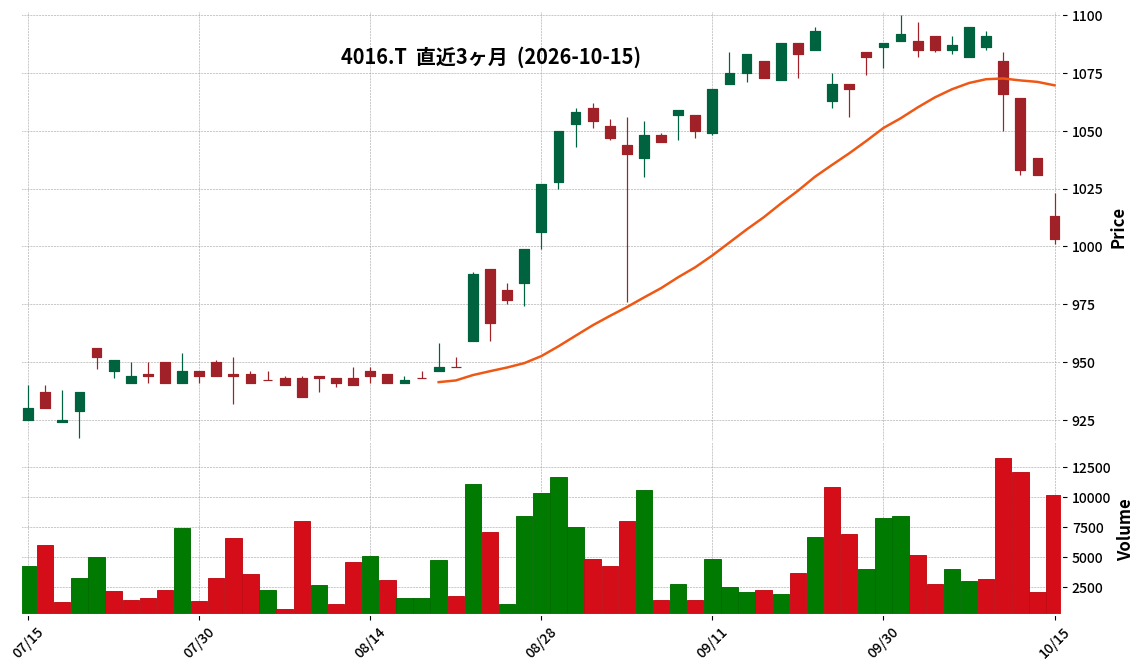
This article is an AI-generated summary and analysis of official IR disclosures.
📄 Announcement (AI-Reviewed)
- MITHD released its Supplementary Explanatory Materials for the Third Quarter of the Fiscal Year Ending November 2026 on October 15, 2026.
- For the nine months ended August 31, 2026, net sales were ¥3,706 million (down 4.5% year-on-year), operating income was ¥167 million (down 13.4%), ordinary income was ¥167 million (down 11.6%), and net income attributable to parent company shareholders was ¥97 million (down 18.9%).
- Sales for System Integration Services for the cumulative third quarter totaled ¥3,154 million (down 4.0% year-on-year), and for DX Solution Services, sales were ¥551 million (down 7.2% year-on-year).
- The full-year consolidated earnings forecast for the fiscal year ending November 2026 has been revised downward: net sales from ¥5,700 million to ¥4,956 million, operating income from ¥285 million to ¥196 million, ordinary income from ¥277 million to ¥194 million, and net income attributable to parent company shareholders from ¥172 million to ¥110 million.
- The year-end dividend forecast (¥30 per share, ordinary dividend) remains unchanged.
🤖 AI Perspective
MITHD’s Q3 results showed a year-on-year decrease in both revenue and profit, though its DX Solutions segment maintained sequential growth. The downward revision of the full-year forecast is attributed to factors such as changes in major client policies and delays in new order placements, which could be a key area for investors to monitor. However, the unchanged year-end dividend forecast may suggest a continued commitment to shareholder returns despite the revised outlook.
Disclaimer: This article is for informational purposes only and does not constitute investment advice.
414A|G-オーバーラップ
821.0
▼ -0.24%
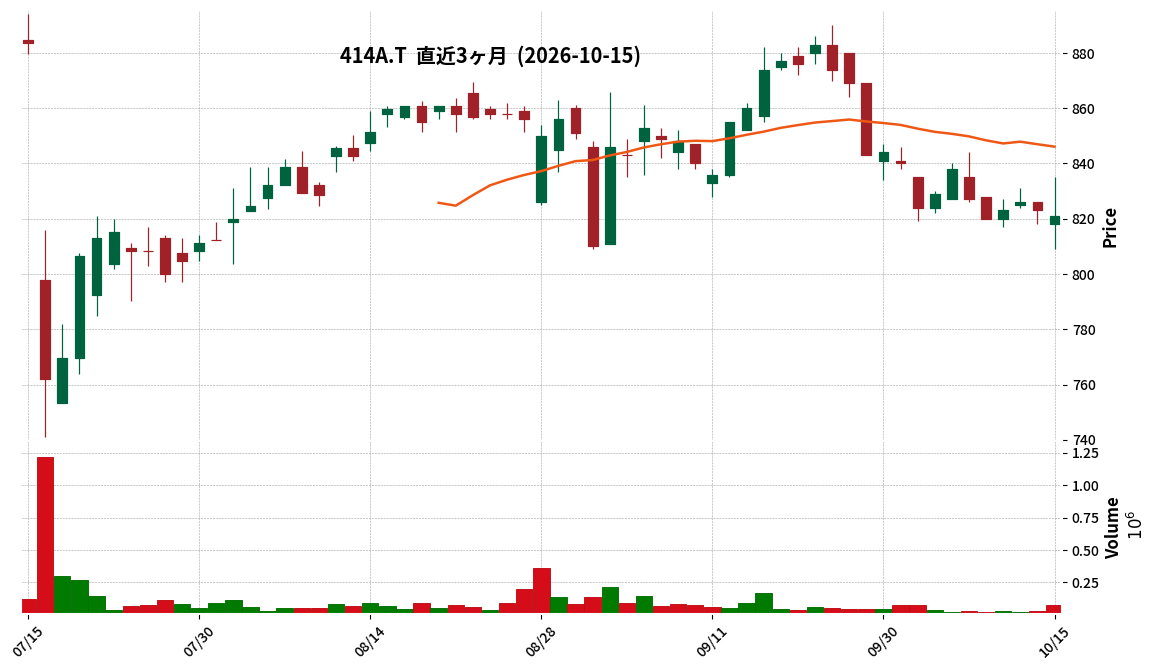
📎 Source:G-オーバーラップ Official IR →
This article is an AI-generated summary and analysis of official IR disclosures.
📄 Announcement (AI-Reviewed)
- G-Overlap Holdings reported consolidated revenue of ¥8,522 million for the fiscal year ended August 2026, marking a 0.2% decrease from the previous fiscal year.
- Operating profit stood at ¥2,392 million (down 20.9% year-on-year), and profit before tax was ¥2,151 million (down 25.1% year-on-year).
- Profit attributable to owners of the parent company amounted to ¥1,599 million, representing a 22.6% decrease from the prior year.
- The year-end dividend for FY2026 was set at ¥44.00, resulting in a total annual dividend of ¥44.00 (dividend payout ratio of 55.2%).
- For FY2027, the company forecasts consolidated revenue of ¥8,780 million (up 3.0% year-on-year), profit attributable to owners of the parent of ¥1,677 million (up 4.9% year-on-year), and a full-year dividend of ¥44.00.
🤖 AI Perspective
G-Overlap Holdings’ FY2026 results show a slight decrease in revenue but a more significant decline in profitability compared to the previous year. This was attributed to increased operating expenses, including IPO-related costs and upfront investments for increased single-volume book releases. The company’s FY2027 outlook indicates anticipated growth in both revenue and profit, suggesting that the impact of these investments on future earnings will be a key area for investors to monitor.
4197|アスマーク
2496.0
▲ +1.38%
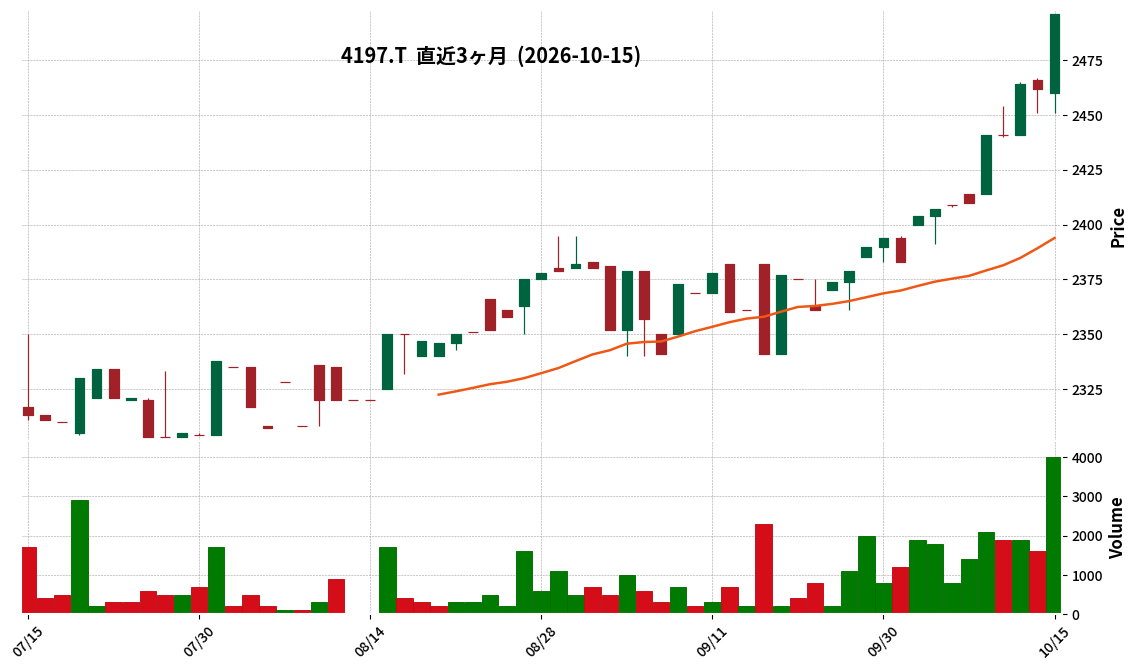
This article is an AI-generated summary and analysis of official IR disclosures.
📄 Announcement (AI-Reviewed)
- ASMARQ Co., Ltd. reported consolidated net sales of 3,394 million yen for the third quarter of fiscal year 2026 (December 1, 2025 to August 31, 2026), marking a 2.0% increase year-on-year.
- Operating income decreased by 90.4% year-on-year to 22 million yen, ordinary income fell by 86.2% to 33 million yen, and net income decreased by 97.0% to 5 million yen.
- The decline in operating income is attributed to an increased outsourcing ratio (+2.6 percentage points), higher personnel costs due to human capital investment (a 9% increase), and the amortization of goodwill from consolidated subsidiaries.
- The full-year consolidated earnings forecast for fiscal year 2026 was revised downwards to net sales of 4,500 million yen (down 200 million yen from the previous forecast) and operating income of 70 million yen (down 130 million yen).
- The annual dividend forecast remains unchanged at 78 yen (38 yen interim, 40 yen year-end), indicating no change in the shareholder return policy.
🤖 AI Perspective
ASMARQ’s Q3 results show a divergence between revenue growth and a significant drop in operating income, which appears to align with the company’s stated strategy for FY2026 as a “period of investment for re-growth,” focusing on human capital and data analytics. The downward revision of the full-year forecast suggests that these strategic investments are impacting short-term profitability. However, the decision to maintain the dividend forecast could be interpreted as management’s confidence in the long-term potential of these investments for future earnings recovery.
Disclaimer: This article is for informational purposes only and does not constitute investment advice.
4413|ボードルア
3030.0
▲ +1.68%
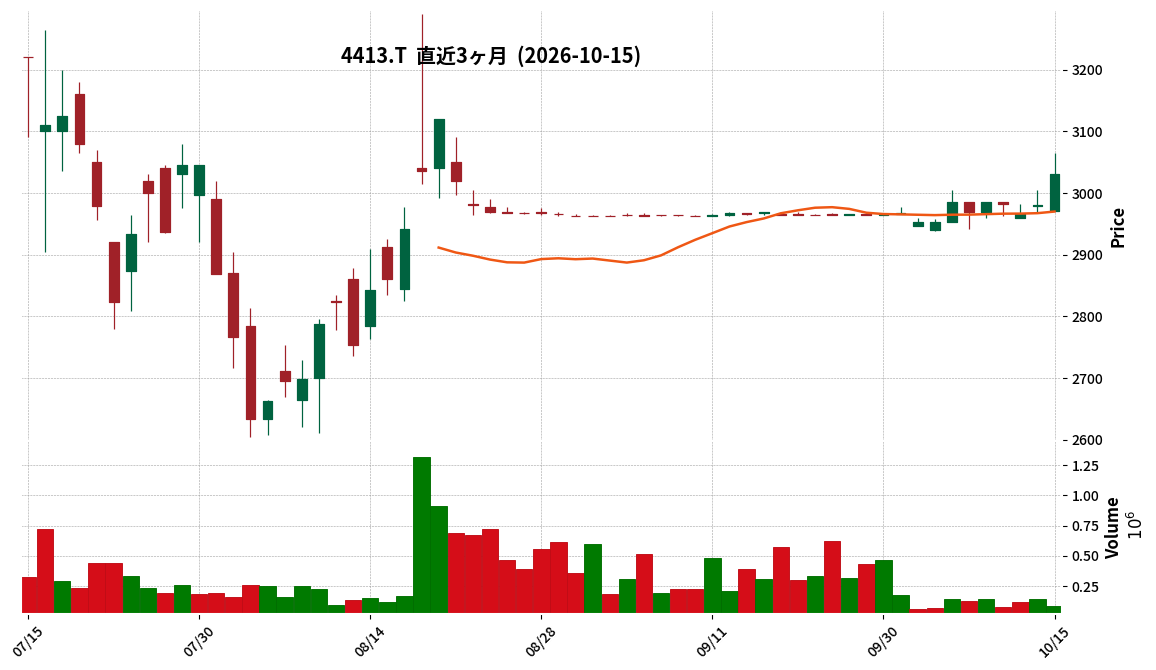
This article is an AI-generated summary and analysis of official IR disclosures.
📄 Announcement (AI-Reviewed)
- Baudroie reported consolidated net sales of ¥11,181 million for the second quarter of fiscal year 2027 (interim period), a 45.2% increase year-over-year.
- Operating profit reached ¥1,639 million (up 16.5% YoY), and profit before tax was ¥1,621 million (up 16.0% YoY).
- Net income attributable to owners of the parent was ¥1,159 million (up 14.3% YoY).
- Basic earnings per share for the interim period was ¥37.18, compared to ¥32.74 in the prior year.
- The full-year consolidated performance forecast for fiscal year 2027 remains unchanged from the most recently announced figures, projecting net sales of ¥23,500 million, operating profit of ¥4,409 million, and net income attributable to owners of the parent of ¥3,134 million (¥100.46 per share).
🤖 AI Perspective
The interim results suggest a significant expansion in business scale, with double-digit growth in both revenue and net income attributable to owners of the parent. This performance could indicate the company’s effective response to the ongoing expansion of IT and DX investments. The reaffirmation of the full-year forecast suggests management’s confidence in maintaining current trends.
4885|室町ケミカル
910.0
▲ +1.90%
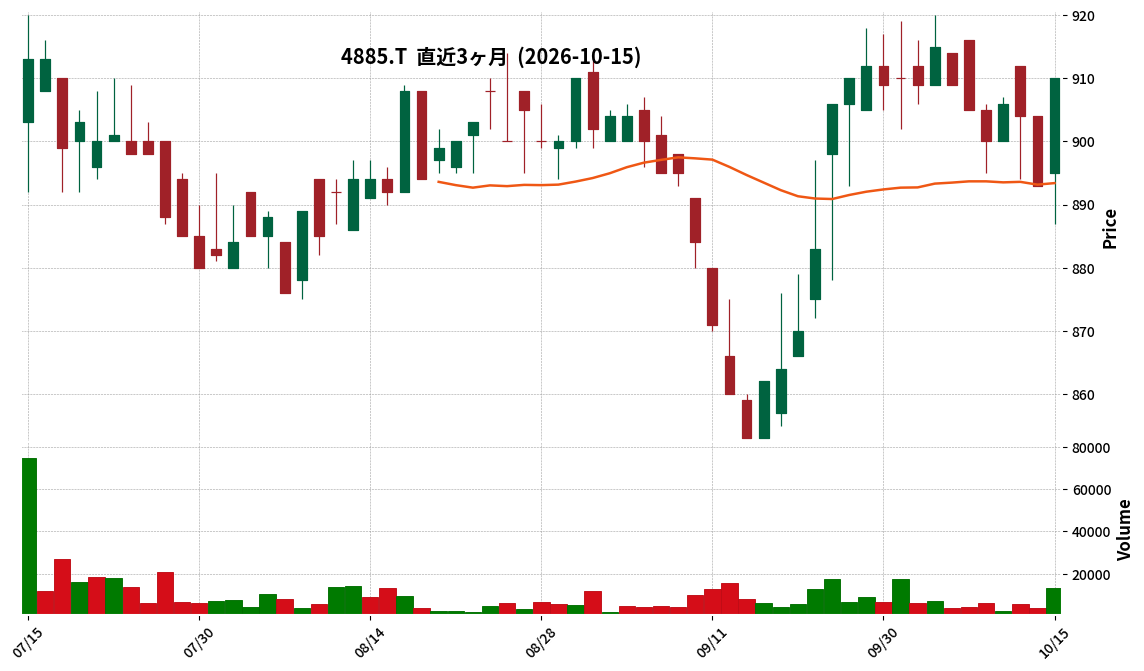
This article is an AI-generated summary and analysis of official IR disclosures.
📄 Announcement (AI-Reviewed)
- Muromachi Chemical Corporation announced its financial results for the first quarter of the fiscal year ending May 2027 (June 1, 2026, to August 31, 2026).
- Net sales reached 1,861 million yen (up 4.1% year-on-year), operating profit was 182 million yen (up 144.8%), ordinary profit was 191 million yen (up 161.9%), and quarterly net profit was 142 million yen (up 147.5%).
- The Pharmaceuticals Business reported sales of 1,068 million yen (up 21.7% year-on-year) and operating profit of 141 million yen (up 61.0%), driven by increased demand for existing products, particularly active pharmaceutical ingredients for antiepileptic drugs and anti-herpes virus drugs.
- The Chemicals Business recorded sales of 792 million yen (up 30.8% year-on-year) and operating profit of 41 million yen (up 399.0%), primarily due to increased sales of ion exchange resins and custom-processed products amid the activated semiconductor-related market, as well as higher sales of amino acid refined products.
- The full-year forecast for FY2027 has been revised, projecting net sales of 7,100 million yen (down 9.4% from the previous period), operating profit of 550 million yen (down 26.0%), ordinary profit of 500 million yen (down 29.3%), and net profit of 350 million yen (up 114.7%).
🤖 AI Perspective
While the company achieved significant revenue and profit growth in Q1, the revised full-year forecast indicates a projected decrease in revenue and operating profit, which might be a point of interest for investors to monitor. Conversely, the substantial increase in the full-year net profit forecast compared to the previous period could suggest positive impacts from business portfolio adjustments or efficiency improvements. The change in reporting segments, including the withdrawal from the health food business, may also reflect a strategic realignment of the company’s operations.
5018|MORESCO
2483.0
▼ -3.91%
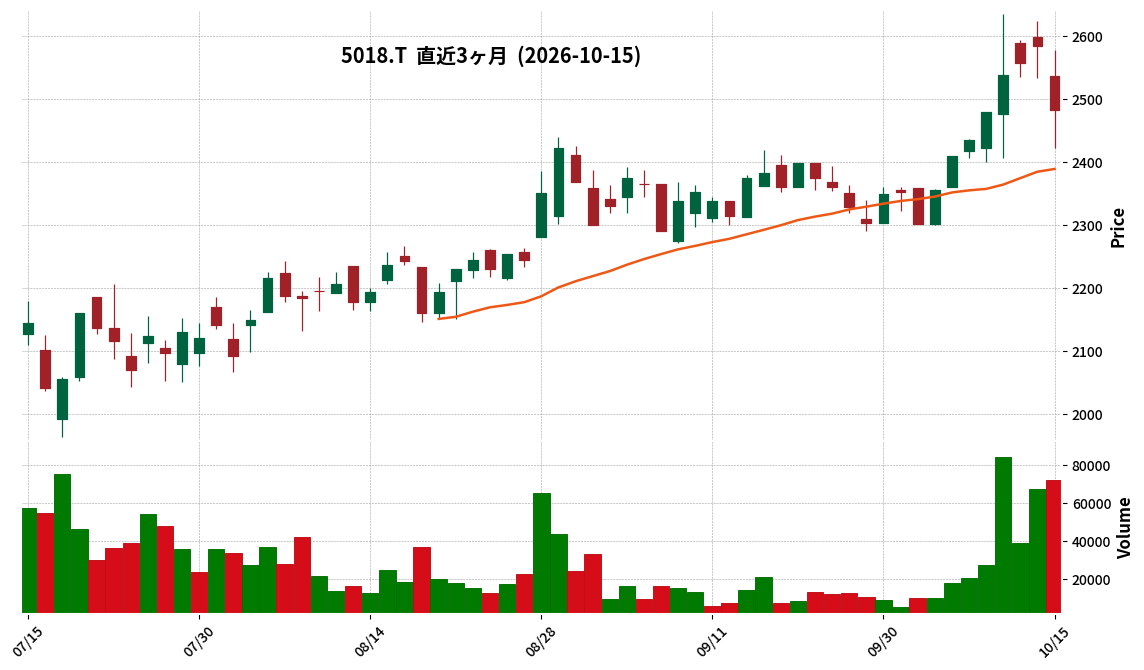
📎 Source:MORESCO Official IR →
This article is an AI-generated summary and analysis of official IR disclosures.
📄 Announcement (AI-Reviewed)
- MORESCO announced revisions to its consolidated earnings forecast for the fiscal year ending February 2027, from the previous announcement on April 14, 2026.
- The revised full-year consolidated figures are: Net sales JPY 40,000 million (vs. previous JPY 37,000 million, +8.1%), Operating profit JPY 4,500 million (vs. previous JPY 2,400 million, +87.5%), Recurring profit JPY 4,800 million (vs. previous JPY 2,700 million, +77.8%), and Net income attributable to owners of parent JPY 2,800 million (vs. previous JPY 1,550 million, +80.6%).
- Diluted earnings per share (EPS) is revised from JPY 168.77 to JPY 304.87.
- Reasons for the upward revision include increased sales of lubricants due to higher automobile production outside China, price adjustments following raw material price hikes, increased sales of high value-added products, and streamlining of unprofitable products in the hot-melt adhesive division.
- The annual dividend forecast for the fiscal year ending February 2027 is revised from JPY 55 to JPY 95 per share (year-end dividend JPY 70). This is expected to result in a consolidated dividend payout ratio of approximately 31%.
🤖 AI Perspective
This significant upward revision in both earnings and dividend forecasts suggests that MORESCO’s performance is expected to considerably exceed initial projections. The substantial increases in operating profit and net income could indicate positive impacts from improved business structure and a shift towards higher-value-added products. Furthermore, the increased dividend, aligned with the target of a 30% or higher consolidated payout ratio, highlights the company’s commitment to shareholder returns.
562A|P-寶結
1000.0
▲ +0.00%
This article is an AI-generated summary and analysis of official IR disclosures.
📄 Announcement (AI-Reviewed)
- P-HOYU’s non-consolidated net sales for the fiscal year ended August 2026 were ¥1,346 million, a 64.3% increase from the previous fiscal year.
- Operating profit for the same period was ¥25 million, a 50.8% decrease year-on-year; ordinary profit was ¥17 million, a 66.2% decrease; and net profit was ¥11 million, a 69.6% decrease.
- Operating profit before goodwill amortization, a key management indicator, increased by 4.1% year-on-year to ¥53 million.
- The company was listed on the Tokyo Stock Exchange TOKYO PRO Market and Fukuoka Stock Exchange Fukuoka PRO Market on April 24, 2026.
- For the fiscal year ending August 2027, the company forecasts net sales of ¥1,650 million (22.5% increase), operating profit of ¥100 million (292.0% increase), ordinary profit of ¥95 million (441.6% increase), and net profit of ¥60 million (420.1% increase).
🤖 AI Perspective
While P-HOYU demonstrated significant revenue growth in FY2026, the decline in operating, ordinary, and net profits is a notable point, which appears to be influenced by goodwill amortization from business acquisition and increased selling, general, and administrative expenses. However, the increase in operating profit before goodwill amortization suggests that core business profitability may be maintained. The substantial revenue and profit growth forecast for FY2027 indicates that future business developments could be a key focus for investors.
6044|三機サービス
1928.0
▲ +1.05%
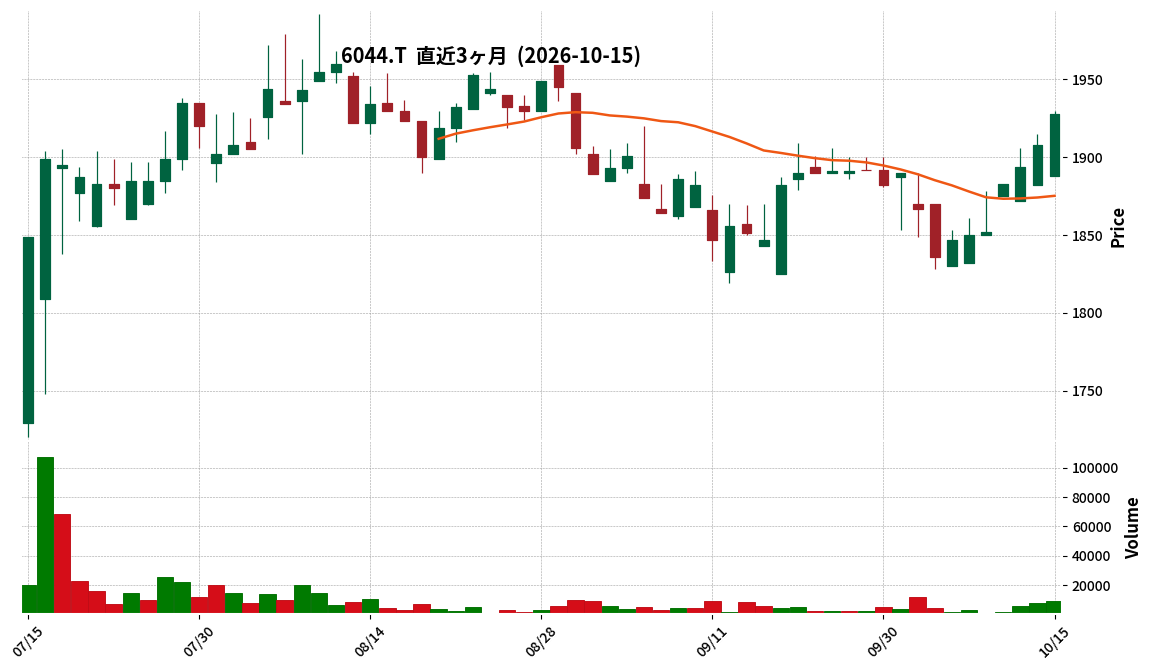
This article is an AI-generated summary and analysis of official IR disclosures.
📄 Announcement (AI-Reviewed)
- Sanki Service announced its consolidated financial results for the first quarter of the fiscal year ending May 2027 (June 1, 2026 – August 31, 2026).
- Consolidated net sales reached ¥6,761 million (up 13.5% year-on-year), operating profit ¥399 million (up 104.3% year-on-year), ordinary profit ¥403 million (up 104.0% year-on-year), and profit attributable to owners of parent ¥257 million (up 99.4% year-on-year).
- By segment, the Maintenance business reported sales of ¥6,147 million (up 16.3% year-on-year) and segment profit of ¥302 million (up 132.2% year-on-year). The Construction-related Products Service business reported sales of ¥614 million (down 9.6% year-on-year) and segment profit of ¥97 million (up 49.1% year-on-year).
- The company has refrained from disclosing its full-year consolidated earnings forecast due to its planned delisting on November 27, 2026, following a share exchange with Shinmente Holdings Co., Ltd.
- Total assets at the end of the period were ¥10,478 million (up ¥326 million from the end of the previous fiscal year), and net assets were ¥5,674 million (up ¥45 million from the end of the previous fiscal year).
🤖 AI Perspective
Sanki Service achieved significant increases in sales and all profit metrics in the first quarter, with the maintenance business appearing to be a key driver of this performance. This strong result could be attributed to the progress of equipment renewal projects for multi-store customers and smooth advancement of large-scale equipment renewal orders. However, due to the upcoming delisting following a share exchange, the full-year earnings forecast has not been disclosed, which may limit visibility into the company’s future performance as a publicly traded entity.
7035|anfac
220.0
▼ -2.65%
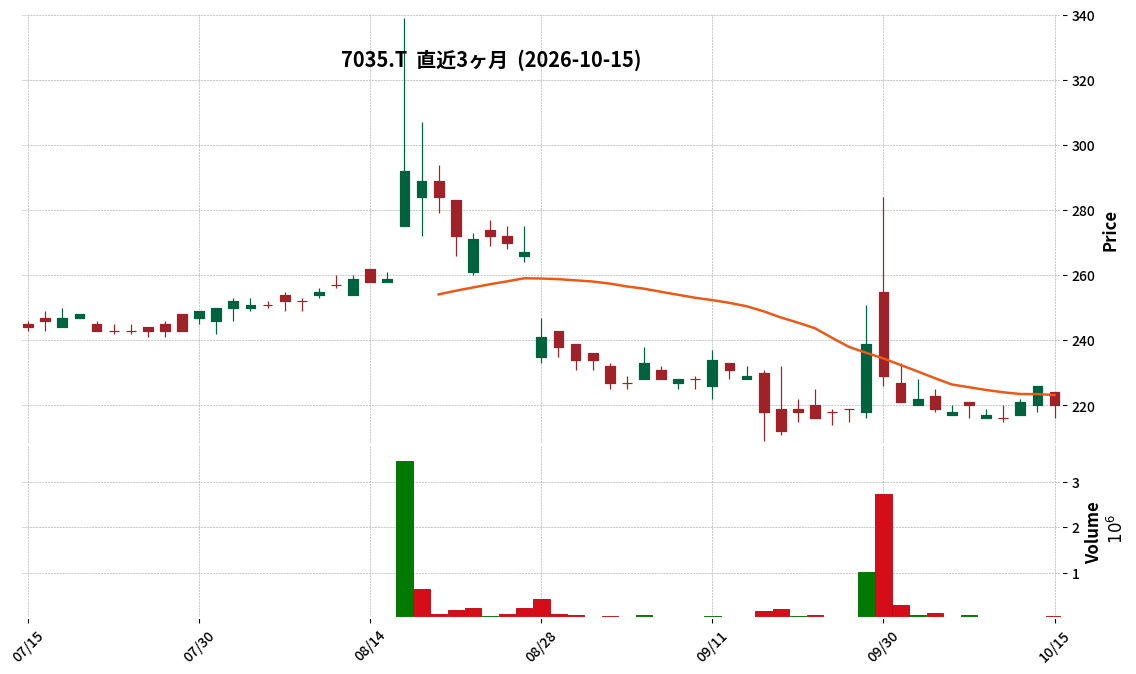
This article is an AI-generated summary and analysis of official IR disclosures.
📄 Announcement (AI-Reviewed)
- andfactory, inc. announced its consolidated financial results for the full year ended August 2026.
- Revenue for the period was ¥3,138 million, a decrease of 2.2% compared to the previous consolidated fiscal year.
- Operating income turned profitable at ¥6 million, a significant improvement from an operating loss of ¥270 million in the prior fiscal year.
- Ordinary income also became positive at ¥6 million (compared to an ordinary loss of ¥266 million in the previous year), and net income attributable to parent company shareholders was ¥7 million (compared to a net loss of ¥326 million in the previous year).
- The APP segment reported sales of ¥2,934 million (down 4.2% YoY) and segment profit of ¥289 million (up 382.4% YoY).
🤖 AI Perspective
The August 2026 full-year results show a notable shift to profitability across operating, ordinary, and net income, despite a slight decline in revenue. This suggests that the company’s efforts in optimizing cost structures within its core businesses and securing project-based contracts have contributed significantly to the turnaround. The substantial increase in segment profit for the APP business particularly indicates improved operational efficiency and profitability within this key area.
7074|G-247HD
187.0
▲ +0.54%
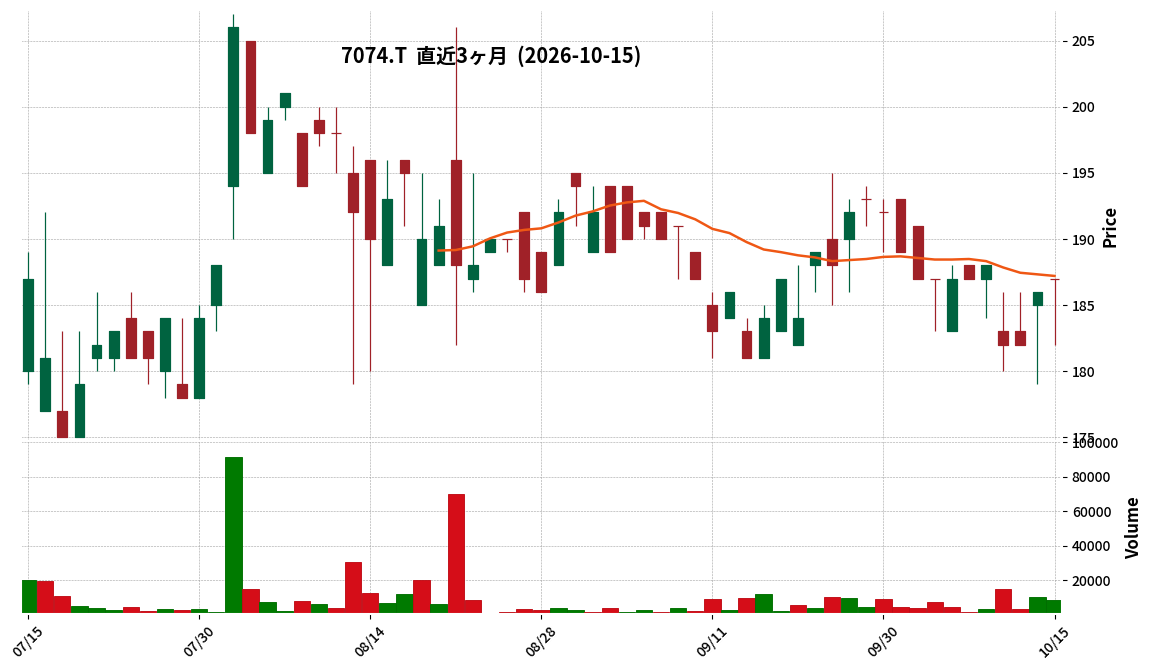
📎 Source:G-247HD Official IR →
This article is an AI-generated summary and analysis of official IR disclosures.
📄 Announcement (AI-Reviewed)
- G-247HD announced its consolidated financial results for the third quarter of the fiscal year ending November 2026 (December 1, 2025 – August 31, 2026).
- Net sales reached ¥1,839 million, marking a 21.0% increase compared to the same period last year.
- Operating loss improved to ¥△10 million (compared to ¥△163 million in the prior year), ordinary loss was ¥△3 million (compared to ¥△160 million), and net loss attributable to owners of parent was ¥△25 million (compared to ¥△184 million).
- The full-year consolidated performance forecast (Net sales ¥2,616 million, Operating profit ¥32 million, Ordinary profit ¥36 million, Net profit attributable to owners of parent ¥7 million) remains unchanged.
- The Personal Training business segment reported net sales of ¥1,745,465 thousand (up 16.8% YoY) and segment profit of ¥179,056 thousand (compared to a segment loss of ¥164,215 thousand in the prior year).
- The Real Estate Related business segment recorded net sales of ¥96,949 thousand (up 291.2% YoY) and segment profit of ¥38,045 thousand (up 331.2% YoY).
🤖 AI Perspective
G-247HD’s Q3 results indicate a significant increase in net sales and a substantial reduction in losses across all profit stages compared to the previous year. The strong growth in both the Personal Training and Real Estate Related segments may suggest the company’s business strategies are progressing effectively. With the full-year forecast remaining unchanged, it could indicate that the company has already factored in the current performance trend.
7610|テイツー
129.0
▼ -3.73%
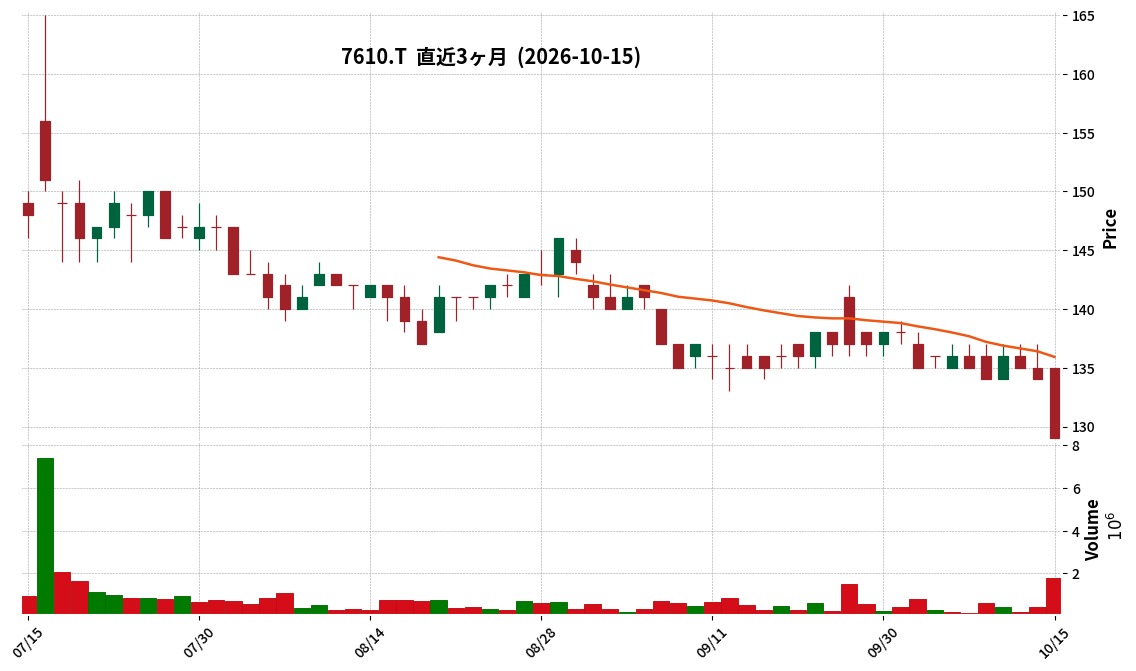
This article is an AI-generated summary and analysis of official IR disclosures.
📄 Announcement (AI-Reviewed)
- Tay Two Co., Ltd. announced its consolidated financial results for the second quarter (interim) of the fiscal year ending February 2027.
- Consolidated net sales reached ¥22,118 million (up 14.4% year-on-year), operating profit was ¥1,332 million (up 119.7%), ordinary profit was ¥1,364 million (up 130.3%), and profit attributable to owners of parent was ¥788 million (up 134.0%).
- In the used product category, sales of trading cards and games performed strongly, leading to an increase in overall used product sales compared to the previous year.
- In the new product category, sales of new software increased due to the wider adoption of game consoles, and sales of trading cards and hobby items performed well, resulting in an increase in overall new product sales compared to the previous year.
- The consolidated full-year forecast for the fiscal year ending February 2027 remains unchanged from the most recently announced figures: net sales of ¥43.5 billion, operating profit of ¥2.0 billion, ordinary profit of ¥2.0 billion, and profit attributable to owners of parent of ¥1.0 billion.
🤖 AI Perspective
Tay Two’s Q2 FY2027 results demonstrate significant growth in both revenue and profits, with operating, ordinary, and net profits showing triple-digit percentage increases. This strong performance appears to be driven by increased sales and an improved gross profit margin. The sustained strength in trading card and game sales across both used and new categories could indicate the company is effectively capitalizing on the growing reuse market and its strategic initiatives.
9979|大庄
1016.0
▲ +0.59%
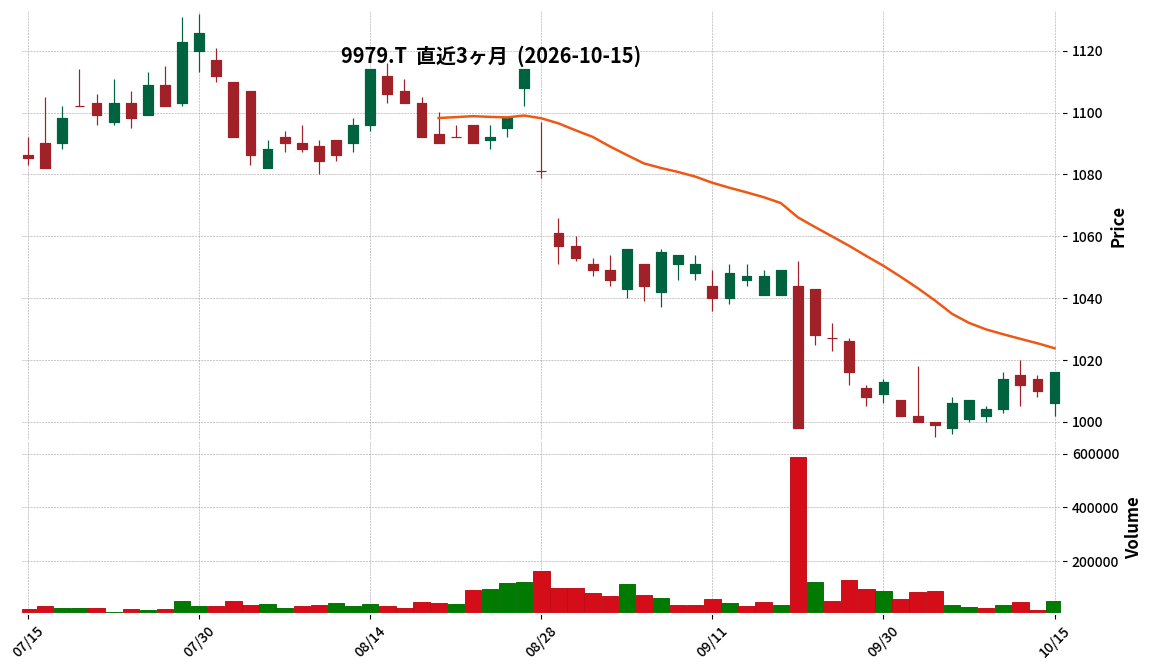
This article is an AI-generated summary and analysis of official IR disclosures.
📄 Announcement (AI-Reviewed)
- Daisho reported consolidated net sales of ¥53,088 million for the fiscal year ended August 2026, a 1.0% increase year-on-year.
- Operating profit was ¥915 million (down 23.5% year-on-year), and ordinary profit was ¥914 million (down 23.6% year-on-year).
- Net income attributable to parent company shareholders was ¥394 million (down 66.4% year-on-year).
- Earnings per share (EPS) were ¥18.78.
- For the fiscal year ending August 2027, the company forecasts consolidated net sales of ¥54,360 million (up 2.4%), operating profit of ¥1,050 million (up 14.7%), and net income attributable to parent company shareholders of ¥580 million (up 47.2%).
- The annual dividend per share for FY2026 and the forecast for FY2027 is ¥14.00 (interim ¥6.00, year-end ¥8.00).
🤖 AI Perspective
While Daisho achieved revenue growth in FY2026, profitability declined significantly compared to the previous year. This suggests that while sales were robust, increasing costs may have pressured margins. The company’s forecast for revenue and profit growth in the upcoming fiscal year indicates an expectation of improved performance, making the impact of ongoing strategies and market conditions on future earnings worth monitoring.
5527|G-propetec
807.0
▼ -0.37%
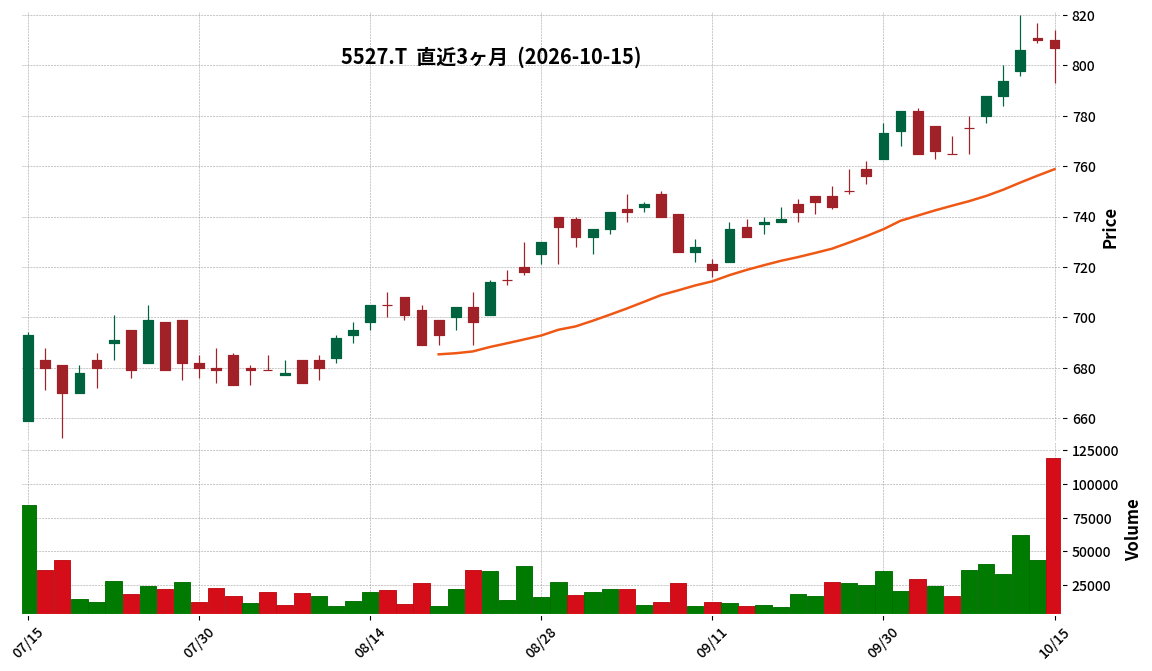
📎 Source:G-propetec Official IR →
This article is an AI-generated summary and analysis of official IR disclosures.
📄 Announcement (AI-Reviewed)
- Property technologies, Inc. (Code: 5527) resolved to revise its dividend forecast (increase) and change/expand its shareholder benefit program at a Board of Directors meeting held on October 15, 2026.
- The revised annual dividend forecast for the fiscal year ending November 2026 is ¥32.00 per share, an increase of ¥7.00 from the previously announced forecast of ¥25.00.
- The reason for the dividend forecast revision is attributed to a comprehensive consideration of current business performance and future financial conditions.
- The shareholder benefit program, targeting shareholders holding 300 shares or more, will change from the previous ¥5,000 QUO card to an expanded ¥6,000 electronic gift.
- The revised shareholder benefit program will apply to shareholders recorded in the shareholder registry as of November 30, 2026.
🤖 AI Perspective
This announcement appears to signal the company’s commitment to strengthening shareholder returns. The increased dividend, combined with the more attractive electronic gift in the shareholder benefit program, could be seen as an effort to reward existing shareholders and attract new investors. These measures may influence investor sentiment and potentially impact the company’s valuation.
7049|G-識学
751.0
▼ -1.44%
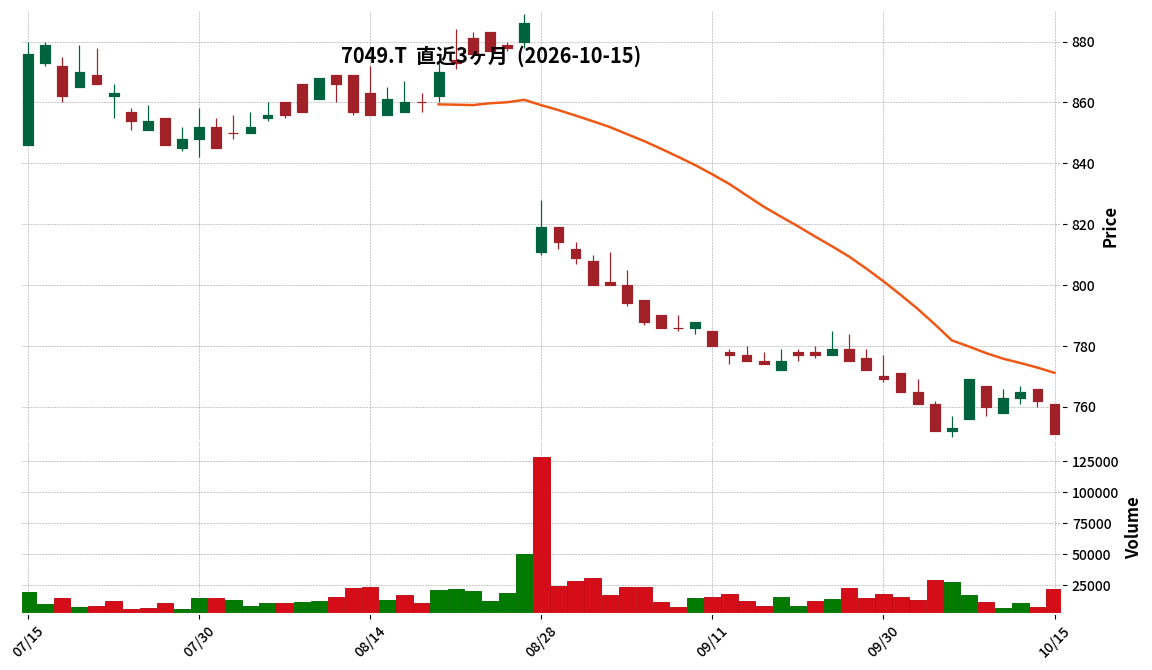
This article is an AI-generated summary and analysis of official IR disclosures.
📄 Announcement (AI-Reviewed)
- For the first half of FY2027, consolidated net sales were ¥2,662 million, representing a 27.6% decrease year-over-year.
- Consolidated operating profit for the same period was a loss of ¥156 million, compared to a profit of ¥840 million in the prior year.
- The primary reason for the revenue decrease was a significant drop in fund business revenue from ¥1,024 million in the prior year to ¥60 million.
- The Organizational Consulting segment reported sales of ¥2,191 million (YoY ▲5.7%) and an operating loss of ¥16 million (compared to an operating profit of ¥10 million in the prior year).
- The Sports Entertainment segment recorded sales of ¥410 million (YoY +25.3%) and an operating profit of ¥57 million (down from ¥78 million in the prior year).
7578|ニチリョク
69.0
▼ -2.82%
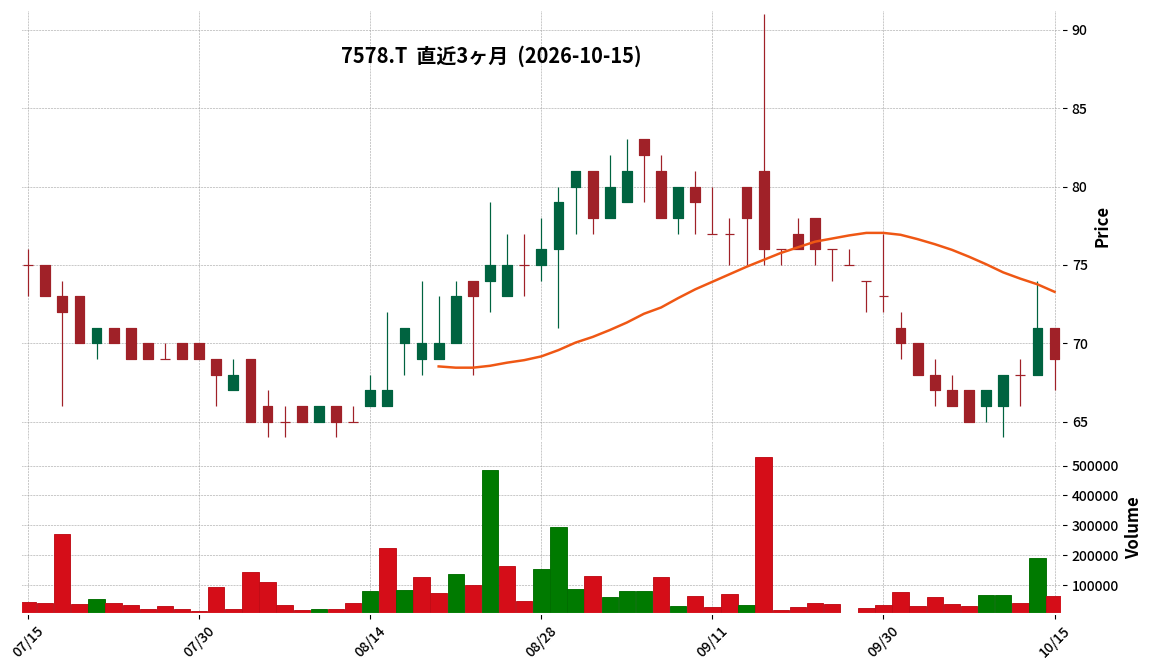
This article is an AI-generated summary and analysis of official IR disclosures.
📄 Announcement (AI-Reviewed)
- Nichiryoku has initiated collaboration with Growth Partners Inc. (GP) based on the business and capital alliance announced on April 16, 2026.
- The collaboration focuses on four projects: strengthening sales capabilities, advancing marketing, reforming cost structures, and enhancing investor relations (IR) activities.
- Sales capability strengthening includes preparing talk scripts and sales tools for each product, which were deployed to branches on October 1, 2026, coinciding with branch function integration.
- Marketing initiatives involve visualizing and monthly verifying cost-effectiveness by advertising medium, while cost structure reforms include reviewing selling, general, and administrative expenses and centralizing branch administrative functions.
- For IR enhancement, the company expanded its lottery-based shareholder benefit program to include columbariums and end-of-life related services, effective September 15, 2026.
🤖 AI Perspective
This IR update suggests Nichiryoku is actively implementing concrete measures to improve profitability in response to evolving business conditions. The collaboration with GP appears to be aimed at strengthening the company’s operational foundation through standardized sales processes, data-driven marketing, and fixed cost reductions. The progress of these initiatives and their eventual impact on the company’s financial performance may be worth monitoring for investors.
3557|G-U&C
476.0
▼ -0.83%
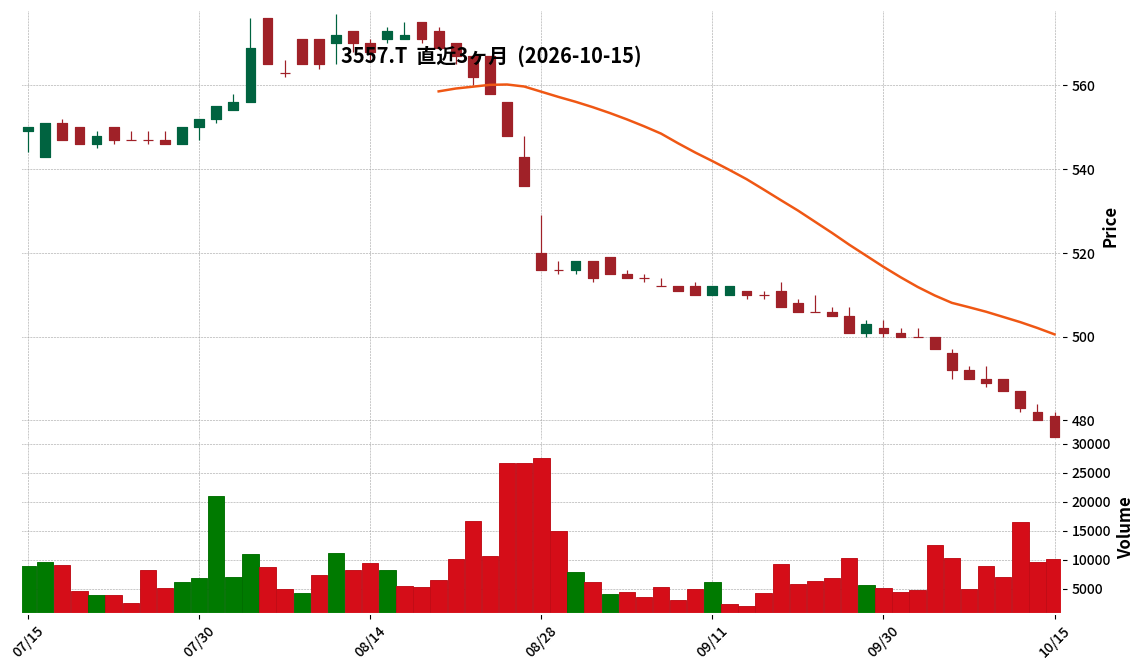
This article is an AI-generated summary and analysis of official IR disclosures.
📄 Announcement (AI-Reviewed)
- United & Collective Co., Ltd. announced a partial correction to its “Consolidated Financial Results for the Fiscal Year ended February 2026 [Japanese GAAP] (Non-consolidated)” originally released on April 14, 2026.
- The corrections affect three sections: “Summary Information (3) Cash Flow Status,” “1. Overview of Business Performance, etc. (3) Overview of Current Period’s Cash Flow,” and “3. Financial Statements and Principal Notes (4) Cash Flow Statement.”
- Cash flow from investing activities for the fiscal year ended February 2026 was corrected from “△602 million yen” to “△402 million yen.”
- Cash and cash equivalents at the end of the fiscal year ended February 2026 were corrected from “1,318 million yen” to “1,518 million yen.”
- The decrease in cash flow from investing activities was revised from 602,162 thousand yen to 402,162 thousand yen.
- The change in cash and cash equivalents was revised from a decrease of △161,293 thousand yen to an increase of 38,706 thousand yen.
🤖 AI Perspective
This correction primarily addresses errors in the cash flow from investing activities for the fiscal year ended February 2026, leading to a subsequent adjustment in the period-end cash and cash equivalents. The reduction in the decrease of cash flow from investing activities and the increase in period-end cash equivalents could influence the perception of the company’s liquidity. Investors may wish to assess how these corrected figures impact their understanding of the company’s financial position.
293A|P-BABY JOB
950.0
▲ +0.00%
📎 Source:P-BABY JOB Official IR →
This article is an AI-generated summary and analysis of official IR disclosures.
📄 Announcement (AI-Reviewed)
- P-BABY JOB announced its Q2 FY2027 financial results on October 15, 2026.
- For the second quarter, revenue was ¥2,687 million (up 33.8% YoY), operating profit was ¥298 million (up 138.2% YoY), and net profit attributable to parent company shareholders was ¥192 million (up 153.4% YoY).
- Key Performance Indicators (KPIs) showed diaper subscription users increased to 177,492 (up 38.9% from previous fiscal year-end) and contracted facilities rose to 10,327 (up 11.0% from previous fiscal year-end).
- The achievement rate against the full-year forecast at the end of Q2 was 48.5% for revenue, 69.1% for operating profit, and 68.3% for net profit attributable to parent company shareholders.
- On the consolidated balance sheet, total assets increased by ¥180 million from the previous fiscal year-end to ¥1,706 million, total liabilities increased by ¥39 million to ¥697 million, and total net assets increased by ¥174 million to ¥879 million.
🤖 AI Perspective
The significant year-over-year increases in both revenue and various profit metrics, particularly the 138.2% surge in operating profit, are noteworthy. This growth appears to be primarily driven by the consistent expansion in the number of contracted facilities and subscription users for the diaper service. The high progress rate towards full-year profit targets in Q2 suggests potential for continued strong performance, which investors may find worth monitoring.
3547|ユニシアHD
1941.0
▼ -0.56%
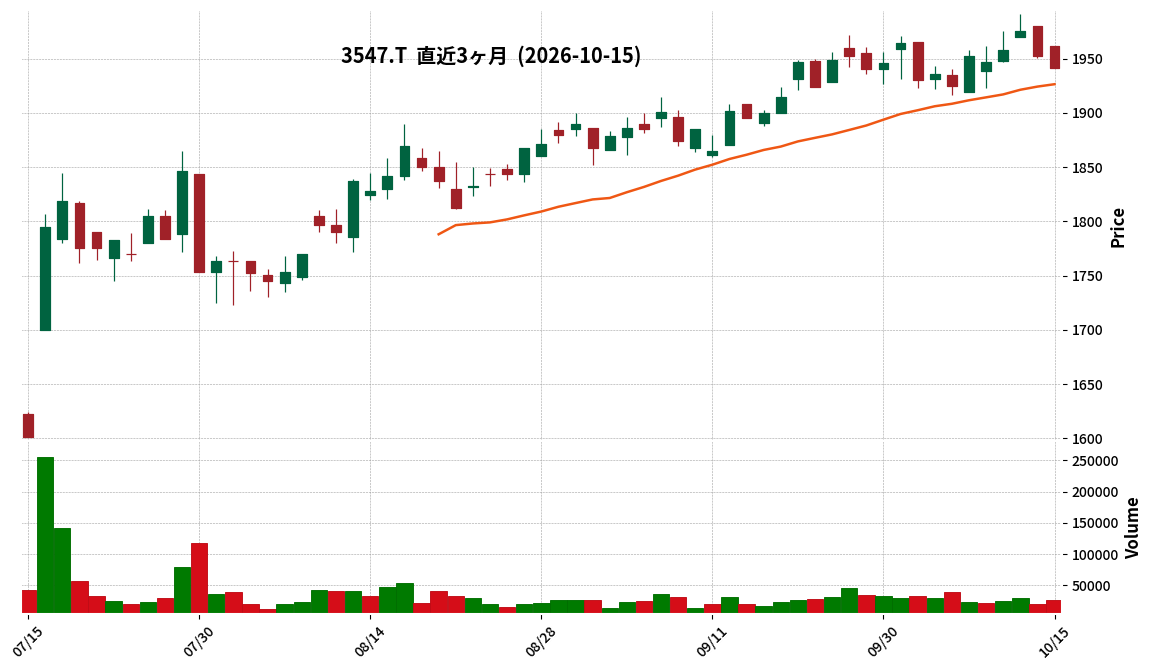
This article is an AI-generated summary and analysis of official IR disclosures.
📄 Announcement (AI-Reviewed)
- For the third quarter of fiscal year 2026, Unisia HD reported consolidated sales revenue of ¥27,358 million, representing a 75.0% increase year-on-year.
- Operating profit reached ¥1,226 million (up 18.8% YoY) and ordinary profit was ¥1,123 million (up 5.3% YoY).
- Net income attributable to owners of parent was ¥517 million, marking a 38.8% decrease compared to the same period last year.
- Pisola Co., Ltd. joined the Unisia Group during this consolidated quarter, resulting in a change in the scope of consolidation.
- The company has decided to transfer its House Meal business to Senrei Co., Ltd., and a provision for business transfer loss has been recorded.
🤖 AI Perspective
Unisia HD’s Q3 results show substantial growth in sales revenue, EBITDA, and operating profit, which may suggest positive impacts from the newly consolidated subsidiary and aggressive store expansion strategies. However, the decline in net income attributable to owners of parent, potentially due to the recording of a provision for business transfer loss, could indicate the financial implications of the company’s ongoing business portfolio restructuring. Investors might consider monitoring the future developments and outcomes of these strategic shifts.
5130|P-ヒロHD
—
▲ +0.00%
This article is an AI-generated summary and analysis of official IR disclosures.
📄 Announcement (AI-Reviewed)
- P-Hiro HD announced its consolidated financial results for the fiscal year ended August 2026.
- Consolidated net sales were ¥2,404 million (down 6.5% year-on-year), operating profit was ¥150 million (down 27.4%), ordinary profit was ¥134 million (down 39.0%), and net profit attributable to parent company shareholders was ¥87 million (down 26.0%).
- By segment, net sales for the Consumer Communications Business were ¥2,341 million (down 3.9% year-on-year), Zeta Business sales were ¥21 million (down 73.8%), and Other Businesses sales were ¥41 million (down 20.4%).
- The equity ratio at the end of August 2026 improved to 20.0% (from 15.1% at the end of the previous period).
- For the fiscal year ending August 2027, the company forecasts consolidated net sales of ¥2,676 million (up 11.3% year-on-year), operating profit of ¥178 million (up 18.9%), ordinary profit of ¥166 million (up 23.9%), and net profit attributable to parent company shareholders of ¥101 million (up 15.3%).
🤖 AI Perspective
P-Hiro HD’s fiscal year ended August 2026 saw a decrease in net sales and all profit metrics compared to the previous period. The significant decline in the Zeta business, attributed to a reaction to demand related to the Osaka-Kansai Expo and upfront investments, suggests the company is navigating evolving business environments. However, the improvement in the equity ratio and the forecast for revenue and profit growth in the upcoming fiscal year may indicate expectations for business model transformation and future growth strategies.
589A|G-ネイス
1290.0
▼ -4.59%
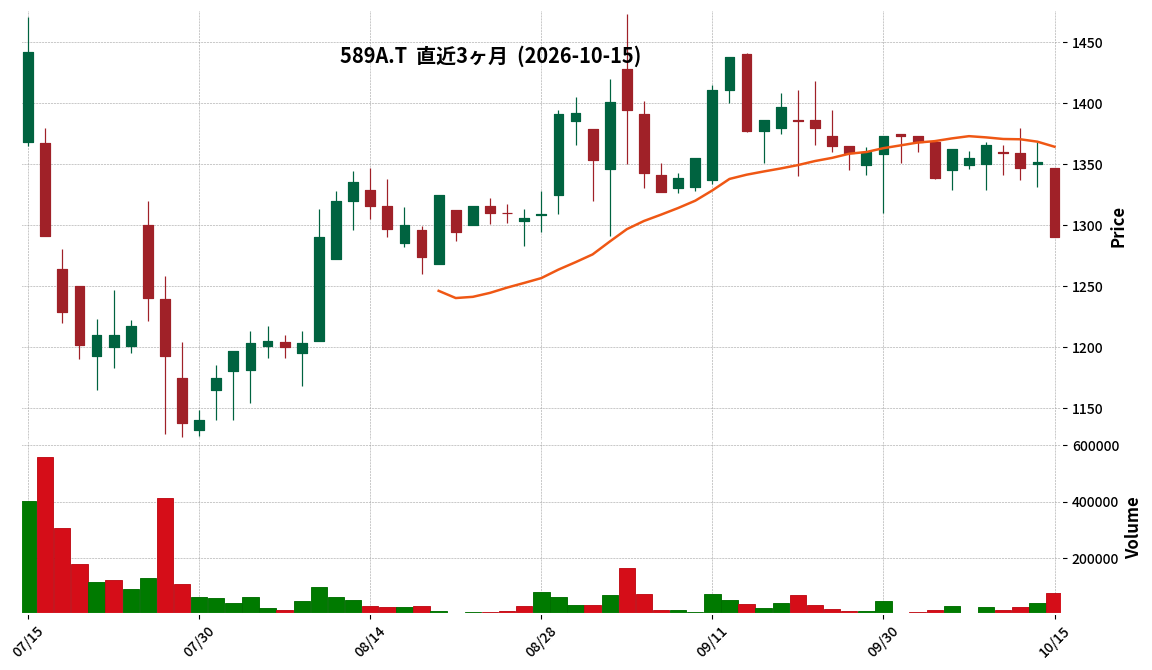
This article is an AI-generated summary and analysis of official IR disclosures.
📄 Announcement (AI-Reviewed)
- G-NEIS announced its full-year results for the fiscal year ending August 2026, with net sales of 3,654 million JPY (+0.1% vs plan, +28.0% YoY) and ordinary profit of 606 million JPY (-10.8% vs plan, +69.0% YoY).
- During the period, 47 new stores were opened, a record high, and measures such as membership fee increases were implemented. However, a fire at the Yotsuya school and organizational reinforcement during the period negatively impacted profits.
- For the fiscal year ending August 2027, the company forecasts net sales of 4,350 million JPY (+19.0% YoY) and ordinary profit of 450 million JPY (-25.8% YoY), with plans for 58 new store openings.
- Financially, cash and deposits increased by 868 million JPY due to public offerings and other factors, improving the equity ratio from 15.1% to 33.5%.
- In the gymnastics school business, new franchise affiliations progressed smoothly, and the first store in Hokkaido by Studio Alice’s new subsidiary, Alice Next Base Co., Ltd., is set to open in November 2026.
🤖 AI Perspective
G-NEIS’s FY2026 results showed significant revenue and profit growth, though ordinary profit fell short of the plan. This appears to be due to increased revenue from new store openings and fee hikes, while the Yotsuya school fire and organizational strengthening investments for future growth temporarily suppressed profits. With further expansion planned for the next fiscal year, the progress of how these organizational investments contribute to future revenue and profit growth will be a key point for investors to monitor.
602A|P-レックス
560.0
▲ +0.00%
This article is an AI-generated summary and analysis of official IR disclosures.
📄 Announcement (AI-Reviewed)
- P-REX announced on October 15, 2026, its Board of Directors decided to absorb its wholly-owned subsidiary, YUMECATALYST LLC.
- The merger aims to integrate YUMECATALYST LLC’s business operations, centralize management, improve operational efficiency, effectively utilize management resources, and enhance corporate value.
- The effective date of the merger is scheduled for December 1, 2026, contingent on approval at an extraordinary general meeting of shareholders on November 26, 2026.
- P-REX (REX ADVISORS CO., LTD.) will be the surviving company, and YUMECATALYST LLC will be dissolved.
- As this is an absorption merger with a wholly-owned subsidiary, no shares or cash will be allocated.
🤖 AI Perspective
This absorption merger, involving a wholly-owned subsidiary, appears to focus on centralizing management and enhancing operational efficiency within the group. Such a move could lead to optimized resource allocation and potentially contribute to long-term corporate value. The company has stated that the impact on financial performance is currently under review, and further disclosures will be worth monitoring for investors.
9215|G-CaSy
1000.0
▼ -0.40%
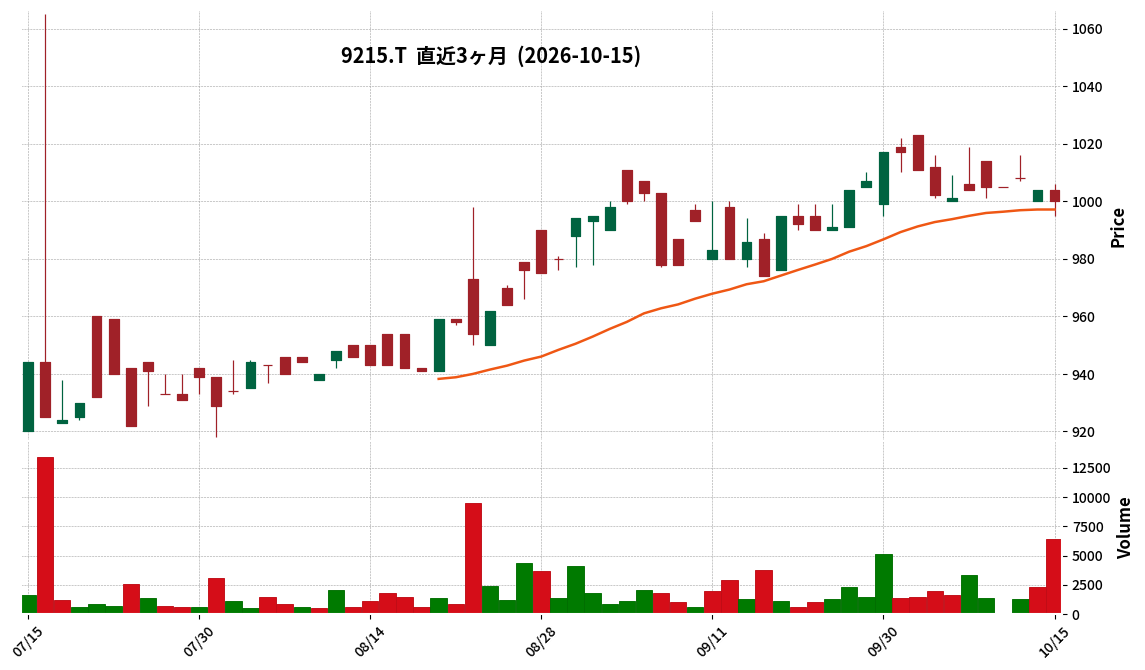
This article is an AI-generated summary and analysis of official IR disclosures.
📄 Announcement (AI-Reviewed)
- G-CaSy’s consolidated net sales for the third quarter of the fiscal year ending November 2026 (December 1, 2025 – August 31, 2026) reached ¥1,596 million, marking a 16.0% increase year-on-year.
- During the same period, operating income was ¥△0 million, ordinary income was ¥1 million (down 94.1% year-on-year), and net income attributable to owners of the parent was ¥△1 million.
- Diluted EPS for the quarter was ¥△0.73.
- The consolidated full-year forecast for FY2026 has been revised: net sales are projected at ¥2,150 million (up 11.9% year-on-year), operating income at ¥△50 million, ordinary income at ¥△48 million, and net income attributable to owners of the parent at ¥△51 million.
- As of the end of the third quarter, total assets stood at ¥740 million, net assets at ¥273 million, and the equity ratio was 36.9%.
🤖 AI Perspective
While revenue shows a positive year-on-year growth, the decline or loss across various profit indicators, particularly the shift to a net loss attributable to owners of the parent, is a key point for investors to consider. The downward revision of the full-year earnings forecast also suggests potential challenges in profitability. However, the growing demand in the domestic support service market and increased government subsidies for such services could provide a tailwind for the company’s future growth.
3627|テクミラ
263.0
▼ -0.75%
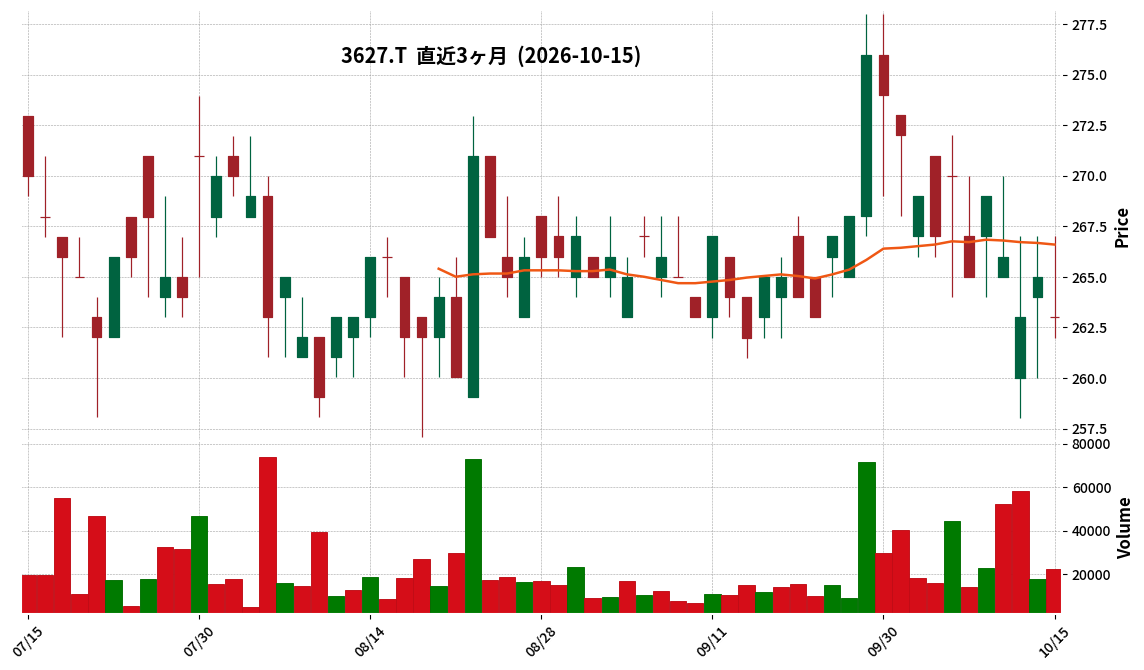
This article is an AI-generated summary and analysis of official IR disclosures.
📄 Announcement (AI-Reviewed)
- Tecmira Holdings announced its financial results for the second quarter of the fiscal year ending February 2027.
- Consolidated net sales reached ¥5,297 million (up 9% year-on-year), and adjusted EBITDA was ¥408 million (up 334% year-on-year).
- Ordinary profit turned positive at ¥32 million (an improvement from a ¥180 million loss in the prior year period), and net loss attributable to owners of the parent improved to ¥55 million (from a ¥206 million loss).
- The Life Design business segment saw a 46% increase in revenue year-on-year, driven by the strong sales of the new game “Culdcept Begins,” with the segment turning profitable.
- The IoT & Devices business segment maintained revenue growth year-on-year, despite impacts from external factors such as soaring semiconductor memory prices and supply restrictions.
🤖 AI Perspective
Tecmira Holdings’ Q2 results highlight significant growth in revenue and adjusted EBITDA, primarily driven by the strong performance of its new game in the Life Design segment, which notably contributed to the turnaround in ordinary profit. While the overall results show strong improvement, the IoT & Devices segment’s performance, influenced by external market conditions, may be worth monitoring going forward. This suggests a mixed performance across segments despite overall positive consolidated figures.
362A|P-エクシオHD
4950.0
▲ +0.00%
📎 Source:P-エクシオHD Official IR →
This article is an AI-generated summary and analysis of official IR disclosures.
📄 Announcement (AI-Reviewed)
- P-EXEO HD announced on October 15, 2026, that its Board of Directors resolved a stock split and related amendments to its Articles of Incorporation.
- The company will split its common stock at a ratio of 10 shares for every 1 share, with October 31, 2026 (Saturday) as the record date.
- The total number of outstanding shares after the split will be 2,100,000, and the total number of authorized shares will be 8,400,000.
- The effective date of the stock split is November 2, 2026 (Monday), and there will be no change in the amount of stated capital.
- Concurrently, the exercise prices and the number of shares underlying the existing stock acquisition rights (1st to 5th series) will be adjusted.
🤖 AI Perspective
This stock split aims to lower the investment unit per share, potentially enhancing liquidity and expanding the investor base. This move could make the company’s shares more accessible to a broader range of investors. The increase in the total number of authorized shares also suggests the company is securing options for future flexible financing or organizational restructuring.
💡 Start investing with IR insights


※ 本ページには広告が含まれます(PR)
Disclaimer: This article is for informational purposes only and does not constitute investment advice. All investment decisions are at your own risk.

コメント