
📌 Today’s Highlights
Today we cover 91 IR announcements. Notable among them: スカパーJSAT (9412), インフロニアHD (5076), MARUWA (5344). Use the table of contents below to navigate to each company.
- 9412|スカパーJSAT
- 5076|インフロニアHD
- 5344|MARUWA
- 178A|GX革新優良企業
- 3190|ホットマン
- 1897|金下建設
- 3563|F&LC
- 8282|ケーズHD
- 2371|カカクコム
- 4528|小野薬
- 5015|BPカストロール
- 6758|ソニーグループ
- 8173|Joshin
- 2193|COOKPAD
- 4792|山田コンサル
- 5941|中西製作所
- 3663|セルシス
- 3766|システムズD
- 4025|多木化学
- 5729|日精鉱
- 6023|ダイハツインフィ
- 7013|IHI
- 8084|RYODEN
- 9362|兵機海運
- 9432|NTT
- 9902|日伝
- 4556|カイノス
- 5464|モリ工業
- 5830|いよぎんHD
- 6085|G-アーキテクツSJ
- 2883|大冷
- 3839|ODK
- 3946|トーモク
- 4417|G-グローバルセキュ
- 5411|JFE
- 6326|クボタ
- 6340|渋谷工
- 7989|立川ブライ
- 8020|兼松
- 8367|南都銀
- 7203|トヨタ自
- 6062|チャームケア
- 9359|伊勢湾海
- 1899|福田組
- 2461|ファンコミ
- 5186|ニッタ
- 5380|新東
- 6470|大豊工業
- 7791|ドリームベッド
- 7963|興研
- 8864|空港施設
- 9532|大瓦斯
- 6929|日セラミック
- 6327|北川精機
- 1382|ホーブ
- 151A|G-ダイブ
- 2693|YKT
- 2790|ナフコ
- 2914|JT
- 3238|セントラル総
- 3252|地主
- 3286|トラストHD
- 3302|帝繊維
- 3712|情報企画
- 4769|IC
- 7875|竹田iP
- 9753|IXナレッジ
- 303A|G-visumo
- 4563|G-アンジェス
- 4958|長谷川香
- 7224|新明和工
- 8113|ユニチャーム
- 8996|ハウスフリーダム
- 9339|コーチ・エィ
- 9376|ユーラシア
- 9413|テレ東HD
- 9421|エヌジェイHD
- 3823|WHY HOW DO
- 7273|イクヨ
- 7578|ニチリョク
- 8798|アドバンスクリエイト
- 4970|東洋合成
- 7980|重松製作
- 9444|トーシンHD
- 4335|IPSHD
- 2160|G-GNI
- 6877|OBARA-G
- 9973|KOZOHD
- 3083|スターシーズ
- 8158|ソーダニッカ
- 2678|アスクル
9412|スカパーJSAT
3485.0
▼ -0.85%
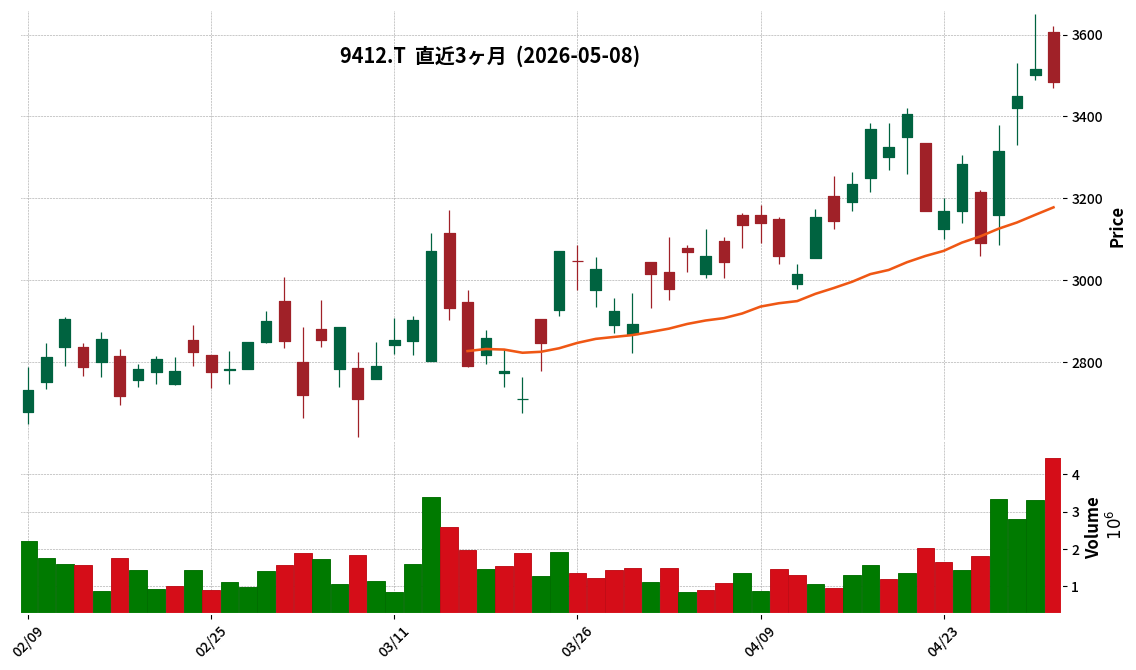
📎 Source:スカパーJSAT Official IR →
This article is an AI-generated summary and analysis of official IR disclosures.
📄 Announcement (AI-Reviewed)
- On May 8, 2026, SKY Perfect JSAT Corporation announced a correction to a part of its “SKY Perfect JSAT Group FY2026 Full-Year Financial Results Briefing Material.”
- The correction pertains to the FY2026 figures for “Security Sector Revenue Targets” on page 21 of the briefing material, which was originally disclosed on April 28, 2026.
- The revenue target for the Space Intelligence business was revised from the incorrect figure of ¥9.6 billion to the corrected figure of ¥11.3 billion.
- Concurrently, the revenue target for the Communication-related business was revised from the incorrect figure of ¥10.1 billion to the corrected figure of ¥8.4 billion.
- There are no corrections to the previously announced financial results (Kessan Tanshin).
🤖 AI Perspective
This correction specifically addresses figures within the earnings presentation material, with no impact on the previously disclosed official financial results. The revision of revenue targets within the security sector, showing an upward adjustment for the Space Intelligence business and a downward adjustment for the Communication-related business, may suggest a refined focus or evolving growth expectations within this segment. Investors might consider these updated figures when assessing the company’s strategic emphasis and future revenue drivers in the security domain.
5076|インフロニアHD
2155.5
▲ +0.00%
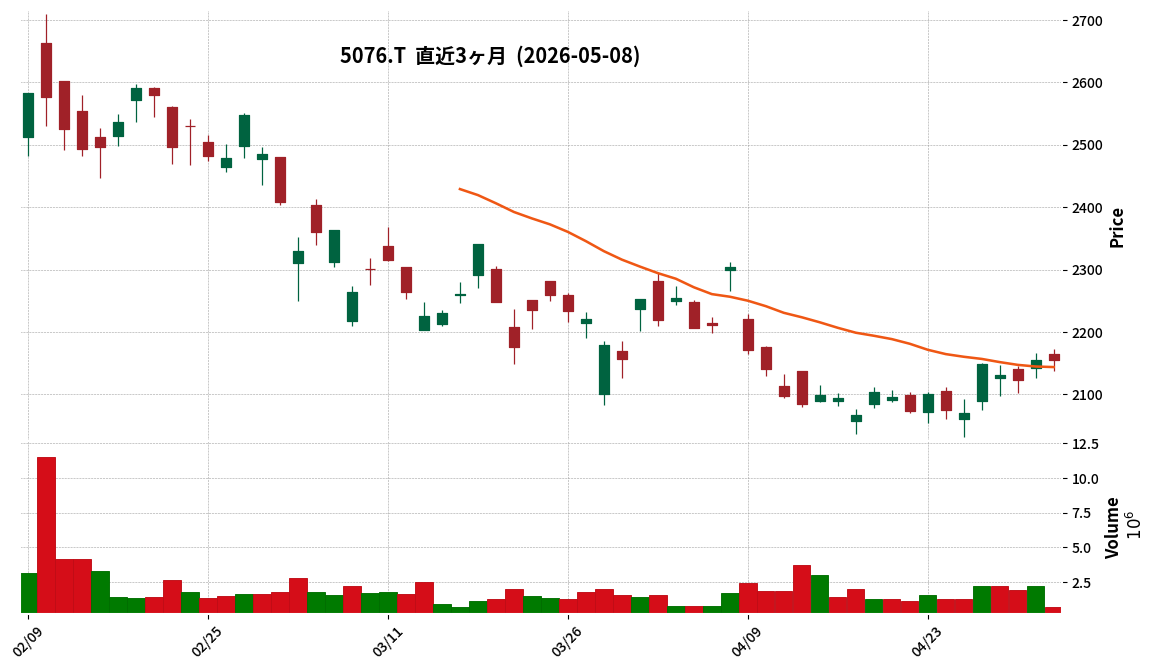
📎 Source:インフロニアHD Official IR →
This article is an AI-generated summary and analysis of official IR disclosures.
📄 Announcement (AI-Reviewed)
- INFRONEER Holdings has revised its consolidated earnings forecast for the fiscal year ending March 31, 2026. Net profit attributable to owners of the parent company is now projected at ¥76.5 billion, a 27.5% increase from the previous forecast of ¥60.0 billion.
- Operating profit (事業利益) is expected to rise by 8.8% to ¥84.1 billion from ¥77.3 billion, and profit before income taxes by 15.6% to ¥107.2 billion from ¥92.7 billion.
- Revenue, however, was slightly revised down by 0.4% from ¥1,130.0 billion to ¥1,125.0 billion.
- The revisions are attributed to factors such as the successful acquisition of design changes in the building and civil engineering businesses for operating profit, and the recognition of valuation gains on financial assets for profit before income taxes and net profit.
- The company decided to increase the year-end dividend for common stock to ¥90.00 per share, with a record date of March 31, 2026. This results in an annual dividend of ¥120.00 per share (interim ¥30.00, year-end ¥90.00), up from the previous forecast of ¥62.00.
🤖 AI Perspective
- The significant upward revision in net profit, despite a slight decrease in revenue, may suggest an improvement in the company’s profitability or cost management effectiveness.
- The substantial increase in the annual common stock dividend, aligned with the mid-term management plan’s policy of a dividend payout ratio of 40% or more and a minimum dividend of ¥60, indicates a strong commitment to shareholder returns.
- As valuation gains on financial assets contributed to the increase in profit, investors may want to monitor the sustainability of core business earnings going forward.
5344|MARUWA
74010.0
▲ +0.83%
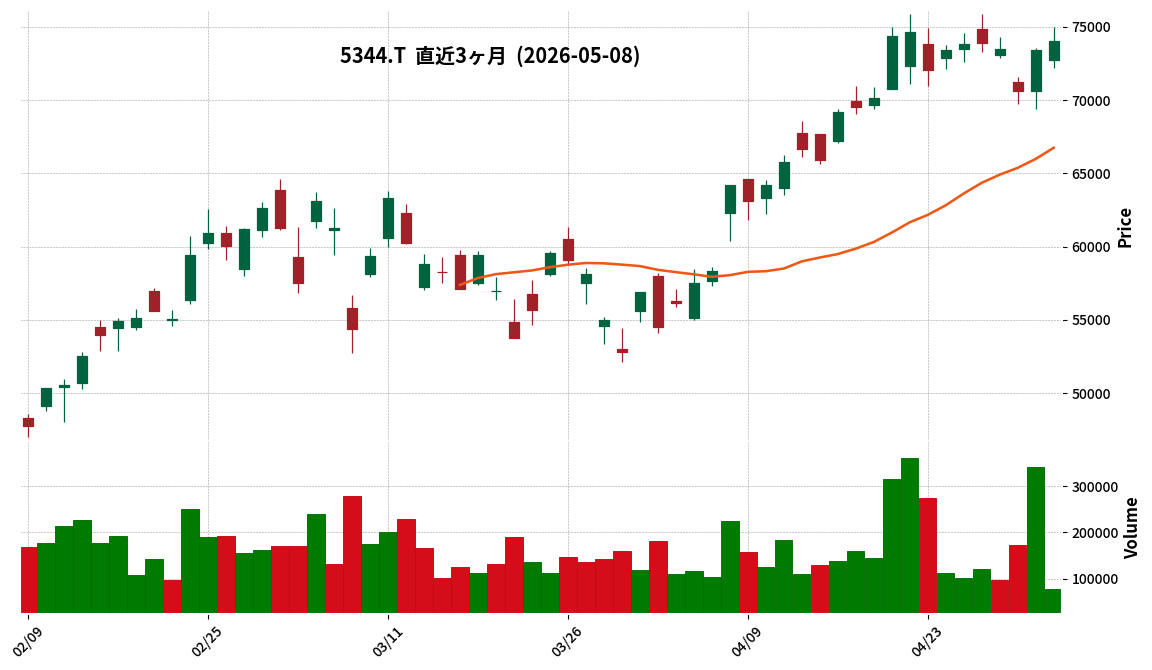
This article is an AI-generated summary and analysis of official IR disclosures.
📄 Announcement (AI-Reviewed)
- **FY2026 Consolidated Financial Results:**
- Net sales reached ¥74,476 million, a 3.7% increase year-on-year.
- Operating profit decreased by 7.2% to ¥24,976 million, ordinary profit decreased by 2.6% to ¥26,321 million, and profit attributable to owners of parent decreased by 5.6% to ¥18,163 million.
- The operating profit margin on net sales was 33.5%, and the ROE was 13.2%.
- **Segment Performance:**
- The Ceramic Parts Business reported net sales of ¥63,797 million (up 2.1% YoY) and segment profit of ¥24,573 million (down 9.3% YoY). This segment experienced weakness in the automotive market and delays in some semiconductor-related areas, but next-generation high-speed communication remained strong, with mass production of next-generation models starting in the fourth quarter.
- The Lighting Equipment Business reported net sales of ¥10,679 million (up 14.1% YoY) and segment profit of ¥2,141 million (up 49.0% YoY), driven by increased LED demand and high value-added lighting.
- **Financial Position and Cash Flow:**
- Total assets at the end of the period were ¥162,691 million (up ¥20,405 million from previous year-end), and net assets were ¥147,262 million (up ¥19,408 million from previous year-end). The equity ratio was 90.5%.
- Cash flow from operating activities was ¥16,933 million, while cash flow from investing activities was △¥21,757 million.
- **Dividend Information:**
- The annual dividend per share for FY2026 increased by ¥8 from the previous year, totaling ¥102.00.
- **FY2027 Consolidated Financial Forecast:**
- The company forecasts net sales of ¥84,100 million (up 12.9% YoY) and operating profit of ¥29,700 million (up 18.9% YoY).
- An annual dividend of ¥110.00 per share (up ¥8 YoY) is projected.
- **Key Highlights:**
- The fourth quarter achieved record-high sales and profits, driven by the launch of next-generation high-speed communication related models. Delays in general-purpose memory recovery and initial yield rate issues for some new products are reportedly on track for resolution.
🤖 AI Perspective
MARUWA’s FY2026 results indicated revenue growth but a decline in profits, which appears to be influenced by a softening in the automotive market and some delays in the semiconductor sector. However, strong performance in next-generation high-speed communication, especially a record-breaking fourth quarter, could suggest a significant growth driver for the company. The positive FY2027 outlook, including projected increases in both sales and operating profit, along with planned dividend hikes, may reflect management’s confidence in continued expansion, potentially led by high-speed communication technologies. The consistently high equity ratio of 90.5% also highlights the company’s robust financial stability, which is worth monitoring.
178A|GX革新優良企業
1613.0
▼ -0.25%
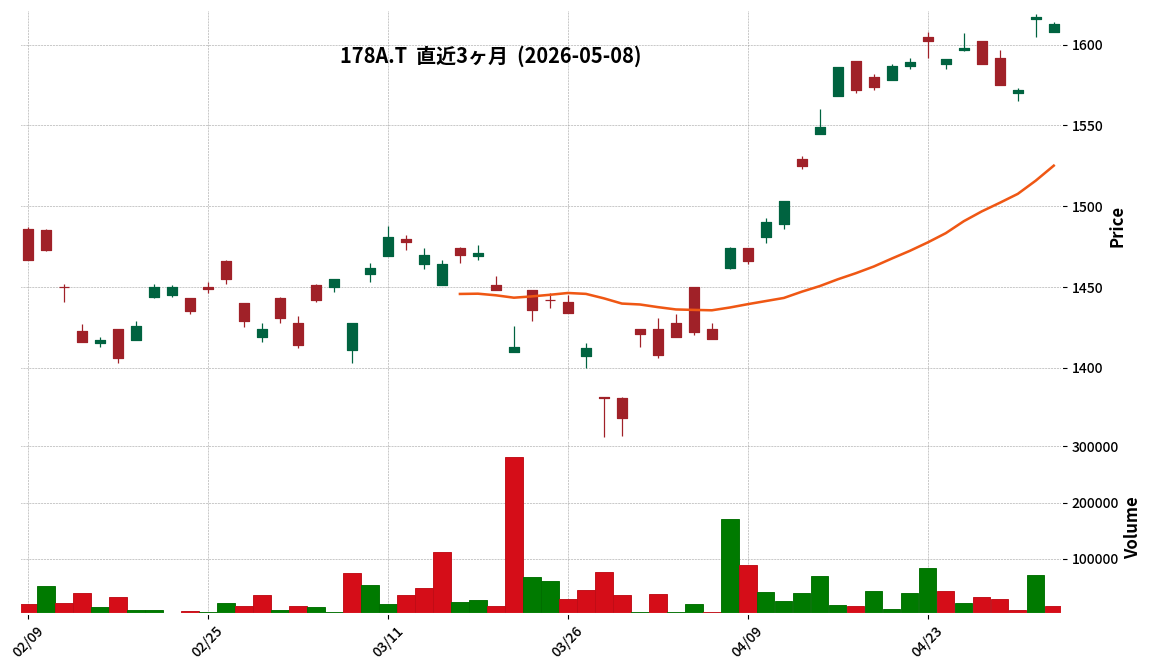
📎 Source:GX革新優良企業 Official IR →
This article is an AI-generated summary and analysis of official IR disclosures.
📄 Announcement (AI-Reviewed)
- Global X Innovative Bluechip ETF (Code: 178A) announced its financial results for the period from September 25, 2025, to March 24, 2026 (FY2026/3).
- Total net assets at the end of the period stood at JPY 4,477 million, a decrease from the previous period’s end (JPY 4,613 million).
- The Net Asset Value (NAV) per 100 units increased to JPY 144,448, up from JPY 139,789 at the end of the previous period.
- No distribution was declared for the current period (JPY 0 per 100 units), compared to JPY 300 in the prior period.
- Net income for the period was JPY 172 million, representing a significant decrease from the JPY 1,113 million reported in the previous period.
- In the statement of income, foreign exchange gains exceeded JPY 346 million, while losses from securities trading and derivative transactions exceeded JPY 132 million and JPY 41 million, respectively.
🤖 AI Perspective
The operational results indicate that while the NAV per 100 units increased, total net assets and outstanding units decreased, suggesting that redemptions outpaced subscriptions during the period. Despite no distribution, the fund secured net income, primarily due to significant foreign exchange gains which offset losses from securities trading and derivative transactions. This highlights the substantial impact of currency fluctuations on the fund’s performance, given its reference index is yen-denominated.
3190|ホットマン
573.0
▲ +0.70%
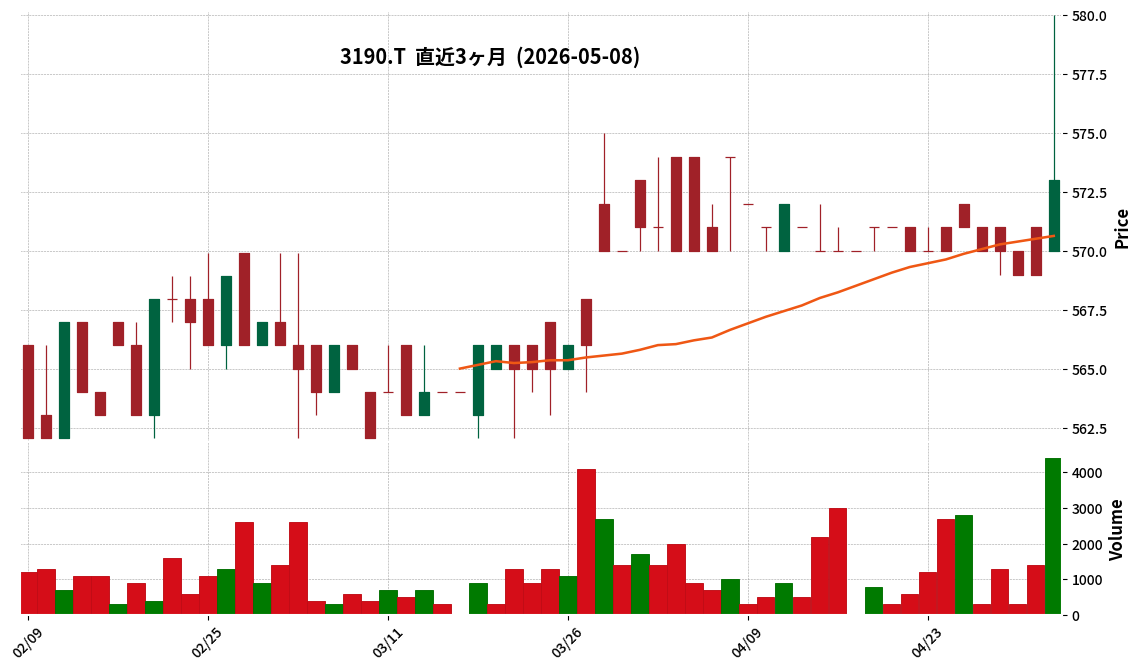
This article is an AI-generated summary and analysis of official IR disclosures.
📄 Announcement (AI-Reviewed)
- Hotman Co., Ltd. (3190) resolved to increase its surplus dividend at the Board of Directors meeting held on May 8, 2026.
- The dividend per share for the record date of March 31, 2026, has been set at 11 yen.
- This represents an upward revision of 1 yen from the most recent dividend forecast of 10 yen per share, which was announced on May 9, 2025.
- The actual dividend for the previous fiscal year (FY2025/3) was 10 yen per share.
- The total dividend amount is 77 million yen, with an effective date of June 5, 2026.
🤖 AI Perspective
[COMMENTARY]
This dividend increase by Hotman may suggest the company’s confidence in its operational performance for the fiscal year ending March 2026 and its future business prospects. The decision aligns with its stated basic policy of providing stable and continuous dividends while securing necessary internal reserves for future growth and strengthening its management foundation. Investors may observe that the company maintains its policy of a single year-end dividend payout.
1897|金下建設
3455.0
▲ +0.73%
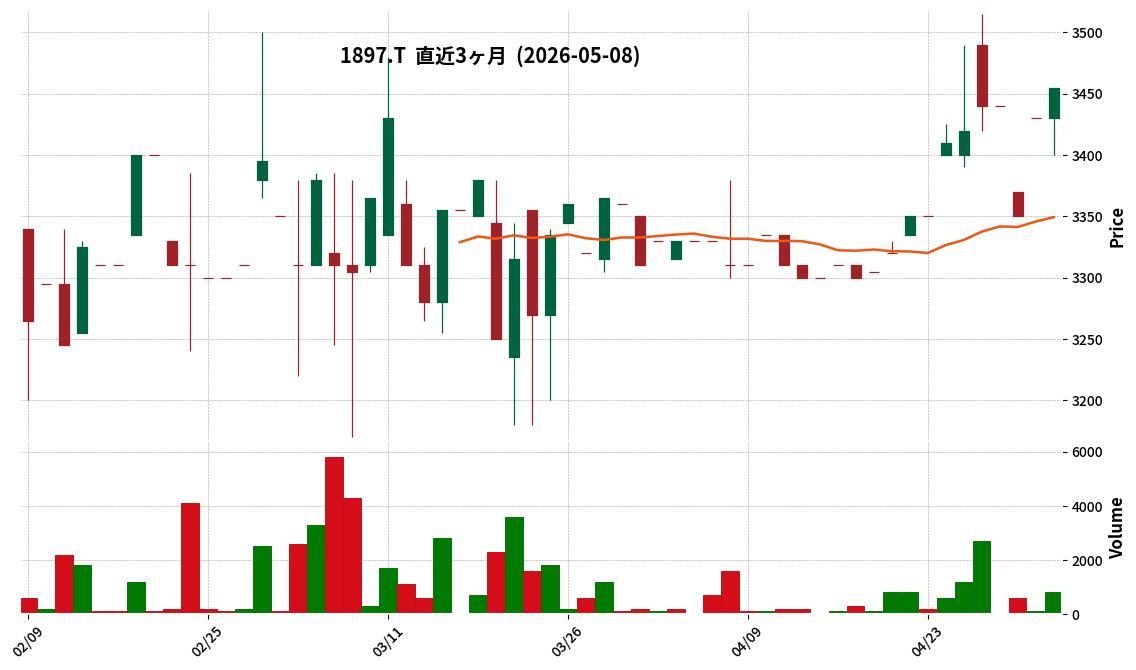
This article is an AI-generated summary and analysis of official IR disclosures.
📄 Announcement (AI-Reviewed)
- Kaneshita Construction Co., Ltd. announced its consolidated financial results for the first quarter of the fiscal year ending December 2026 (January 1, 2026 – March 31, 2026) on May 8, 2026.
- Consolidated net sales increased by 17.4% year-on-year to JPY 2,699 million. Operating profit rose by 1.1% to JPY 184 million, ordinary profit by 8.4% to JPY 202 million, and net profit attributable to owners of parent increased by 3.6% to JPY 121 million.
- By segment, the Construction Business recorded net sales of JPY 2,581 million (up 16.7%) and orders received of JPY 2,007 million (up 4.4%). The Manufacturing and Sales Business, etc., reported net sales of JPY 203 million (up 14.6%) and segment profit of JPY 26 million (up 684.5%).
- As of the end of the first quarter, consolidated total assets stood at JPY 24,458 million, net assets at JPY 20,300 million, and the equity ratio was 81.4%.
- The consolidated full-year earnings forecast for the fiscal year ending December 2026, as well as the dividend forecast (year-end JPY 50.00, total annual JPY 50.00), remain unchanged from the latest publicly announced figures.
🤖 AI Perspective
- The first quarter of the fiscal year ending December 2026 saw Kaneshita Construction achieve increased revenue and profits, driven by higher sales in both the Construction Business and the Manufacturing and Sales Business segments.
- Despite the positive start to the year with growth in sales and various profit metrics amidst a challenging business environment, the company has maintained its full-year consolidated earnings forecast, which may suggest a cautious outlook on future business developments or potential cost fluctuations.
- The equity ratio of 81.4% indicates continued strong financial health, reinforcing the company’s stable financial position.
3563|F&LC
10435.0
▲ +8.90%
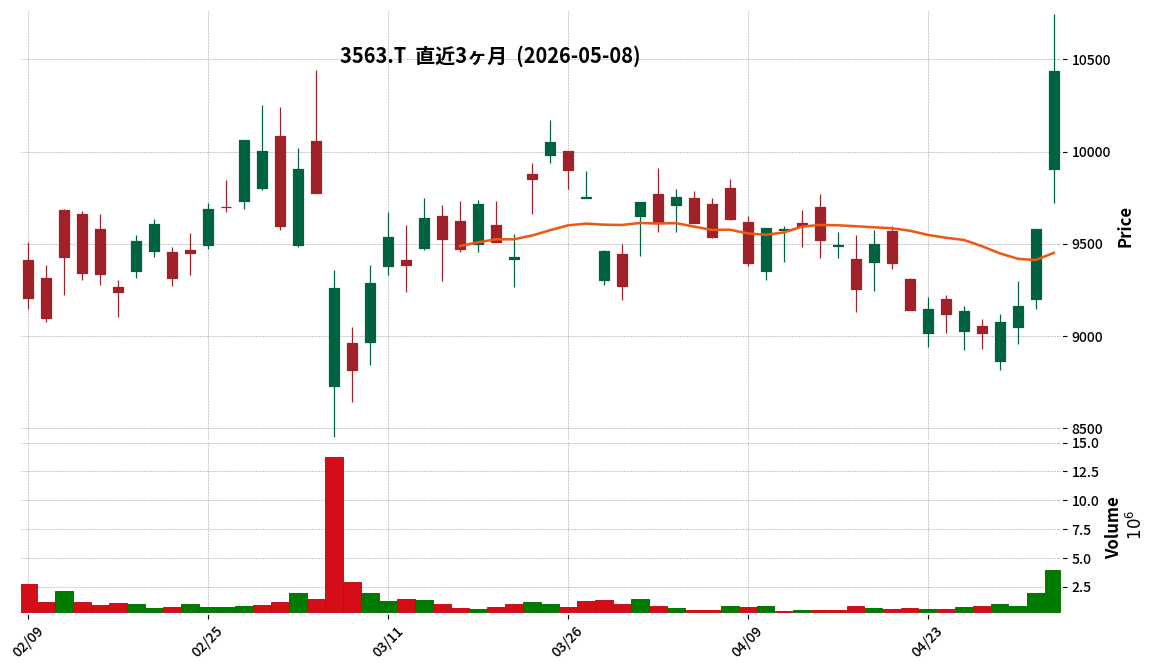
This article is an AI-generated summary and analysis of official IR disclosures.
📄 Announcement (AI-Reviewed)
- FOOD & LIFE COMPANIES (F&LC) announced its consolidated financial results for the second quarter of the fiscal year ending September 2026 on May 8, 2026, covering the period from October 1, 2025, to March 31, 2026.
- For the interim period, consolidated revenue reached 254,182 million yen (up 24.7% year-on-year), operating profit was 28,080 million yen (up 43.7% year-on-year), and net profit attributable to owners of the parent was 17,788 million yen (up 49.9% year-on-year).
- The company revised its full-year consolidated earnings forecast for the fiscal year ending September 2026, projecting revenue of 505,000 million yen (up 17.6% year-on-year), operating profit of 48,500 million yen (up 34.4% year-on-year), and net profit attributable to owners of the parent of 30,000 million yen (up 30.8% year-on-year).
- F&LC announced a stock split at a ratio of two shares for every one common share, effective July 1, 2026.
- In conjunction with the stock split, the forecast for the year-end dividend per share for the fiscal year ending September 2026 was revised to 20.00 yen (40 yen before considering the stock split).
🤖 AI Perspective
- The significant increase in revenue and profits for the interim period appears to be driven by robust performance in both its domestic and overseas Sushiro businesses, along with proactive strategic initiatives.
- The upward revision of the full-year earnings and dividend forecasts may suggest a positive outlook on the sustained growth of existing operations.
- The announced stock split could aim to lower the per-unit investment amount, potentially making the shares more accessible to a broader range of investors.
8282|ケーズHD
1751.5
▼ -0.26%
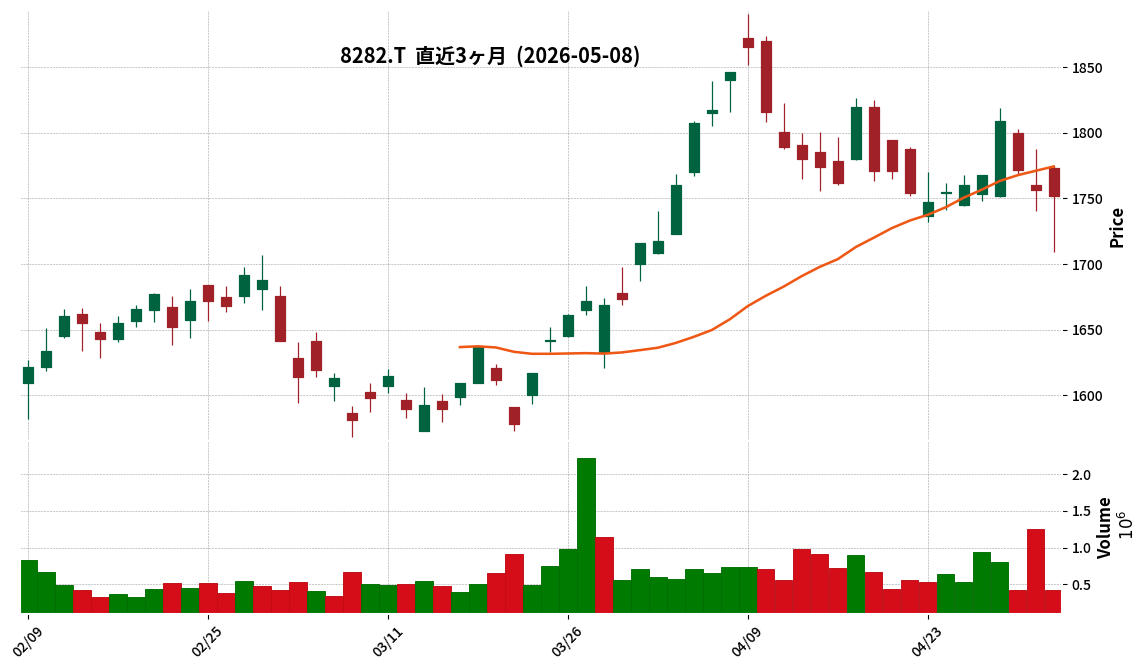
This article is an AI-generated summary and analysis of official IR disclosures.
📄 Announcement (AI-Reviewed)
- K’s Holdings announced on May 8, 2026, the progress update and partial revision (upward revision) of its “Mid-Term Management Plan 2027” as of the end of the second year.
- The company has revised upward its management targets for net sales and operating profit for the final fiscal year of the plan, March 2027, based on recent business performance.
- The revised targets for the fiscal year ending March 2027 are ¥785 billion for net sales and ¥30.5 billion for operating profit.
- Regarding the shareholder return policy, the minimum annual dividend per share during the Mid-Term Management Plan period has been revised from ¥46 to ¥48.
- For the fiscal year ended March 2026, K’s Holdings achieved consolidated net sales of ¥759.7 billion and operating profit of ¥26.8 billion.
🤖 AI Perspective
This upward revision may suggest the company’s strategic initiatives for efficiency and robust demand for home appliances are progressing well. The increase in both sales and operating profit targets, along with the higher dividend floor, could indicate K’s Holdings’ commitment to enhancing shareholder returns. These adjustments align with the company’s stated focus on management conscious of capital costs and stock prices, which investors may find noteworthy.
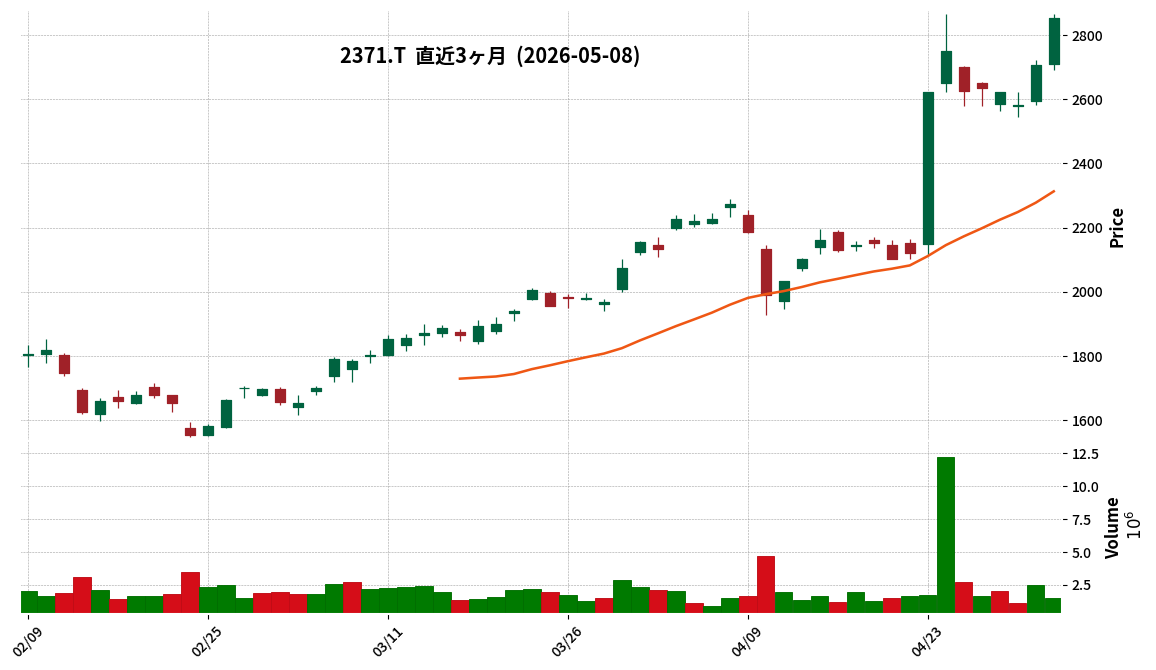
2371|カカクコム
2853.5
▲ +5.37%
This article is an AI-generated summary and analysis of official IR disclosures.
📄 Announcement (AI-Reviewed)
- Kakaku.com, Inc. (Code: 2371) announced its consolidated financial results for the fiscal year ended March 31, 2026, on May 8, 2026.
- For the fiscal year 2026/3, revenue reached JPY 94,127 million, marking a 20.0% increase from the previous year. This growth was primarily driven by the robust performance of the Tabelog, Incubation, and Kyujin Box businesses.
- Operating profit for the same period was JPY 27,243 million, a decrease of 7.0% year-on-year. This decline is attributed to increased growth investments, particularly in the Kyujin Box business, which led to higher expenses.
- Profit attributable to owners of the parent decreased by 6.1% to JPY 18,803 million, with basic earnings per share at JPY 95.05.
- The annual dividend for FY2026/3 was JPY 50.00. For FY2027/3, the company projects consolidated revenue of JPY 114,500 million (up 21.6% YoY) and operating profit of JPY 30,800 million (up 13.1% YoY).
🤖 AI Perspective
The significant increase in revenue suggests strong underlying business growth, while the decline in operating profit appears to be a result of strategic investments aimed at future expansion. The company’s forecast for renewed revenue and profit growth in the upcoming fiscal year could indicate confidence in these investments yielding returns. Investors may focus on the execution of these growth strategies and the realization of their benefits.
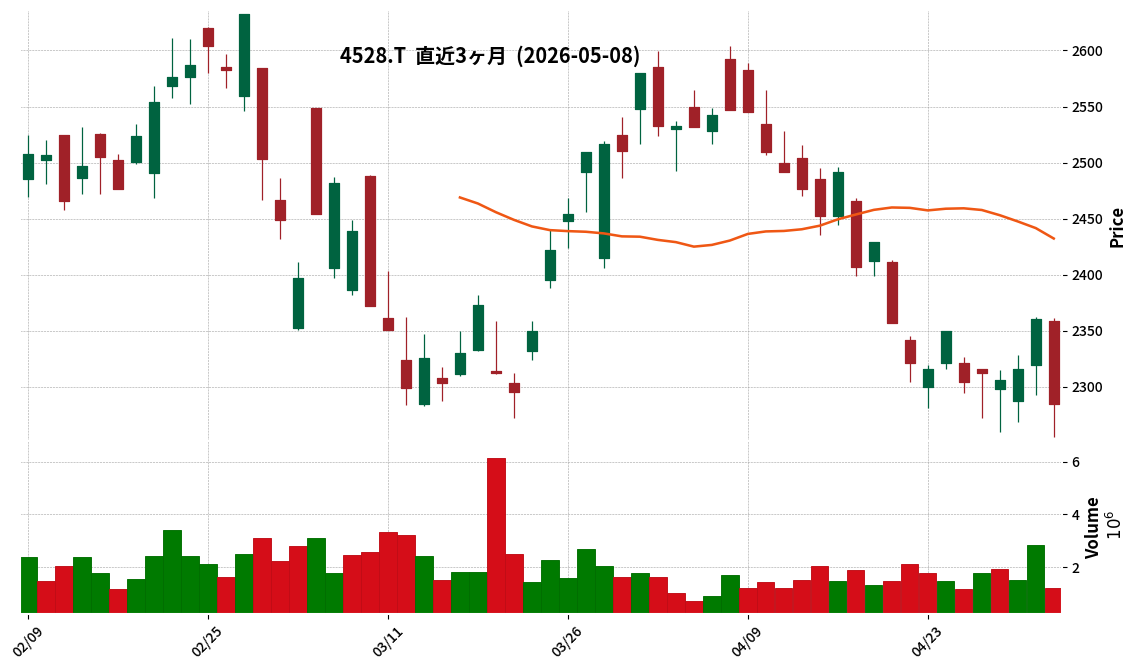
4528|小野薬
2284.5
▼ -3.22%
This article is an AI-generated summary and analysis of official IR disclosures.
📄 Announcement (AI-Reviewed)
- Ono Pharmaceutical Co., Ltd. announced its consolidated financial results (IFRS) for the fiscal year ended March 31, 2026.
- Consolidated revenue for FY2026/3 was ¥515,785 million, an increase of 5.9% from the previous fiscal year.
- Profit attributable to owners of the parent for FY2026/3 was ¥69,767 million, up 39.4% year-on-year.
- Core consolidated operating profit reached ¥137,135 million, representing a 21.7% increase compared to the prior year.
- While domestic product sales decreased by 3.5% to ¥281,400 million, overseas product sales surged by 56.5% to ¥61,200 million, and royalties and other income rose by 10.9% to ¥173,200 million.
- The consolidated earnings forecast for FY2027/3 projects revenue of ¥455,000 million (a decrease of 11.8% year-on-year) and profit attributable to owners of the parent of ¥71,000 million (an increase of 1.8% year-on-year).
🤖 AI Perspective
For FY2026/3, increased overseas product sales and royalty income appear to have offset a decline in domestic product sales, contributing to overall revenue and profit growth. The full-year contribution from Deciphera Pharmaceuticals products and higher royalty income from Bristol-Myers Squibb are noteworthy factors. The guidance for FY2027/3, forecasting a decrease in revenue but a slight increase in profit, might indicate a shift in the business portfolio or ongoing efforts in cost optimization and efficiency improvements.
5015|BPカストロール
1005.0
▲ +0.40%
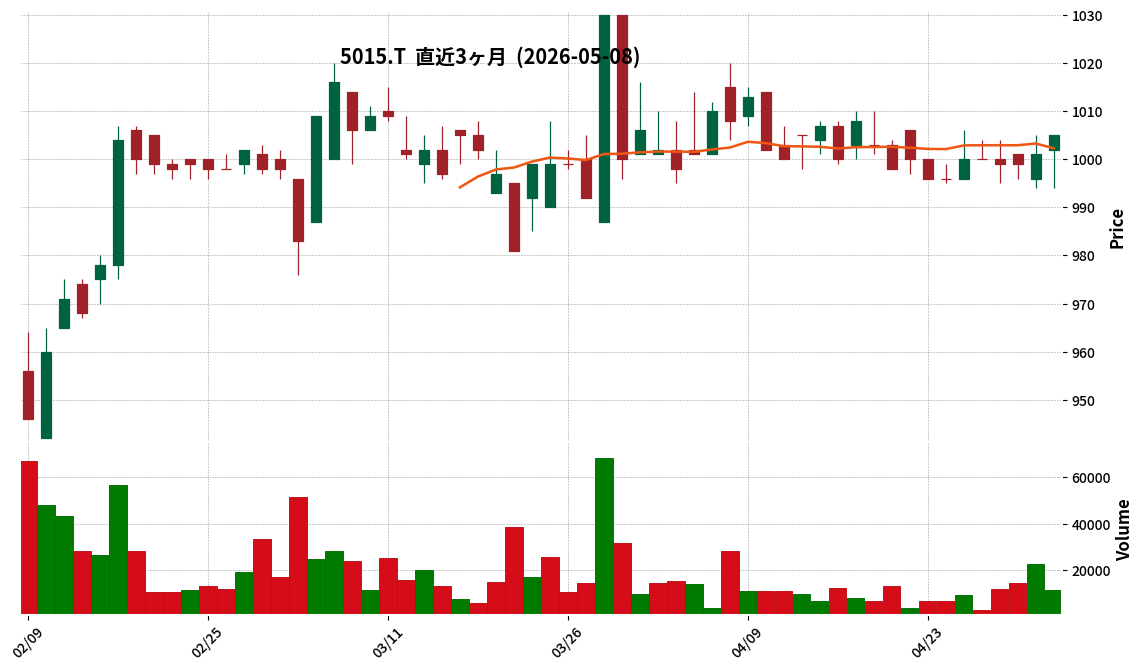
📎 Source:BPカストロール Official IR →
This article is an AI-generated summary and analysis of official IR disclosures.
📄 Announcement (AI-Reviewed)
- For the first quarter of fiscal year 2026 (January 1 to March 31, 2026), Net Sales amounted to ¥3,393 million, representing a 2.4% increase compared to the same period of the previous year.
- During the same quarter, Operating Profit was ¥464 million (+255.1% year-on-year), Ordinary Profit was ¥481 million (+189.8% year-on-year), and Quarterly Net Profit reached ¥325 million (+330.2% year-on-year), indicating significant profit growth across all categories.
- As of March 31, 2026, Total Assets stood at ¥12,858 million, Net Assets at ¥9,802 million, and the Equity Ratio was 76.2%.
- The full-year FY2026 earnings forecast and the annual dividend forecast of ¥50.00 per share remain unchanged from the most recent public announcement.
- Regarding the planned transfer of the Castrol business from the bp group to Stonepeak, announced on December 26, 2025, the company stated that any significant new developments will be promptly disclosed.
6758|ソニーグループ
3080.0
▼ -1.60%
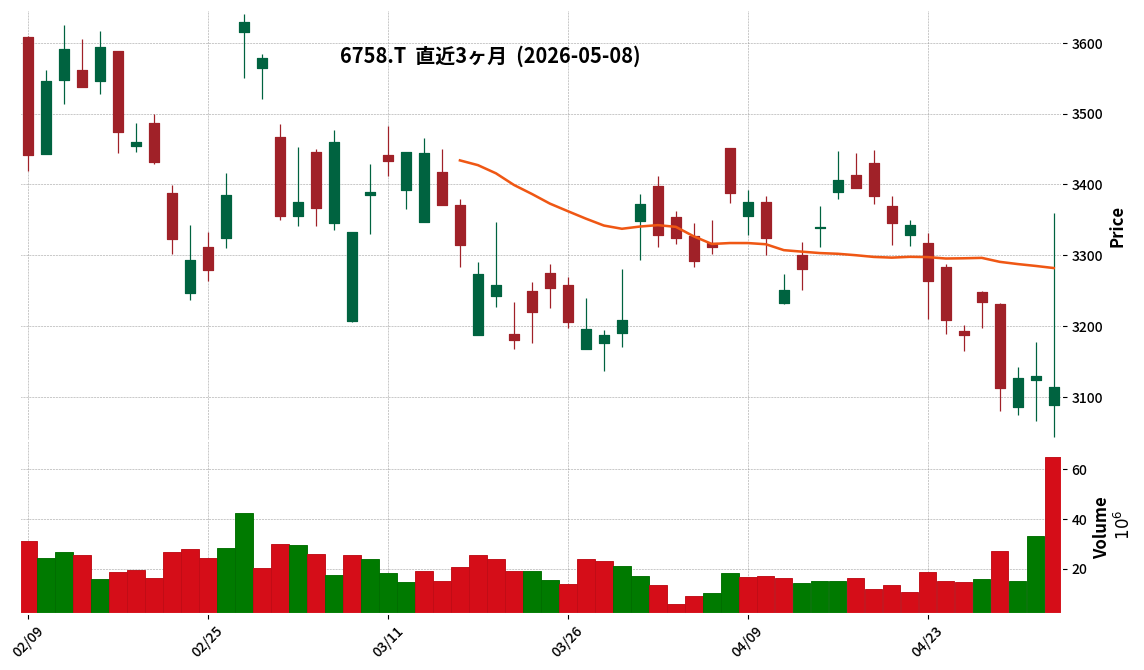
📎 Source:ソニーグループ Official IR →
This article is an AI-generated summary and analysis of official IR disclosures.
📄 Announcement (AI-Reviewed)
- For the fiscal year ended March 31, 2026, Sony Group’s continuing operations reported sales of JPY 12,479.62 billion (a 3.7% increase year-on-year) and operating income of JPY 1,447.51 billion (a 13.4% increase).
- Net income attributable to Sony Corporation’s stockholders from continuing operations decreased by 3.4% year-on-year to JPY 1,030.89 billion.
- The partial spin-off of Sony Financial Group Inc. was executed on October 1, 2025, leading to the reclassification of the financial business as discontinued operations. This resulted in a loss of JPY 1,377.80 billion from discontinued operations.
- For the fiscal year ending March 31, 2027, the consolidated forecast for continuing operations projects sales of JPY 12,300 billion (a 1.4% decrease), operating income of JPY 1,600 billion (a 10.5% increase), and net income attributable to Sony Corporation’s stockholders of JPY 1,160 billion (a 12.5% increase).
- The annual dividend for FY2026/3 was JPY 25.00 per share (JPY 12.50 year-end), with a forecast of JPY 35.00 per share (JPY 17.50 year-end) for FY2027/3.
🤖 AI Perspective
Sony Group’s FY2026/3 results indicate solid growth in sales and operating income for its continuing operations, despite the reported net income decrease reflecting the accounting treatment from the financial business spin-off. The forecast for FY2027/3 projects an increase in operating and net income, suggesting an expected rebound in core profitability. The planned increase in the annual dividend for the upcoming fiscal year may also be of interest to investors as an indicator of future shareholder returns.
8173|Joshin
2919.0
▼ -2.70%
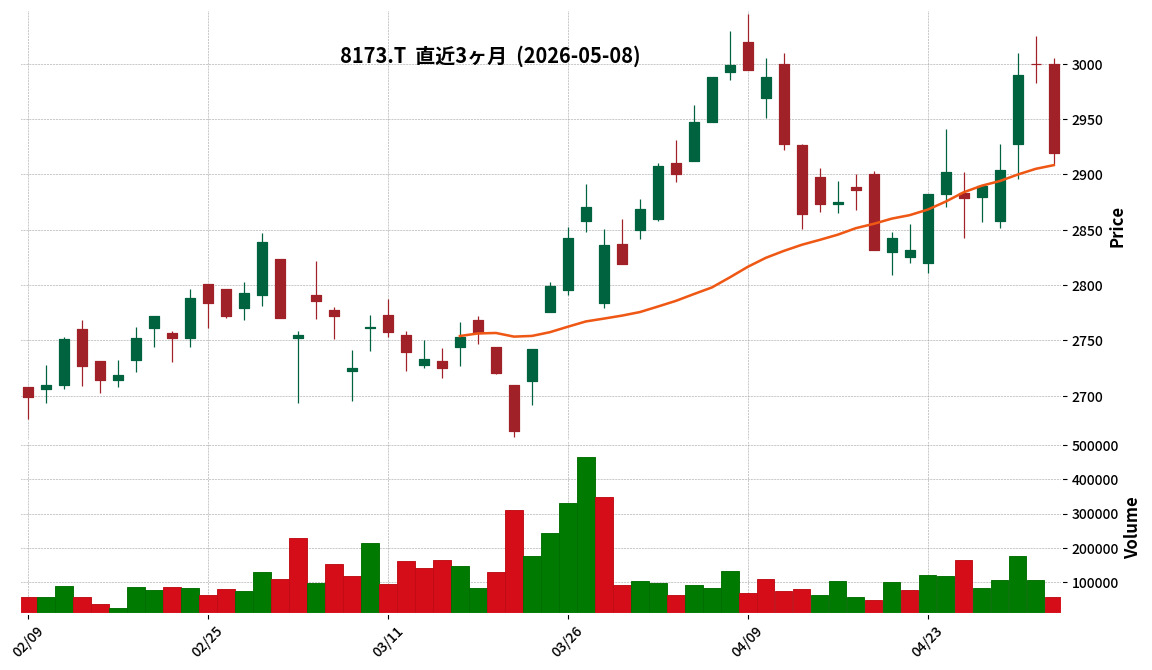
This article is an AI-generated summary and analysis of official IR disclosures.
📄 Announcement (AI-Reviewed)
- Joshin Co., Ltd. reported consolidated results for the fiscal year ended March 31, 2026, with net sales of 436,650 million yen (up 8.3% year-on-year), operating profit of 5,422 million yen (up 47.0%), and ordinary profit of 5,113 million yen (up 46.5%). Net profit attributable to owners of parent was 3,280 million yen (down 3.7% year-on-year).
- As of March 31, 2026, the consolidated financial position showed total assets of 228,813 million yen, net assets of 105,364 million yen, and an equity ratio of 46.0%.
- The annual dividend for FY2026 was 100.00 yen per share (including a year-end dividend of 50.00 yen), consistent with the previous fiscal year.
- For the fiscal year ending March 31, 2027, the company forecasts consolidated net sales of 438,000 million yen (up 0.3% year-on-year), operating profit of 6,000 million yen (up 10.7%), ordinary profit of 5,500 million yen (up 7.6%), and net profit attributable to owners of parent of 3,500 million yen (up 6.7%).
- The projected annual dividend for FY2027 is 100.00 yen per share (including a year-end dividend of 50.00 yen).
🤖 AI Perspective
The substantial increases in operating and ordinary profits for FY2026, alongside an 8.3% rise in net sales, may suggest improved operational performance during the period. While net profit attributable to owners of parent experienced a slight decline, the company’s forecast for FY2027 projects a recovery with expected growth in both revenue and profit, notably with over 10% growth anticipated in operating profit. This outlook could indicate the company’s confidence in its future business strategies and potential for continued improvement.
2193|COOKPAD
138.0
▼ -0.72%
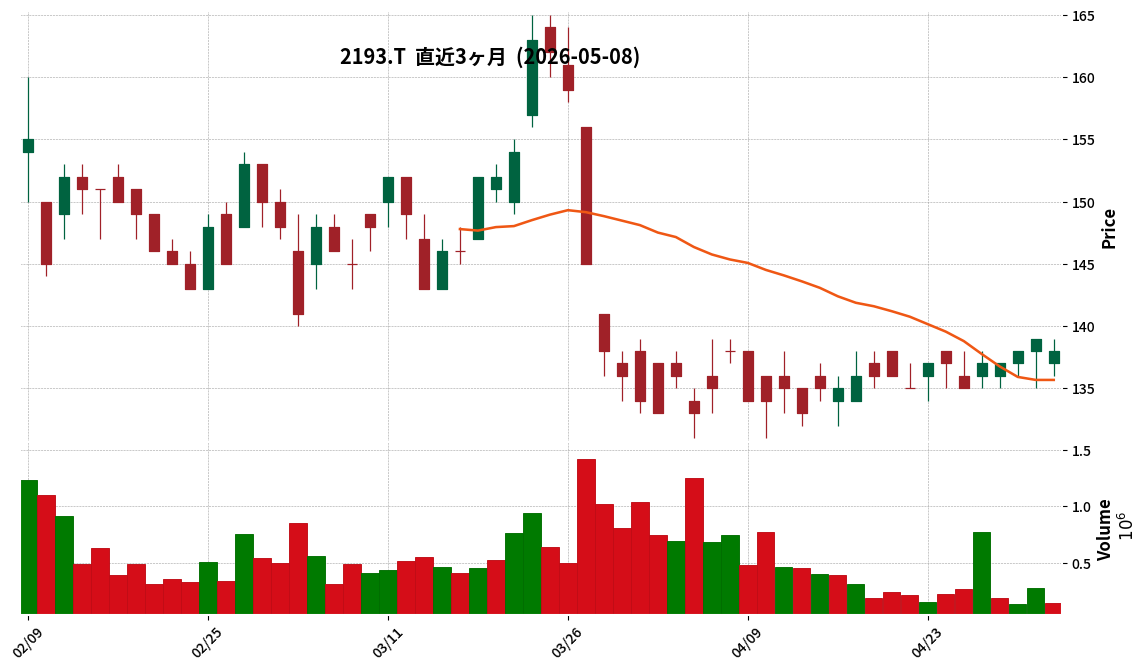
📎 Source:COOKPAD Official IR →
This article is an AI-generated summary and analysis of official IR disclosures.
📄 Announcement (AI-Reviewed)
- For the first quarter of the fiscal year ending December 2026 (January 1 to March 31, 2026), consolidated revenue decreased by 7.7% year-over-year to JPY 1,267 million.
- Operating income shifted from a profit of JPY 89 million in the prior year to a loss of JPY 137 million, primarily due to a one-time expense of JPY 182 million related to personnel restructuring at overseas locations.
- Quarterly profit attributable to owners of the parent turned from a profit of JPY 111 million in the prior year to a loss of JPY 417 million, influenced by fair value adjustments of marketable securities recorded as financial expenses due to market fluctuations, mainly in the U.S.
- As of March 31, 2026, consolidated total assets amounted to JPY 13,499 million (a decrease of JPY 603 million from the end of the previous fiscal year), and total equity was JPY 12,262 million (a decrease of JPY 635 million). The decline in equity was mainly attributed to the acquisition of treasury shares and the recording of quarterly losses attributable to owners of the parent.
- The consolidated earnings forecast for the fiscal year ending December 2026 is not disclosed, as it is deemed difficult to reasonably calculate due to the flexible nature of investment timing and scale based on changes in the business environment.
🤖 AI Perspective
The decline in revenue and the shift to an operating loss may suggest challenges stemming from a reduction in premium service subscribers, compounded by significant one-off costs for overseas personnel restructuring. Furthermore, financial expenses from fair value adjustments of marketable securities indicate external market factors also contributed to the quarter’s performance. With no full-year earnings forecast provided, the company’s future investment strategies and operational efficiency initiatives could be worth monitoring.
4792|山田コンサル
1689.0
▲ +3.18%
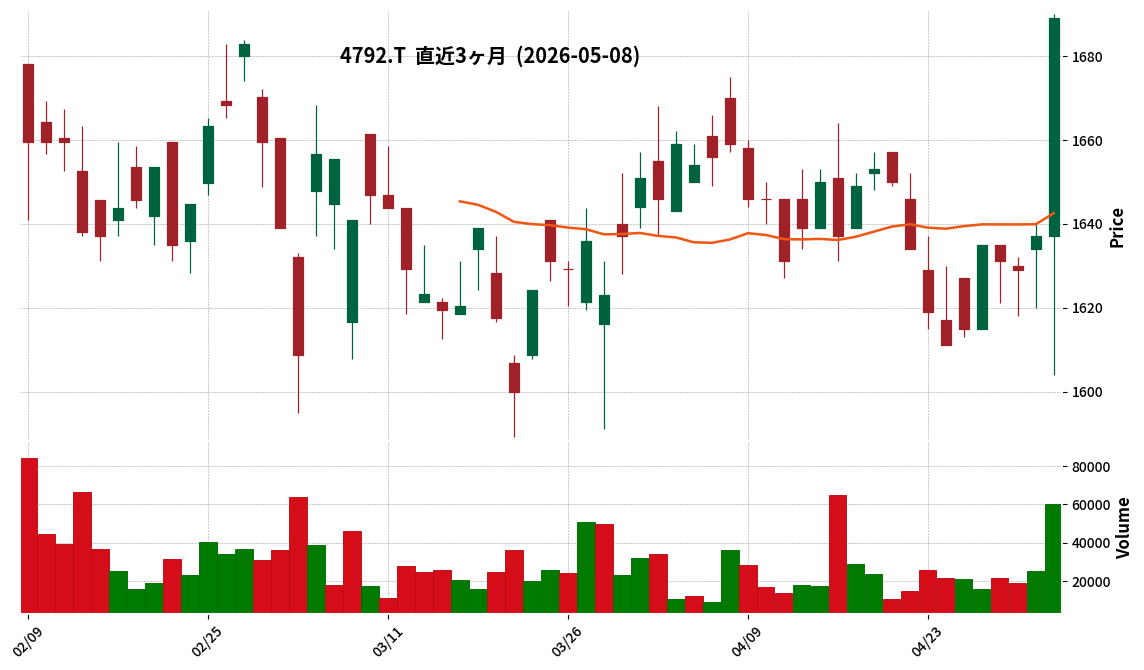
This article is an AI-generated summary and analysis of official IR disclosures.
📄 Announcement (AI-Reviewed)
- Yamada Consulting Group Co., Ltd. reported consolidated net sales of JPY 26,711 million for the fiscal year ended March 2026, a 17.3% increase year-on-year.
- Operating profit was JPY 3,740 million (down 9.4% year-on-year), and ordinary profit was JPY 3,712 million (down 9.4% year-on-year). Net profit attributable to owners of parent increased by 0.4% to JPY 2,895 million.
- The annual dividend for FY2026/3 was JPY 77 (interim JPY 38, year-end JPY 39), maintained from the previous fiscal year. The forecast for FY22027/3 annual dividend is also JPY 77.
- For FY2027/3, the company forecasts consolidated net sales of JPY 26,900 million (up 0.7% year-on-year), operating profit of JPY 4,500 million (up 20.2% year-on-year), and net profit attributable to owners of parent of JPY 2,900 million (up 0.1% year-on-year).
- During the consolidated fiscal year, the scope of consolidation significantly changed with the addition of two new companies: Manas Corporate Partners Co., Ltd. and Daikoku Building Co., Ltd.
🤖 AI Perspective
The FY2026/3 consolidated results show a notable increase in net sales but a decrease in operating and ordinary profits, while net profit attributable to owners of parent saw a slight increase. This divergence in profit metrics may warrant further examination by investors to understand the underlying factors. For FY2027/3, the company projects a modest increase in net sales but a significant recovery in operating and ordinary profits, which could suggest an anticipated improvement in profitability.
5941|中西製作所
2578.0
▲ +2.14%
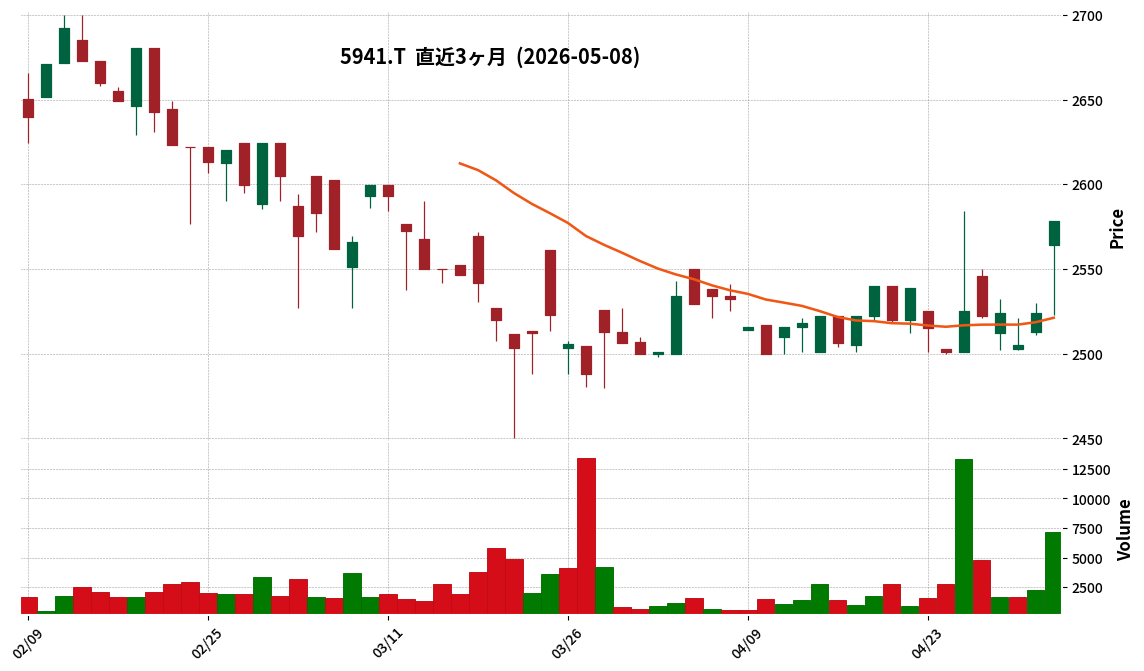
This article is an AI-generated summary and analysis of official IR disclosures.
📄 Announcement (AI-Reviewed)
- Nakanishi Co., Ltd. reported record-high net sales of ¥41,008 million for the fiscal year ended March 31, 2026, marking a 2.7% increase year-on-year.
- Operating profit grew by 15.9% to ¥3,049 million, ordinary profit by 13.6% to ¥3,169 million, and net profit increased by 22.3% to ¥2,210 million.
- The annual dividend per share for FY2026/3 was raised to ¥110.00, up from ¥87.00 in the previous fiscal year.
- For FY2027/3, the company forecasts net sales of ¥41,200 million (+0.5% YoY), but anticipates a decrease in profits with operating profit at ¥2,400 million (-21.3% YoY) and net profit at ¥2,000 million (-9.5% YoY).
- As of March 31, 2026, total assets stood at ¥33,899 million, and net assets were ¥22,475 million, with an equity ratio of 66.3%.
🤖 AI Perspective
The robust performance in FY2026/3, marked by record sales and significant profit growth, along with an increased dividend, suggests a period of strong operational execution. However, the projected decline in profits for FY2027/3 indicates potential headwinds or strategic adjustments that could impact the upcoming fiscal year. The high equity ratio may suggest a stable financial foundation, providing resilience against future market fluctuations.
3663|セルシス
1585.0
▲ +9.69%
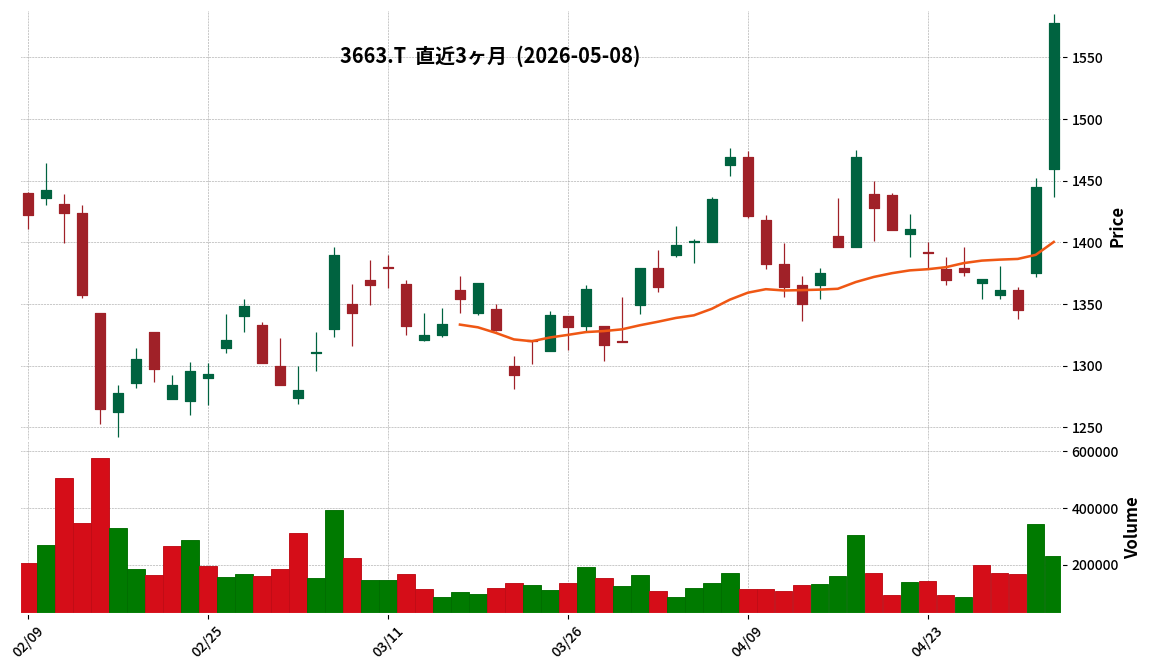
This article is an AI-generated summary and analysis of official IR disclosures.
📄 Announcement (AI-Reviewed)
- CELSYS, Inc. announced its unaudited financial results for the first quarter of the fiscal year ending December 2026 (January 1, 2026 – March 31, 2026).
- During this quarter, net sales reached JPY 2,803 million (up 16.7% year-on-year), operating income JPY 1,211 million (up 59.6% year-on-year), ordinary income JPY 1,213 million (up 61.7% year-on-year), and quarterly net income JPY 813 million (up 18.9% year-on-year), achieving record highs for key revenue indicators.
- “CLIP STUDIO PAINT,” the core product, reached 63.17 million cumulative units shipped by March 2026 and 64.30 million by April 2026. Its subscription ARR (Annual Recurring Revenue) hit JPY 5.8 billion by March 2026 (up 25.9% year-on-year), a new record.
- The company forecasts an annual dividend of JPY 38 for the fiscal year ending December 2026, consisting of an interim dividend of JPY 18 and a year-end dividend of JPY 20, which represents a JPY 2 increase from the previous year.
- CELSYS executed a cancellation of 1.5 million shares of treasury stock on March 16, 2026.
🤖 AI Perspective
CELSYS’s first-quarter results show significant increases in both sales and profit, with key revenue indicators reaching new record highs, which may suggest robust business momentum. The continued growth of “CLIP STUDIO PAINT” and the expansion of its subscription revenue appear to be driving this performance. Additionally, the treasury stock cancellation and increased dividend forecast could indicate a focus on enhancing capital efficiency and shareholder returns.
3766|システムズD
1300.0
▲ +4.17%
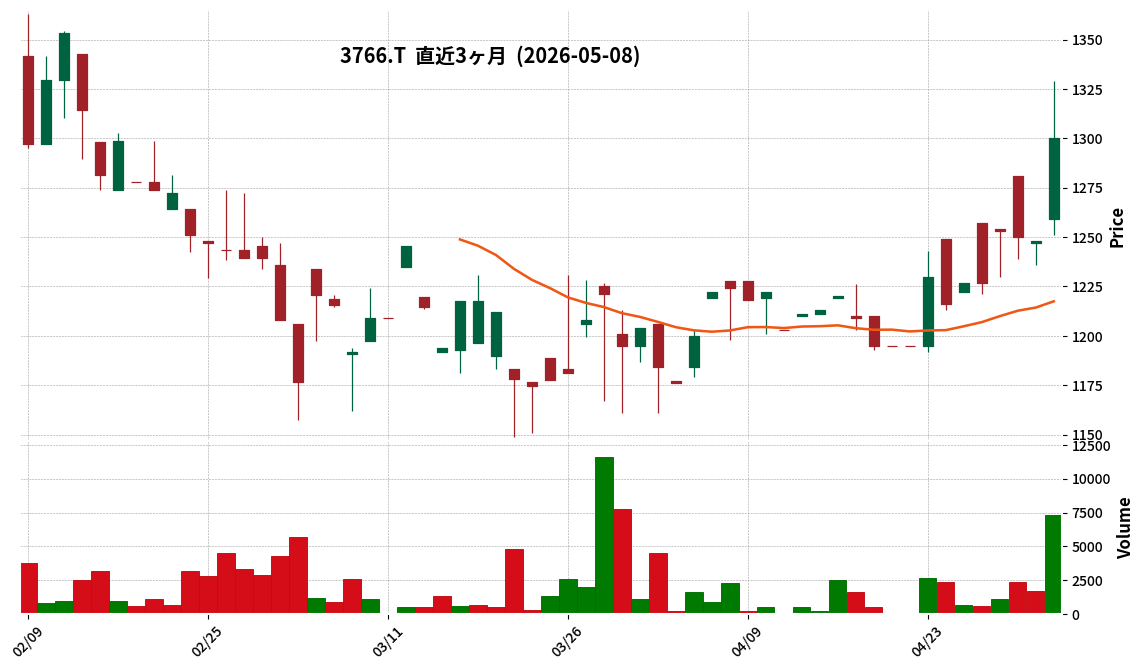
This article is an AI-generated summary and analysis of official IR disclosures.
📄 Announcement (AI-Reviewed)
- Systems Design Co., Ltd. (Code: 3766) has announced its consolidated financial results for the fiscal year ended March 31, 2026.
- For FY2026, consolidated net sales were ¥9,993 million (up 4.0% year-on-year), operating profit was ¥595 million (up 31.1%), ordinary profit was ¥604 million (up 26.6%), and profit attributable to owners of parent was ¥393 million (up 32.1%).
- Basic earnings per share for FY2026 were ¥115.00.
- The year-end dividend for FY2026 was set at ¥55.00, resulting in an annual dividend of ¥55.00 (compared to ¥45.00 for the previous year).
- For FY2027, the company forecasts consolidated net sales of ¥10,418 million (up 4.2% year-on-year), operating profit of ¥631 million (up 5.9%), profit attributable to owners of parent of ¥415 million (up 5.7%), and an annual dividend of ¥60.00.
🤖 AI Perspective
The substantial increase in operating profit, outpacing sales growth, and the significant rise in cash flow from operating activities, may suggest improvements in the company’s operational efficiency and profitability. The forward-looking guidance for continued revenue and profit growth, coupled with an increased dividend projection, could indicate management’s positive outlook on future performance and commitment to shareholder returns.
4025|多木化学
5000.0
▲ +8.58%
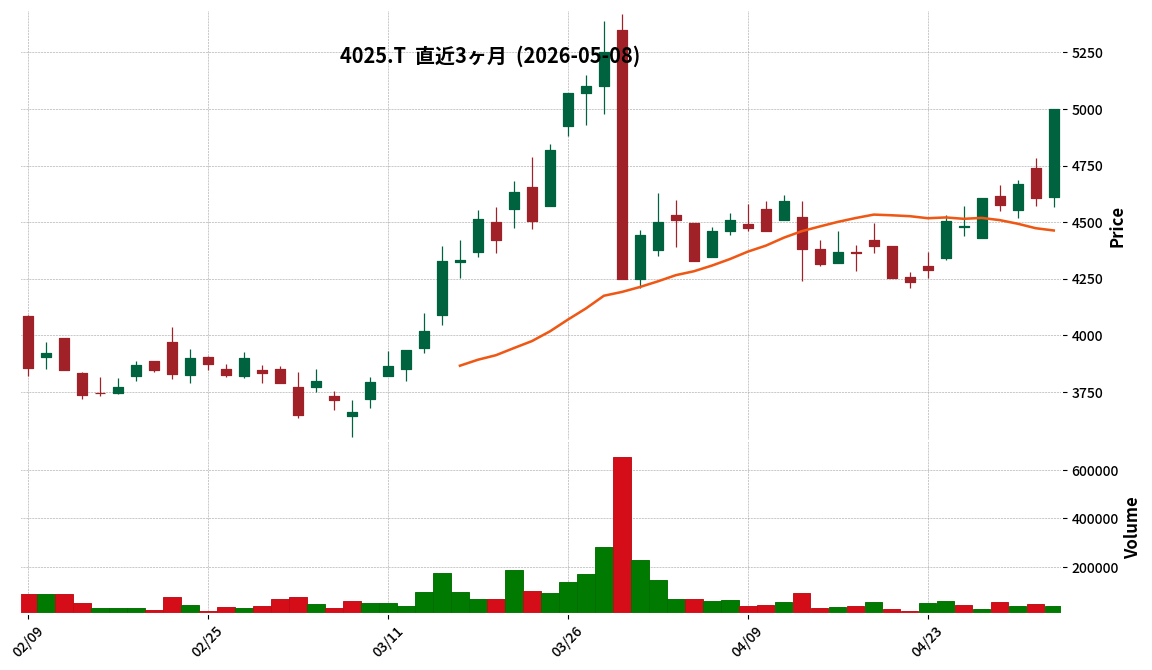
This article is an AI-generated summary and analysis of official IR disclosures.
📄 Announcement (AI-Reviewed)
- Takii Chemical announced its consolidated results for the first quarter of fiscal year 2026. Net sales were ¥10,776 million (up 9.2% year-on-year), operating profit was ¥946 million (up 37.1% YoY), ordinary profit was ¥983 million (up 27.4% YoY), and net profit attributable to owners of parent was ¥695 million (up 25.0% YoY).
- Revenue and profit growth were achieved across the Agri, Chemicals, Construction Materials, and Transportation segments. Notably, the Chemicals segment saw a 12.6% increase in net sales and a 51.5% rise in operating profit compared to the prior year.
- As of March 31, 2026, total assets amounted to ¥68,412 million, net assets were ¥45,386 million, and the equity ratio stood at 65.7%.
- The consolidated earnings forecast for the full fiscal year 2026 and the annual dividend forecast (¥80.00 per share for year-end) remain unchanged from the announcement made on February 9, 2026.
🤖 AI Perspective
The significant increases in sales and all profit categories during the first quarter, driven by efforts to improve the profitability of existing businesses, may suggest a strong start to the fiscal year. As the full-year earnings forecast remains unchanged, the impact of future business environment changes and the progress of various initiatives on performance will likely continue to be monitored. The high equity ratio could indicate a stable financial foundation for the company.
5729|日精鉱
2209.0
▲ +0.32%
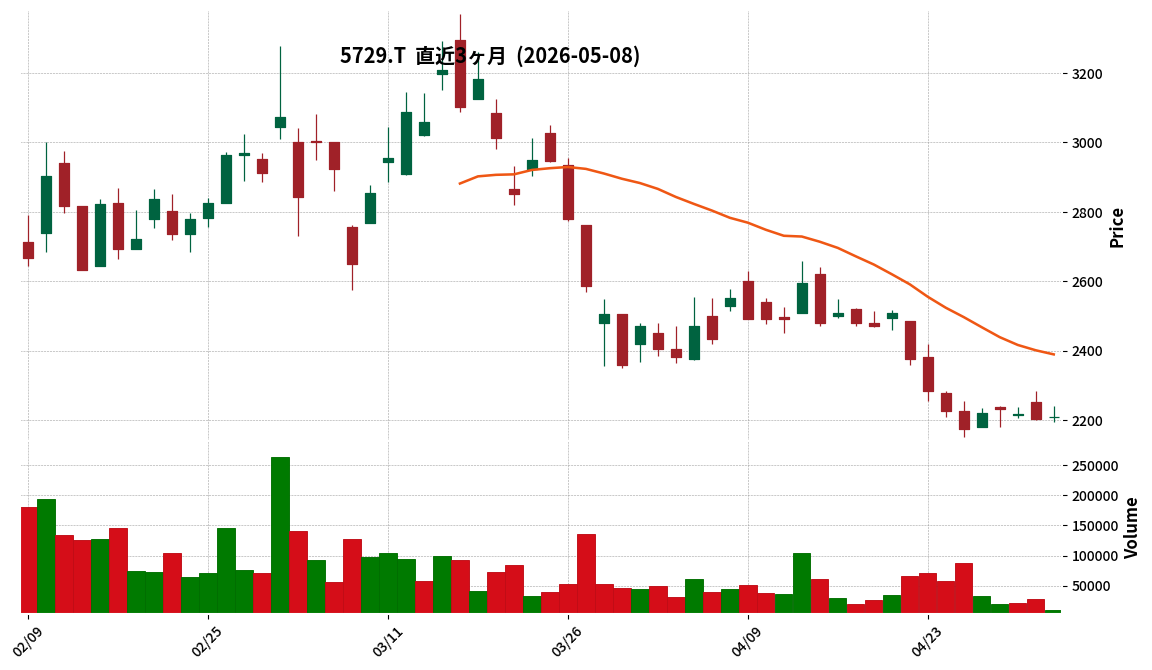
This article is an AI-generated summary and analysis of official IR disclosures.
📄 Announcement (AI-Reviewed)
- Nippon Seiko K.K. disclosed on May 8, 2026, the financial results for the fiscal year ended January 2026 of Kawashima Co., Ltd., an unlisted “other related company.” Kawashima’s primary business is non-ferrous metal wholesaling, and Nippon Seiko holds a 26.52% voting rights stake (including 16.58% indirect ownership) as of March 31, 2026.
- For the fiscal year ended January 31, 2026 (from February 1, 2025, to January 31, 2026), Kawashima Co., Ltd. reported net sales of ¥21,209 million, operating income of ¥751 million, and net income of ¥439 million in its statement of income.
- As of January 31, 2026, Kawashima’s balance sheet showed total assets of ¥18,598 million, total liabilities of ¥12,012 million, and total net assets of ¥6,586 million.
- The Nippon Seiko Group engages in raw material procurement transactions with Kawashima Co., Ltd.
🤖 AI Perspective
The disclosure of financial information for an unlisted related company is intended to enhance transparency regarding related party transactions and to allow investors to understand the indirect impact on Nippon Seiko’s management. As Kawashima Co., Ltd. is a raw material supplier for the Nippon Seiko Group, its financial performance and business results could be a key factor in analyzing Nippon Seiko’s operational activities. It may also be worth monitoring how Kawashima’s performance as a non-ferrous metal wholesaler correlates with international market trends.
6023|ダイハツインフィ
3300.0
▲ +8.55%
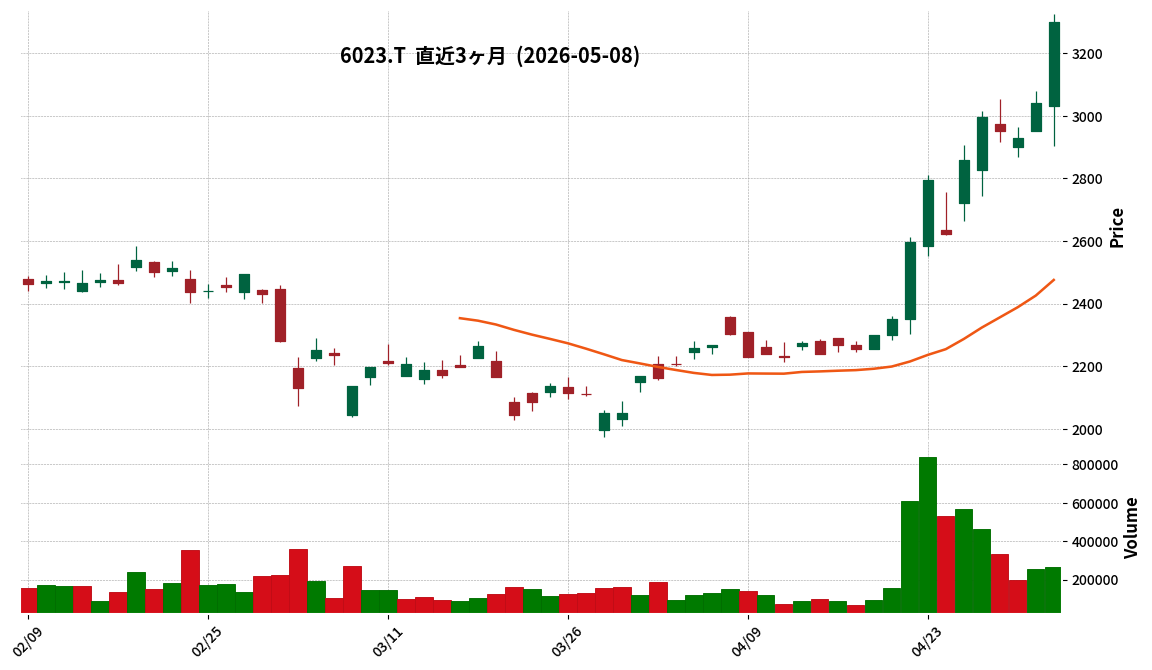
📎 Source:ダイハツインフィ Official IR →
This article is an AI-generated summary and analysis of official IR disclosures.
📄 Announcement (AI-Reviewed)
- Daihatsu Infi Earth Corporation announced its consolidated financial results for the fiscal year ended March 31, 2026 (April 1, 2025 – March 31, 2026).
- For the period, consolidated net sales were ¥88,066 million, representing a 0.8% decrease from the previous fiscal year, and operating profit was ¥7,621 million, a 0.2% decrease.
- In contrast, ordinary profit increased by 4.7% to ¥7,959 million, and profit attributable to owners of parent increased by 3.6% to ¥5,920 million.
- The annual dividend for the fiscal year ended March 31, 2026, was set at ¥69.00 per share, an increase from ¥62.00 in the prior fiscal year.
- For the fiscal year ending March 31, 2027, the company forecasts consolidated net sales of ¥104,000 million (up 18.1%), operating profit of ¥8,000 million (up 5.0%), ordinary profit of ¥8,000 million (up 0.5%), and profit attributable to owners of parent of ¥5,700 million (down 3.7%).
🤖 AI Perspective
Daihatsu Infi’s FY2026/3 results show a slight decline in net sales and operating profit, yet a rise in ordinary and net profits. This mixed performance may suggest that while average selling prices were affected by a shift towards smaller engines, internal cost control or other operational efficiencies could have supported profitability. Looking ahead to FY2027/3, the company projects increased sales and operating profit, but a decrease in net profit, indicating that navigating market dynamics will be a key area for observation.
7013|IHI
3283.0
▲ +7.82%
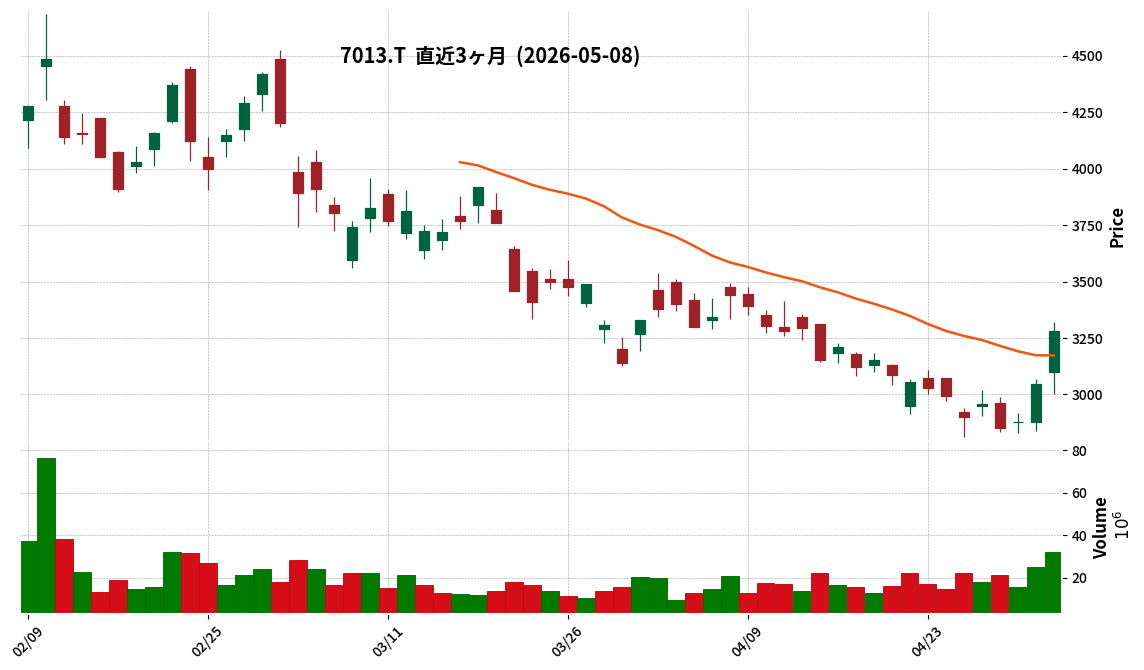
This article is an AI-generated summary and analysis of official IR disclosures.
📄 Announcement (AI-Reviewed)
- For the fiscal year ended March 31, 2026 (FY2026), IHI reported consolidated revenue of JPY 1,643,402 million, an increase of 1.0% year-on-year.
- Profit attributable to owners of parent for FY2026 stood at JPY 160,992 million, marking a significant increase of 42.8% compared to the previous fiscal year.
- Basic earnings per share for FY2026 was JPY 151.88 (after stock split adjustment).
- IHI projects consolidated revenue for FY2027 (ending March 31, 2027) to be JPY 1,830,000 million (an 11.4% increase year-on-year), and operating profit to be JPY 240,000 million (a 45.0% increase year-on-year).
- The annual dividend per share for FY2026 was JPY 80.00 (JPY 10.00 year-end, JPY 70.00 interim, adjusted for stock split), with a forecast of JPY 23.00 for FY2027.
🤖 AI Perspective
The substantial increase in profit attributable to owners of parent for FY2026, alongside a moderate revenue growth, may indicate improved operational efficiency and profitability. The robust projections for FY2027, particularly the 45.0% increase in operating profit, could suggest management’s confidence in the company’s strategic initiatives and future earnings potential. These results and forecasts might be viewed by investors as a positive sign regarding IHI’s trajectory.
8084|RYODEN
3685.0
▲ +1.66%
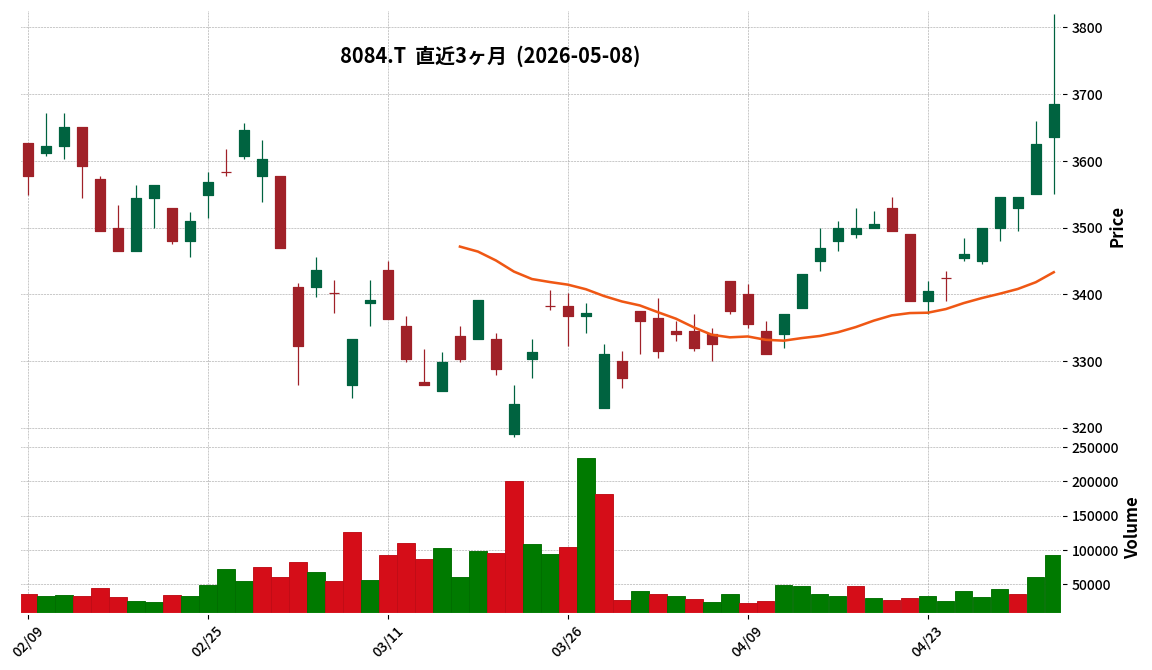
This article is an AI-generated summary and analysis of official IR disclosures.
📄 Announcement (AI-Reviewed)
- RYODEN Corporation announced on May 8, 2026, a revision to its dividend forecast for the fiscal year ending March 2026.
- The annual dividend per share has been revised to JPY 138, up from the previously projected JPY 136 (announced on May 9, 2025).
- The year-end dividend has been revised from JPY 68 to JPY 70 (the second quarter-end dividend remains unchanged at JPY 68).
- The revision is attributed to the company’s commitment to enhancing shareholder returns, based on its dividend policy revised on May 9, 2025.
- This dividend policy sets a lower limit of either a consolidated total return ratio of 50% or a consolidated Dividend on Equity (DOE) of 3.5%.
- Separately, an announcement regarding a change in dividend policy (introduction of progressive dividends) to be applied from the fiscal year ending March 2027 has also been made today.
🤖 AI Perspective
This revised dividend forecast represents a tangible increase under the company’s updated shareholder return policy, which was initially changed on May 9, 2025, suggesting a commitment to strengthening medium-to-long-term shareholder returns. The company’s stance on stable shareholder returns, independent of short-term performance, with a floor of a consolidated total return ratio of 50% or a consolidated DOE of 3.5%, has been reaffirmed. Investors may also observe how this aligns with the separately announced progressive dividend policy set to begin from the fiscal year ending March 2027.
9362|兵機海運
3850.0
▲ +0.00%
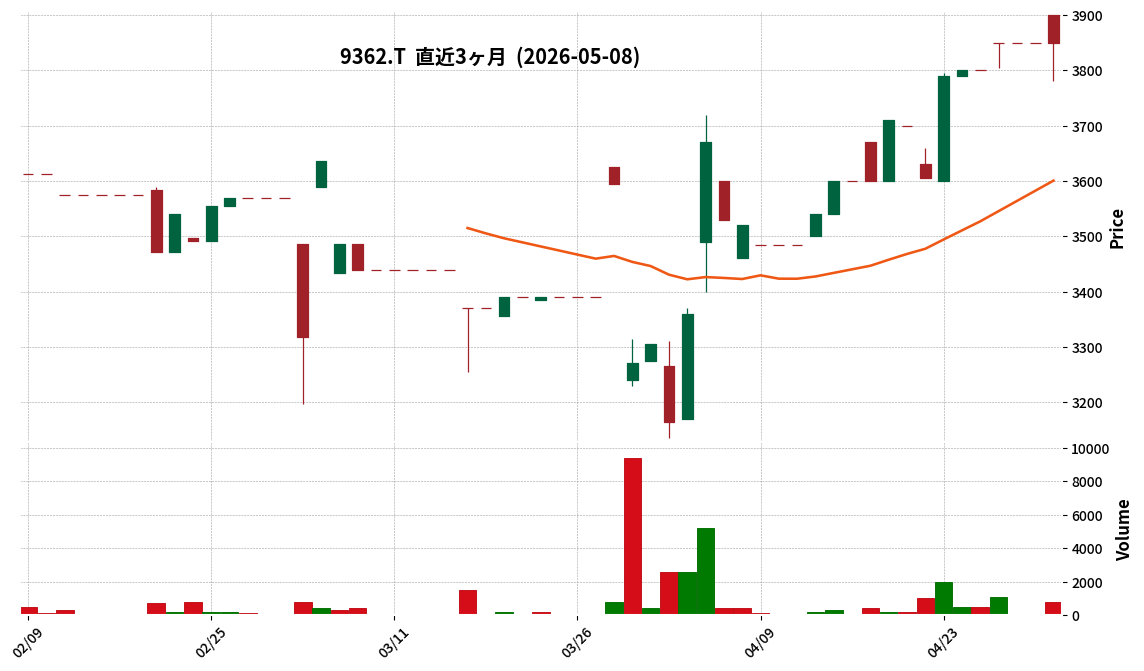
This article is an AI-generated summary and analysis of official IR disclosures.
📄 Announcement (AI-Reviewed)
- Hyoki Kaiun reported consolidated results for the fiscal year ended March 31, 2026, with net sales of ¥13,389 million, operating profit of ¥436 million, ordinary profit of ¥499 million, and net profit of ¥397 million, representing a decrease in both revenue and profit compared to the previous fiscal year.
- Compared to the full-year forecast announced on October 30, 2025, operating profit achieved 106.5%, ordinary profit 106.3%, and net profit 110.3%, exceeding the revised plan.
- By segment, port transportation sales increased to ¥4,085 million (+109.9% year-on-year) and warehousing sales to ¥1,704 million (+102.4% year-on-year), while domestic and international shipping segments experienced revenue declines.
- The self-capital ratio at the end of March 2026 increased to 43.3% from 38.7% in the previous fiscal year, a rise of 4.6 percentage points.
- For the fiscal year ending March 31, 2027, the company forecasts net sales of ¥14,500 million, operating profit of ¥510 million, ordinary profit of ¥540 million, and net profit of ¥400 million.
🤖 AI Perspective
While Hyoki Kaiun reported a decrease in revenue and profit for FY2026 due to challenges in the shipping business, the results surpassed revised forecasts, driven by growth in port transportation and warehousing. The improvement in the self-capital ratio to 43.3% may suggest a strengthening of the company’s financial position. The projected increase in revenue and profit for FY2027, under the mid-term management plan, could indicate an anticipated recovery and potential benefits from strategic initiatives.
9432|NTT
150.6
▼ -0.13%
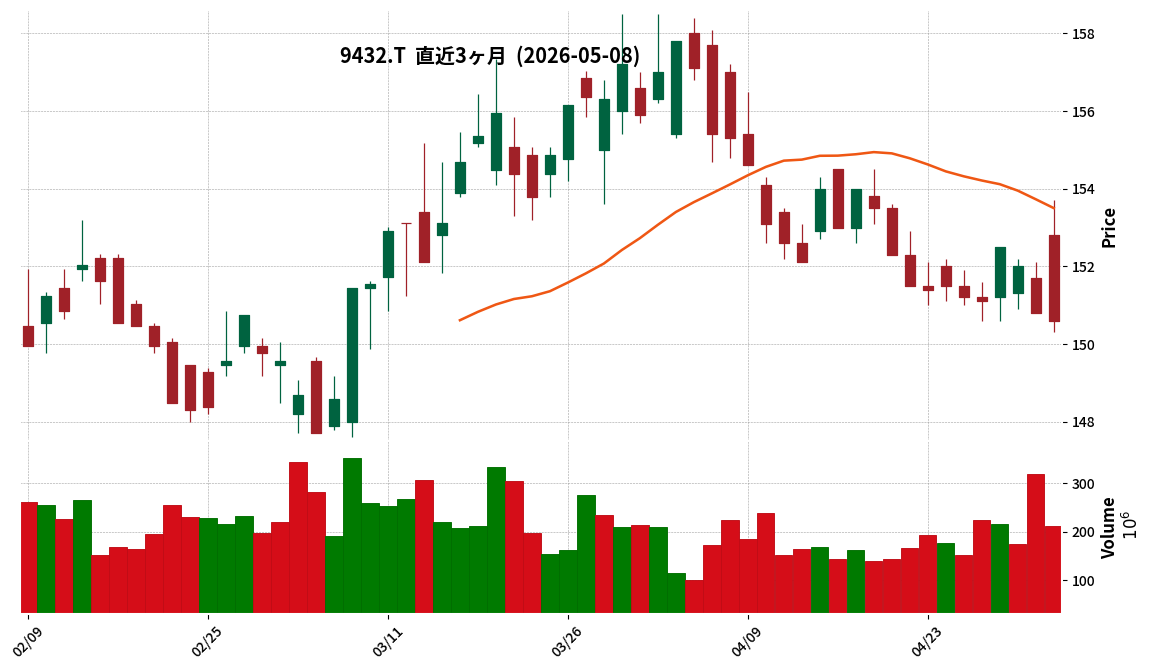
This article is an AI-generated summary and analysis of official IR disclosures.
📄 Announcement (AI-Reviewed)
- NTT announced its consolidated financial results for fiscal year 2025 (April 1, 2025, to March 31, 2026), with operating revenue reaching ¥14,409.1 billion, a 5.1% increase year-on-year.
- Profit attributable to owners of the parent company amounted to ¥1,037.0 billion, representing a 3.7% increase from the previous fiscal year.
- The annual dividend for FY2025 was set at ¥5.30 per share (interim ¥2.65, year-end ¥2.65), an increase from the prior fiscal year.
- For FY2026, NTT forecasts consolidated operating revenue of ¥15,060.0 billion, projecting a 4.5% increase year-on-year.
- Conversely, profit attributable to owners for FY2026 is projected to decrease by 5.5% to ¥980.0 billion.
🤖 AI Perspective
NTT’s FY2025 results show solid growth in revenue and profit, accompanied by an increased annual dividend, which may be viewed positively by investors. However, the FY2026 forecast indicates a projected decrease in profit attributable to owners despite continued revenue growth. This divergence could suggest a focus on strategic investments or potential cost increases, which market participants may monitor for underlying causes and future implications.
9902|日伝
2486.0
▲ +2.26%
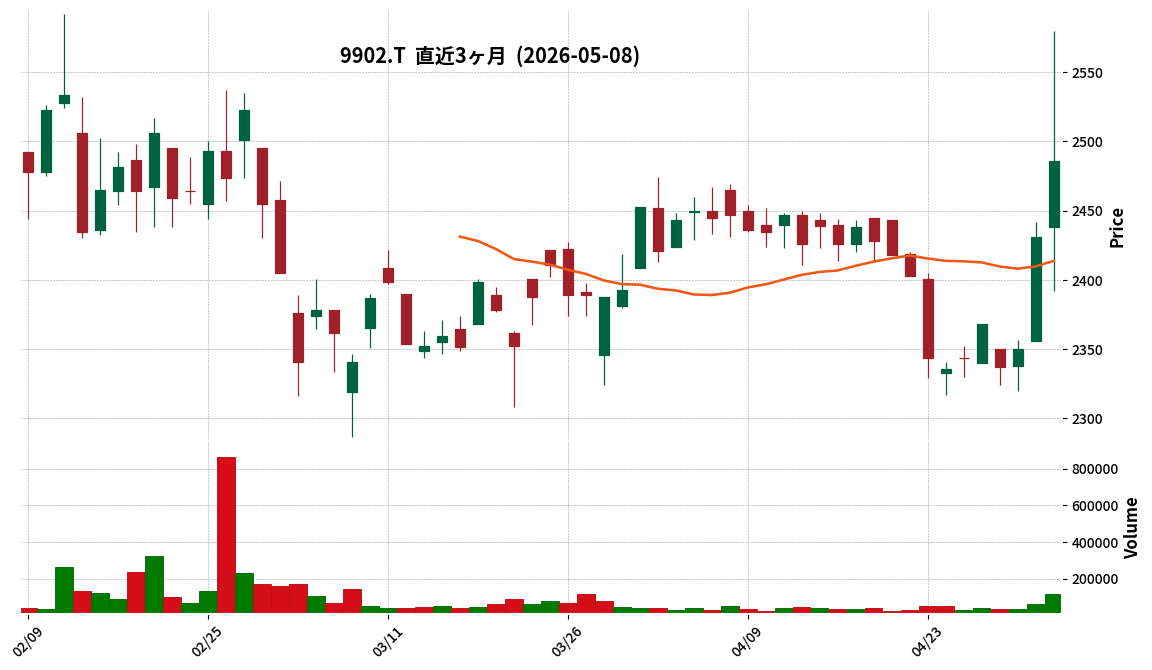
This article is an AI-generated summary and analysis of official IR disclosures.
📄 Announcement (AI-Reviewed)
- For the consolidated fiscal year ended March 31, 2026, Nichiden reported net sales of JPY 141,033 million, a 4.6% increase compared to the previous fiscal year.
- Operating profit for the period decreased by 3.0% to JPY 6,622 million, while ordinary profit rose by 3.7% to JPY 7,465 million, and net profit attributable to owners of parent increased by 4.5% to JPY 5,114 million.
- The annual dividend for the fiscal year ended March 31, 2026, was announced as JPY 70.00 per share (JPY 35.00 interim, JPY 35.00 year-end).
- The consolidated earnings forecast for the fiscal year ending March 31, 2027, projects net sales of JPY 150,000 million (up 6.4% year-on-year), operating profit of JPY 7,300 million (up 10.2%), and net profit attributable to owners of parent of JPY 5,500 million (up 7.5%).
- The forecasted annual dividend for the fiscal year ending March 31, 2027, is JPY 100.00 per share (JPY 50.00 interim, JPY 50.00 year-end).
🤖 AI Perspective
While Nichiden achieved increased sales, ordinary profit, and net profit for FY2026, the decline in operating profit may prompt further examination of profit margin dynamics. The company’s forecast for FY2027 indicates anticipated growth across sales, all profit categories, and an increase in the annual dividend, suggesting a positive outlook for the upcoming fiscal year.
4556|カイノス
2273.0
▲ +0.00%
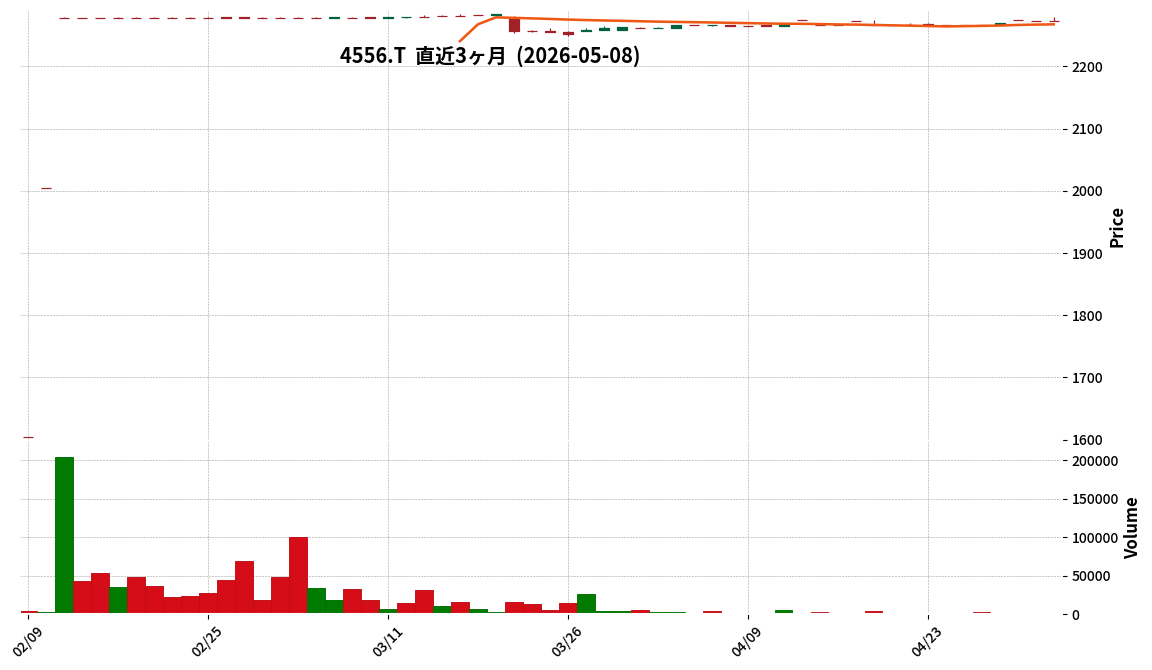
This article is an AI-generated summary and analysis of official IR disclosures.
📄 Announcement (AI-Reviewed)
- Kainos Co., Ltd. reported net sales of ¥5,479 million for the fiscal year ended March 31, 2026 (non-consolidated), marking a 3.3% increase compared to the previous year.
- Operating profit for the period was ¥747 million (down 9.2% year-on-year), ordinary profit was ¥788 million (down 4.8% year-on-year), and net profit was ¥449 million (down 29.9% year-on-year). The decline in net profit was attributed to the recording of tender offer related expenses.
- The annual dividend for the fiscal year ended March 31, 2026, was ¥0. For reference, the annual dividend for the prior fiscal year (ended March 31, 2025) was ¥35.00 per share (¥32.00 ordinary dividend, ¥3.00 commemorative dividend for the 50th anniversary).
- No earnings forecast or dividend forecast has been provided for the fiscal year ending March 31, 2027. This is due to the planned delisting of the company’s shares following a tender offer by Flowers Co., Ltd., as announced in a press release dated February 6, 2026.
- Cash and cash equivalents at the end of the period totaled ¥3.40 billion, an increase of ¥344 million from the end of the previous fiscal year.
🤖 AI Perspective
Kainos’s fiscal year 2026 results show a unique situation with increased revenue but decreased profits, particularly net profit, which was impacted by expenses related to the tender offer. The absence of an earnings or dividend forecast for the upcoming fiscal year, attributed to the planned delisting, indicates a significant transition for the company’s corporate structure and future trajectory. Investors may find it important to consider the implications of this upcoming change in ownership and listing status.
5464|モリ工業
928.0
▼ -1.90%
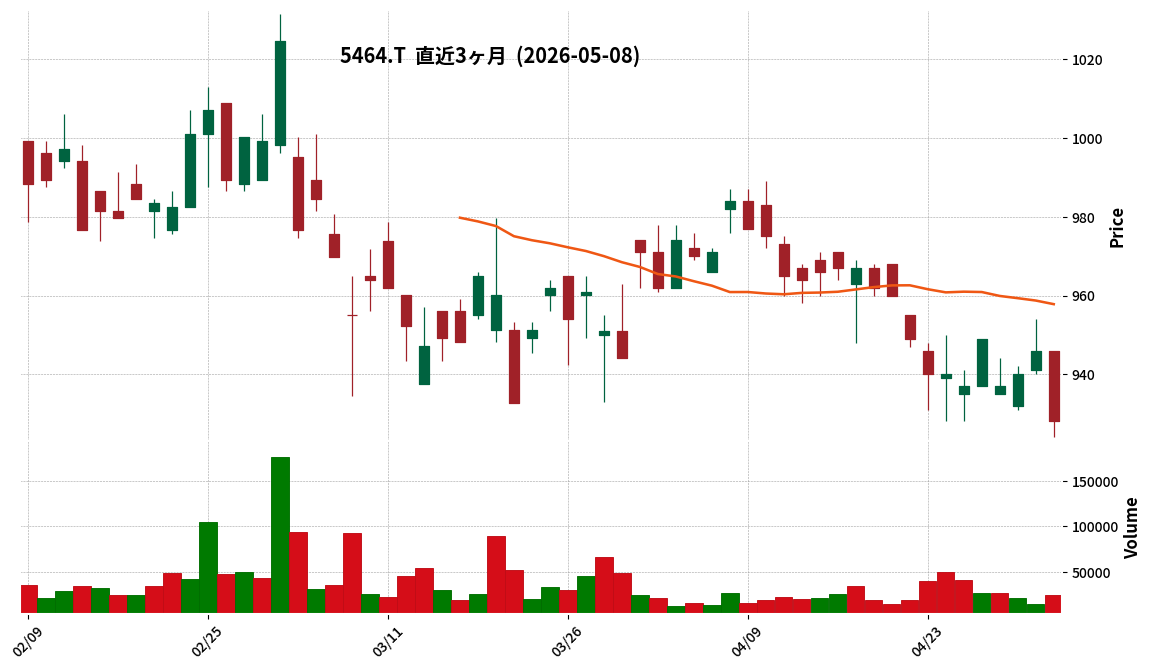
This article is an AI-generated summary and analysis of official IR disclosures.
📄 Announcement (AI-Reviewed)
- MORY Industries reported consolidated results for the fiscal year ended March 2026, with net sales of ¥43,288 million (down 6.2% YoY), operating profit of ¥4,378 million (down 18.9% YoY), ordinary profit of ¥4,879 million (down 14.7% YoY), and net income attributable to owners of parent of ¥3,358 million (down 18.6% YoY).
- Diluted earnings per share for FY2026 March was ¥88.37, and net assets per share were ¥1,540.24.
- The annual dividend for FY2026 March was ¥36.00 (total dividends ¥1,374 million), with a consolidated dividend payout ratio of 40.7%.
- For the fiscal year ending March 2027, the company forecasts consolidated net sales of ¥44,300 million (up 2.3% YoY), operating profit of ¥4,100 million (down 6.4% YoY), ordinary profit of ¥4,600 million (down 5.7% YoY), and net income attributable to owners of parent of ¥3,200 million (down 4.7% YoY).
- The forecast for the annual dividend for FY2027 March is ¥34.00.
- The company implemented a five-for-one stock split of common shares on April 1, 2025; per-share information for the previous fiscal year is calculated assuming this stock split had occurred at the beginning of that period.
🤖 AI Perspective
While MORY Industries concluded FY2026 March with decreased revenue and profit, the FY2027 March consolidated forecast projects an increase in net sales but a decrease in profits. Although the annual dividend is expected to slightly decrease from the previous year’s actual to the current year’s forecast, the company maintains a high equity ratio of 80.5%, which could be a point of stability. The evolution of earnings and dividend policy may be key areas for investors to monitor.
5830|いよぎんHD
2994.5
▼ -4.02%
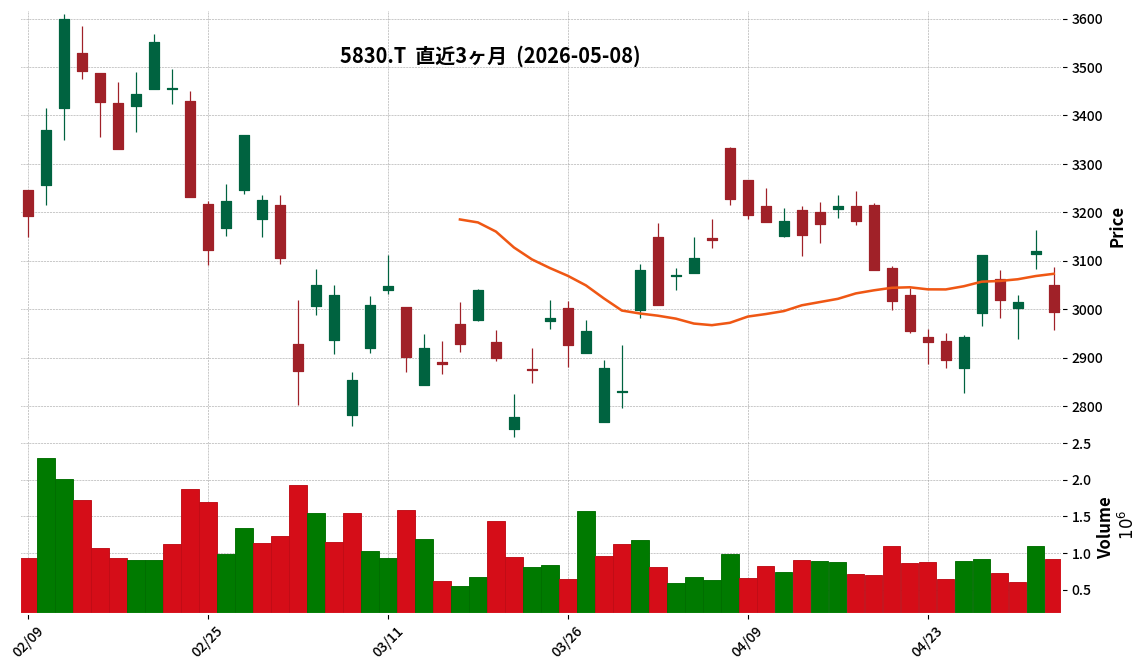
This article is an AI-generated summary and analysis of official IR disclosures.
📄 Announcement (AI-Reviewed)
- **FY2026 Results**: Consolidated ordinary revenue reached ¥266,118 million (up 14.8% YoY), ordinary profit ¥99,206 million (up 32.2% YoY), and net profit attributable to parent company shareholders ¥74,253 million (up 39.3% YoY).
- **Dividends**: The annual dividend for FY2026 has been set at ¥60.00 per share (interim ¥30.00, year-end ¥30.00).
- **FY2027 Forecast**: Consolidated ordinary revenue is projected to be ¥270,000 million (full-year forecast, up 1.5% YoY), ordinary profit ¥111,000 million (up 11.9% YoY), and net profit attributable to parent company shareholders ¥77,000 million (up 3.7% YoY).
- **FY2027 Dividend Forecast**: The company plans an annual dividend of ¥80.00 per share (interim ¥40.00, year-end ¥40.00), representing a ¥20.00 increase per share compared to the previous fiscal year.
- **Financial Position**: As of the end of March 2026, total assets were ¥9,539,812 million, net assets were ¥877,882 million, and the capital adequacy ratio stood at 9.2%.
🤖 AI Perspective
Iyogin HD’s strong performance in FY2026 appears to be driven by increased funding income from rising domestic interest rates and growth in loan balances, alongside gains from securities sales. The reported net profit also benefited from a ¥6.0 billion special gain from a settlement regarding a “system upgrade plan change.” The projected increase in earnings and dividends for FY2027 could signal the company’s commitment to its shareholder return policy outlined in its mid-term management plan.
6085|G-アーキテクツSJ
570.0
▼ -7.32%
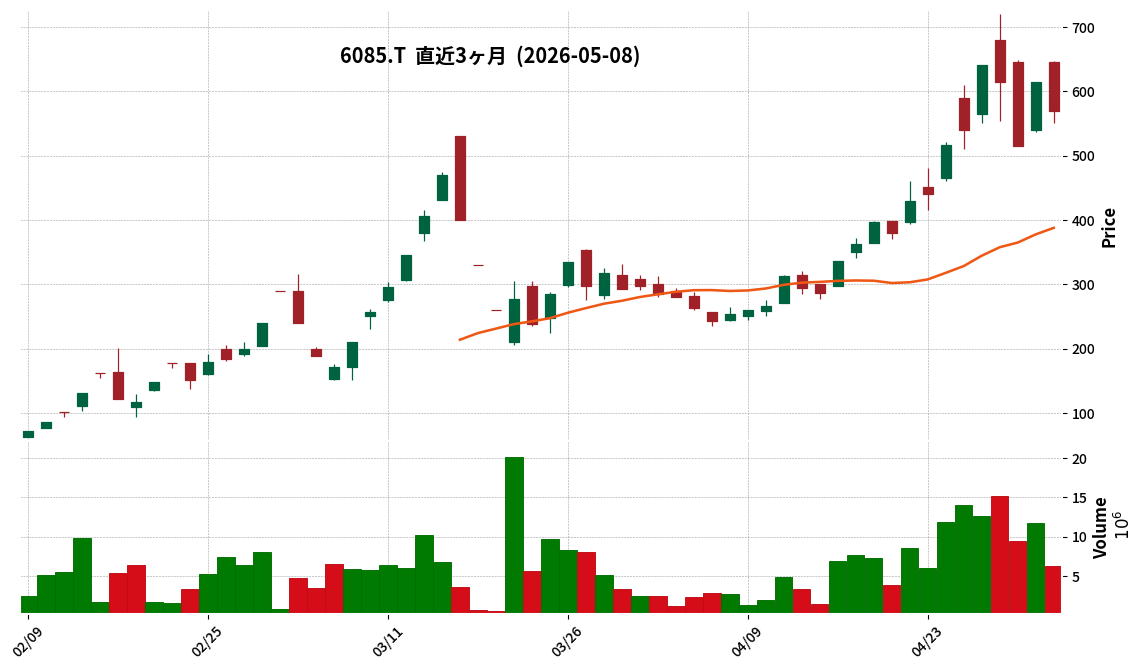
📎 Source:G-アーキテクツSJ Official IR →
This article is an AI-generated summary and analysis of official IR disclosures.
📄 Announcement (AI-Reviewed)
- Architects Studio Japan Co., Ltd. announced on May 8, 2026, corrections to its “Consolidated Financial Results for the Fiscal Year Ended February 2026 (Japanese GAAP),” originally published on April 17, 2026.
- The primary reason for the corrections was the omission of an increase in treasury stock and a decrease in net assets resulting from odd-lot share purchases during the fiscal year.
- The corrected number of treasury shares at the end of February 2026 increased by 21 shares, from 11,925 shares to 11,946 shares.
- In the consolidated balance sheet, total liabilities at the end of the current consolidated fiscal year increased by 12 thousand yen, from 634,564 thousand yen to 634,576 thousand yen, and total net assets decreased by 13 thousand yen, from △223,168 thousand yen to △223,181 thousand yen.
- In the consolidated cash flow statement, cash flows from operating activities were revised from △656,177 thousand yen to △656,165 thousand yen (a 12 thousand yen change), and cash flows from financing activities were revised from 109,763 thousand yen to 109,751 thousand yen (a 12 thousand yen change).
🤖 AI Perspective
These corrections stem from an oversight in accounting for treasury stock, with the magnitude of the numerical adjustments being relatively minor—21 shares and approximately 12 to 13 thousand yen—suggesting a limited overall impact on the company’s financial statements. While the company notes that the corrections affect multiple sections, the small individual variances indicate that the fundamental integrity of the financial results remains intact. Investors may view this as a routine measure to maintain disclosure accuracy, highlighting the importance of precise information for informed decision-making.
2883|大冷
1975.0
▼ -0.25%
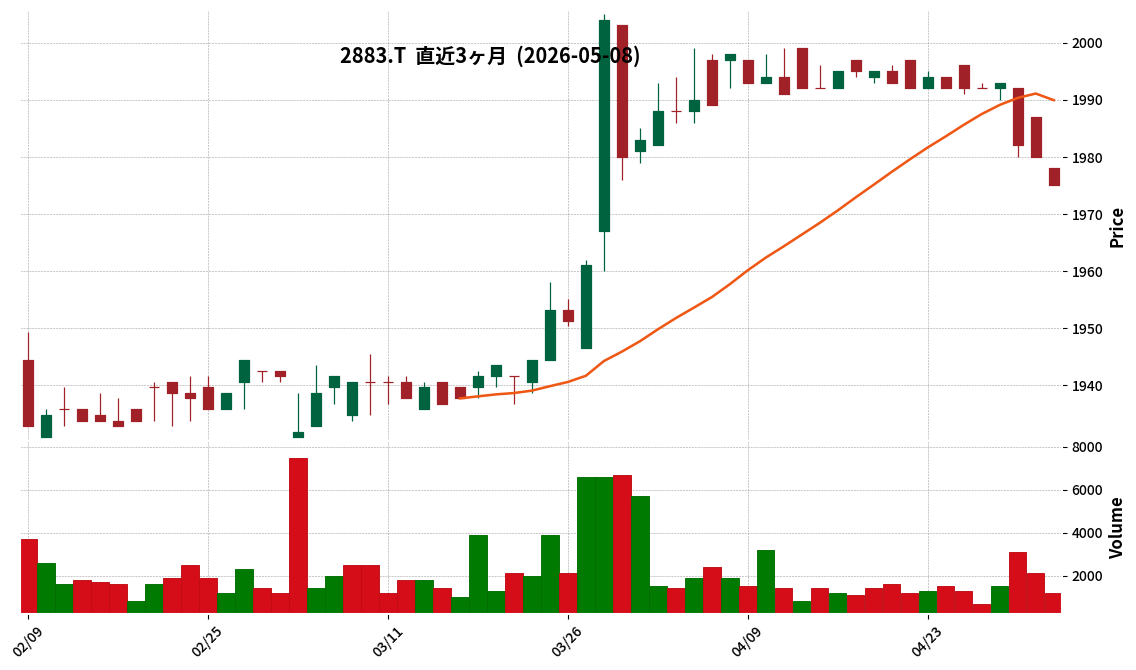
This article is an AI-generated summary and analysis of official IR disclosures.
📄 Announcement (AI-Reviewed)
- DAIREI Co., Ltd. announced its non-consolidated financial results for the fiscal year ended March 31, 2026 (April 1, 2025, to March 31, 2026). Net sales were ¥25,053 million (down 2.6% year-on-year), operating profit was ¥660 million (down 21.5% year-on-year), and ordinary profit was ¥693 million (down 17.9% year-on-year). Net profit for the period was ¥482 million, a swing to profit from a net loss of ¥574 million in the previous fiscal year.
- Regarding the financial position, total assets as of March 31, 2026, were ¥11,313 million, and net assets were ¥8,823 million. The equity ratio improved to 78.0%, an increase of 1.6 percentage points compared to the previous fiscal year.
- Cash flows for the fiscal year showed ¥309 million in cash inflow from operating activities, ¥31 million in cash outflow from investing activities, and ¥468 million in cash outflow from financing activities. Cash and cash equivalents at the end of the period stood at ¥3,577 million.
- The annual dividend for the fiscal year ended March 31, 2026, was ¥60.00 per share (including a year-end dividend of ¥60.00), with total dividends paid amounting to ¥354 million.
- For the fiscal year ending March 31, 2027 (April 1, 2026, to March 31, 2027), the company forecasts net sales of ¥25,200 million (up 0.6% year-on-year), operating profit of ¥780 million (up 18.1% year-on-year), ordinary profit of ¥780 million (up 12.5% year-on-year), and net profit of ¥525 million (up 8.8% year-on-year). The forecasted annual dividend is ¥60.00 per share.
🤖 AI Perspective
For the fiscal year ended March 31, 2026, Dairei reported a decline in revenue and operating/ordinary profit, but notably achieved a net profit of ¥482 million, swinging from a loss in the prior year. This decline in sales and profits may be attributed to a decrease in gross profit margin, driven by increased discounts to cater to consumer demand for lower prices amid rising raw material and energy costs in the domestic food industry. The company’s forecast for the fiscal year ending March 31, 2027, projects an increase in both revenue and profit, suggesting an expectation for improved market conditions or the effectiveness of ongoing business strategies.
3839|ODK
620.0
▼ -0.64%
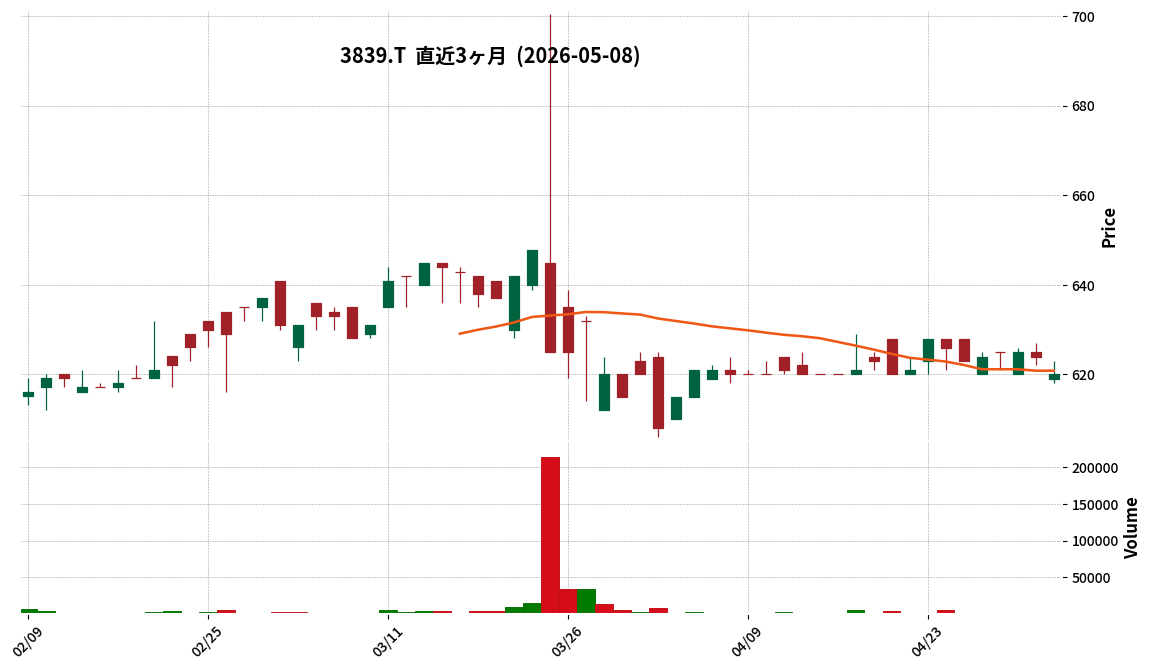
This article is an AI-generated summary and analysis of official IR disclosures.
📄 Announcement (AI-Reviewed)
- ODK’s consolidated financial results for the fiscal year ended March 2026 show net sales of JPY 6,657 million, a 2.9% increase year-on-year, marking a record high for the second consecutive term.
- Ordinary profit increased by 14.3% year-on-year to JPY 659 million.
- Net profit attributable to owners of the parent decreased by 47.0% year-on-year to JPY 139 million.
- The Education business recorded JPY 4,138 million (+5.9% YoY) and the Securities/Hofuri business recorded JPY 1,277 million (+9.7% YoY), showing growth in key segments.
- Intangible assets decreased by JPY 595 million from the previous fiscal year-end to JPY 869 million, primarily due to impairment losses on goodwill from subsidiary shares.
🤖 AI Perspective
The fiscal year 2026/3 results indicate strong performance in sales and ordinary profit, primarily driven by growth in the Education and Securities/Hofuri segments. However, the decline in net profit appears to be influenced by special losses taken from a conservative perspective and impairment of goodwill. Investors may find it worthwhile to monitor the company’s efforts in managing subsidiary performance and the contribution of new business initiatives in future reports.
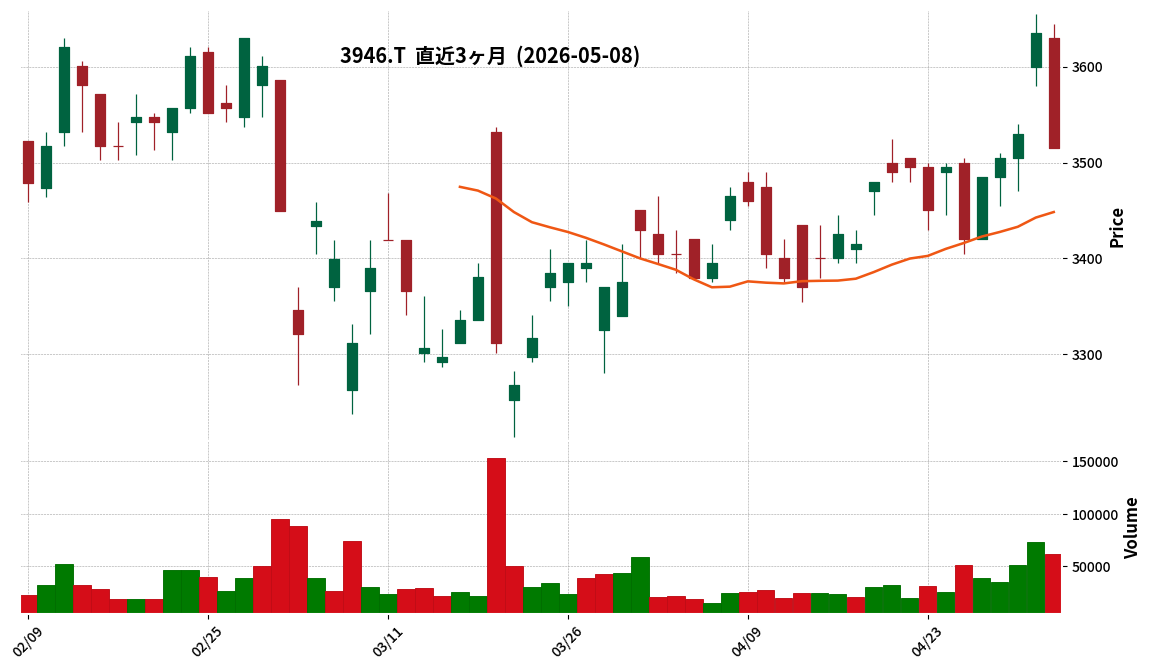
3946|トーモク
3515.0
▼ -3.30%
This article is an AI-generated summary and analysis of official IR disclosures.
📄 Announcement (AI-Reviewed)
- For the fiscal year ended March 2026, Tomoku reported consolidated net sales of ¥224,090 million (up 2.0% year-on-year), operating profit of ¥11,378 million (up 21.6%), ordinary profit of ¥11,445 million (up 21.7%), and net income attributable to owners of parent of ¥7,361 million (up 13.1%).
- The annual dividend per share for FY2026 was ¥130, an increase of ¥30 from ¥100 in the previous fiscal year.
- For the fiscal year ending March 2027, the company forecasts consolidated net sales of ¥220,500 million (down 1.6% year-on-year), operating profit of ¥12,700 million (up 11.6%), ordinary profit of ¥11,900 million (up 4.0%), and net income attributable to owners of parent of ¥8,100 million (up 10.0%).
- The projected annual dividend per share for FY2027 is ¥170, representing an increase of ¥40 from the previous fiscal year’s actual dividend.
- During the fiscal year, Niei Shikoh Co., Ltd. and Enshu Shikoh Co., Ltd. were newly included in the scope of consolidation, while Sweden House Reform Co., Ltd. was excluded.
🤖 AI Perspective
The consolidated results for FY2026, showing double-digit profit growth despite a modest increase in net sales, may suggest an improvement in profitability. The consistent increase in the annual dividend, both for the past fiscal year and projected for the next, indicates a potentially proactive stance on shareholder returns. While the FY2027 forecast anticipates a decrease in net sales, the projected profit growth could imply ongoing efforts in business restructuring and cost efficiency.
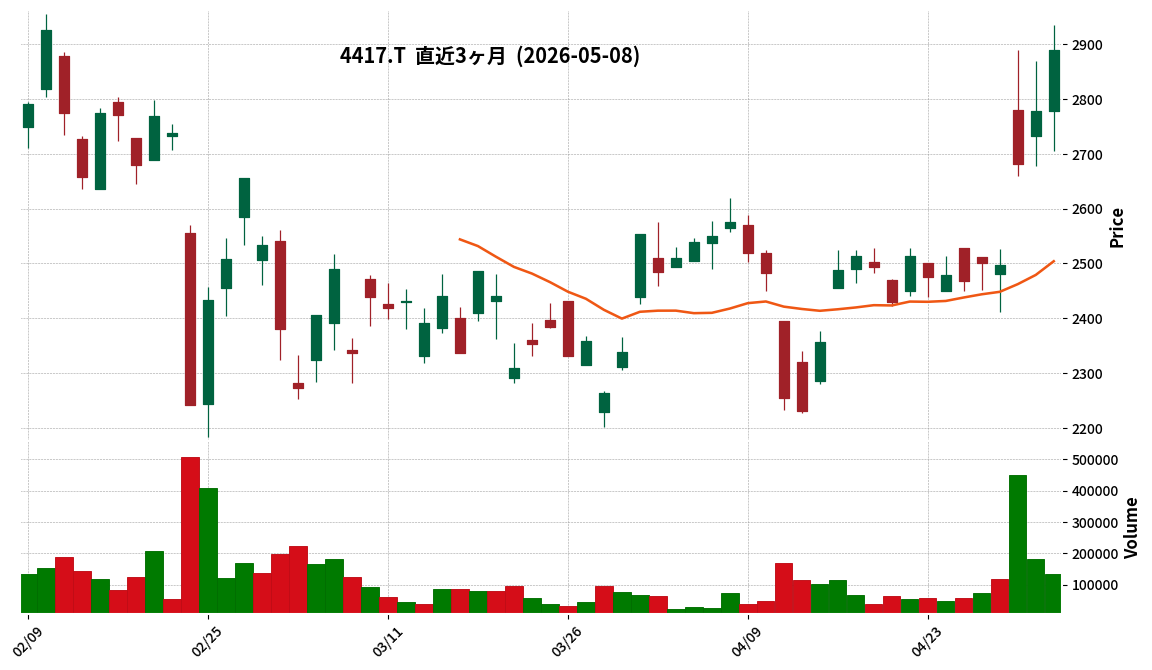
4417|G-グローバルセキュ
2889.0
▲ +4.00%
📎 Source:G-グローバルセキュ Official IR →
This article is an AI-generated summary and analysis of official IR disclosures.
📄 Announcement (AI-Reviewed)
- Global Security Experts Inc. (GSX) announced on May 8, 2026, a business alliance with CoWorker Co., Ltd. concerning AI and cybersecurity.
- The alliance aims to accelerate GSX’s stated ‘Growth Strategy in the Age of AI’ and achieve further growth for the group in the AI era.
- CoWorker Co., Ltd. specializes in IT consulting and service development focused on AI and security, offering system development, IT consulting/AI development consulting, and cybersecurity services.
- GSX’s ‘Growth Strategy in the Age of AI’ defines three evolutions: “Leaner Existing Businesses” (efficiency/price competitiveness via AI), “Acquisition of New Value in Cybersecurity” (new AI-driven services), and “New Market Development” (AI market implementation with security expertise).
- The impact of this alliance on GSX’s financial performance for the fiscal year ending March 2027 is currently under review.
🤖 AI Perspective
This business alliance appears to be a strategic move for Global Security Experts to accelerate and solidify its ‘Growth Strategy in the Age of AI,’ indicating a clear focus on integrating AI into its core cybersecurity offerings. The partnership with CoWorker, a specialist in AI and security, could significantly enhance GSX’s capabilities in developing new services and expanding into AI-driven markets. Investors may find it worthwhile to monitor the specifics of future service rollouts and the eventual financial impact, which GSX has stated is currently under review.
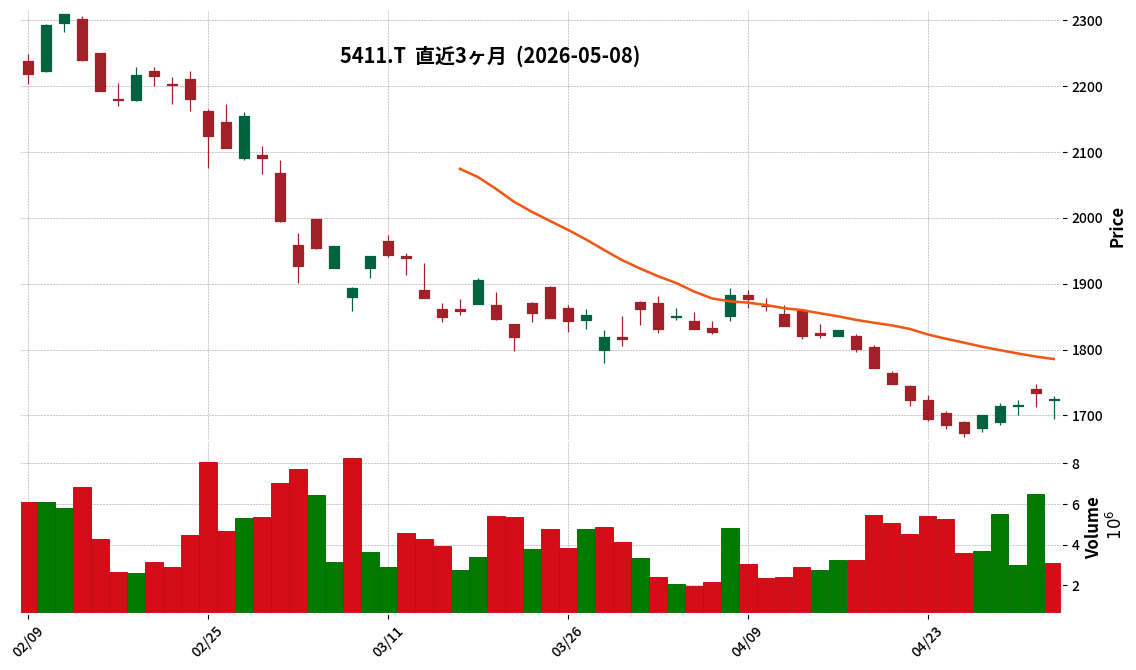
5411|JFE
1725.5
▼ -0.52%
This article is an AI-generated summary and analysis of official IR disclosures.
📄 Announcement (AI-Reviewed)
- JFE Holdings announced its consolidated financial results for the fiscal year ended March 31, 2026.
- The business environment for the steel segment was recognized as challenging due to the slump in electric furnace steel product markets, sluggish demand for domestic construction and industrial machinery, and an adjusting overseas steel market, despite robust demand from the automotive sector.
- The company noted persistent high resource and electricity prices, leading to increased production costs from rising energy prices. Conversely, the yen’s depreciation contributed to improved export profitability but also resulted in higher imported raw material costs.
- The engineering segment and the trading house segment performed robustly.
- The year-end dividend forecast for the fiscal year ended March 31, 2026, has been declared as “undecided.”
🤖 AI Perspective
JFE Holdings’ qualitative assessment for the fiscal year ended March 31, 2026, highlights the challenging business environment for its core steel segment, potentially indicating ongoing pressures on the company’s profitability. The robust performance of the engineering and trading house segments, however, may suggest the benefits of diversified business operations in mitigating some of these challenges. Investors might focus on how the company plans to navigate persistent high resource costs and foreign exchange fluctuations in the upcoming periods.
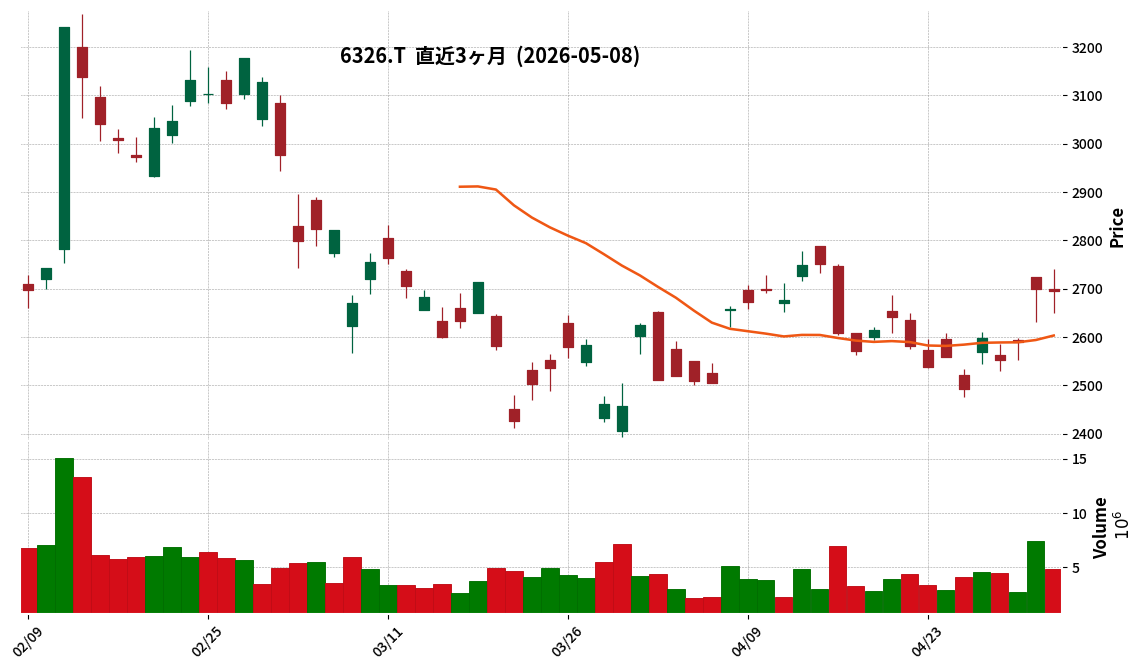
6326|クボタ
2695.5
▼ -0.17%
This article is an AI-generated summary and analysis of official IR disclosures.
📄 Announcement (AI-Reviewed)
- Kubota Corporation announced its consolidated financial results for the first quarter of the fiscal year ending December 2026 (January 1, 2026 – March 31, 2026).
- For Q1 FY2026, consolidated net sales reached ¥810,012 million, marking a 13.7% increase year-on-year, while operating profit rose 59.1% to ¥98,042 million.
- Profit attributable to owners of the parent was ¥73,285 million (up 77.2% year-on-year), and basic earnings per share were ¥64.45.
- By segment, the Machinery segment reported sales of ¥700,800 million (up 14.9% year-on-year) and segment profit of ¥79,700 million (up 45.0% year-on-year). The Water & Environment segment recorded sales of ¥105,200 million (up 6.5% year-on-year) and segment profit of ¥14,300 million (up 6.9% year-on-year).
- The consolidated full-year earnings forecast for fiscal year 2026 and the annual dividend forecast of ¥52.00 remain unchanged from the most recently published figures.
🤖 AI Perspective
Kubota’s Q1 FY2026 results show a significant year-on-year increase in net sales and various profit metrics, suggesting a strong start to the fiscal year. The Machinery segment appears to be a key driver of this growth, with improved foreign exchange rates, increased sales volume, and price revisions contributing to profitability. While the full-year outlook remains unchanged, the strong Q1 performance may indicate positive momentum worth monitoring.
6340|渋谷工
3590.0
▼ -1.24%
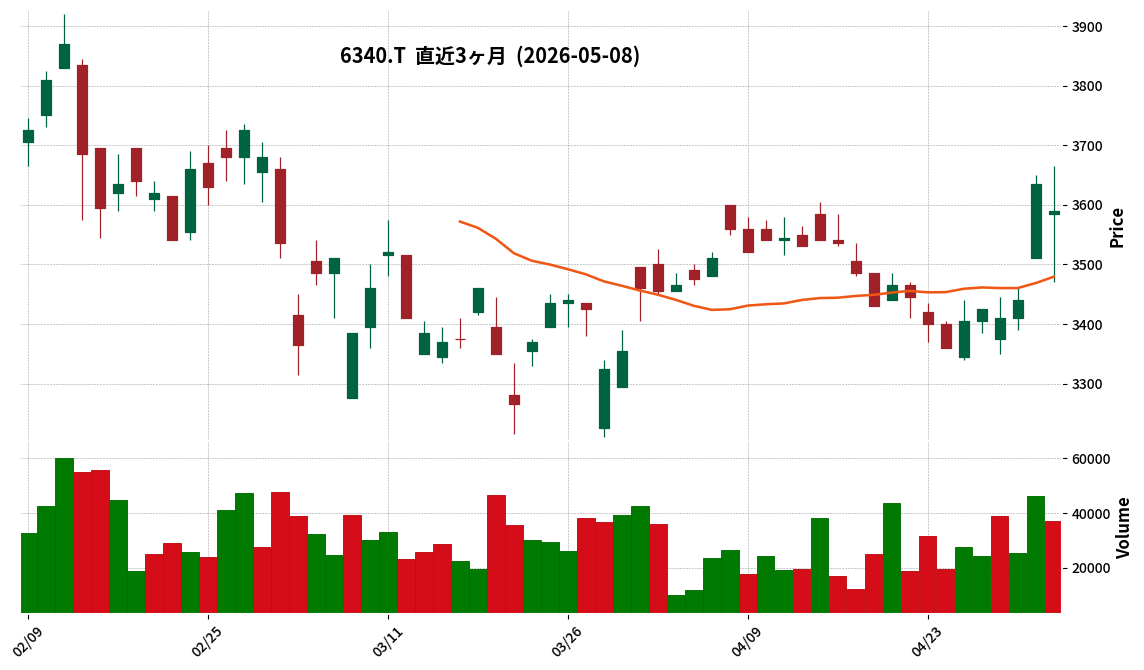
This article is an AI-generated summary and analysis of official IR disclosures.
📄 Announcement (AI-Reviewed)
7989|立川ブライ
2525.0
▼ -2.51%
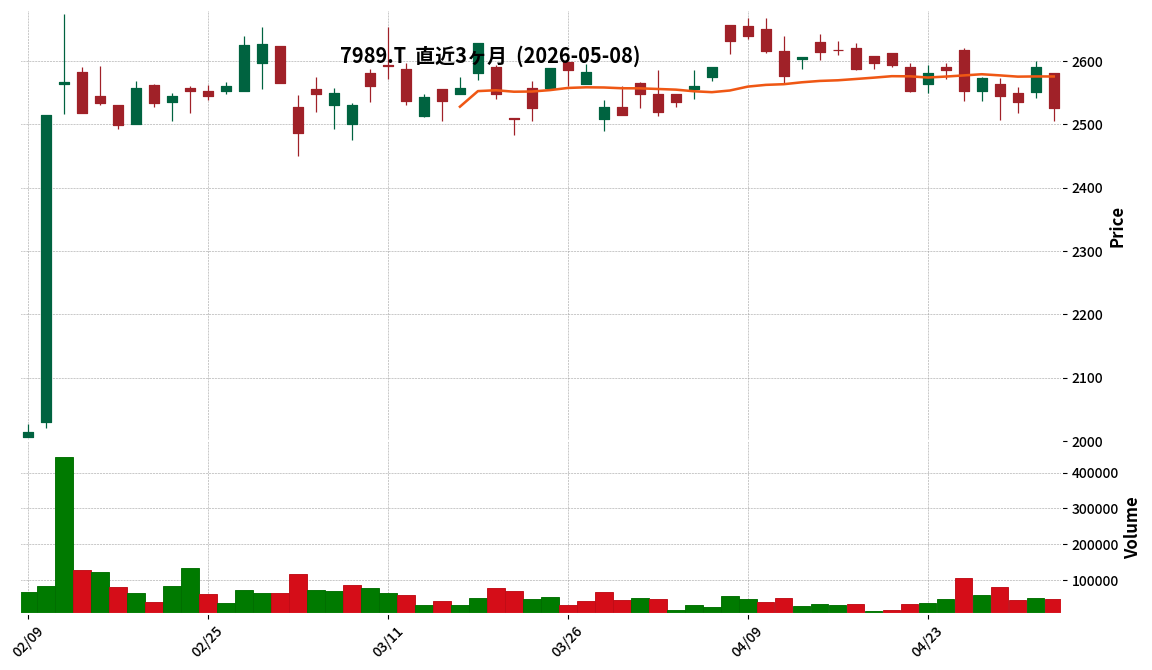
This article is an AI-generated summary and analysis of official IR disclosures.
📄 Announcement (AI-Reviewed)
- Tachikawa Blind Industry Co., Ltd. announced its consolidated financial results for the first quarter of the fiscal year ending December 2026 (January 1 to March 31, 2026).
- For the quarter, consolidated net sales were ¥11,353 million, an 8.0% increase year-on-year. Operating profit rose by 17.3% to ¥1,566 million, ordinary profit increased by 18.5% to ¥1,604 million, and profit attributable to owners of parent grew by 0.1% to ¥1,064 million.
- By segment, the Parking System Related Business recorded significant growth, with sales of ¥1,101 million (up 82.7% year-on-year) and operating profit of ¥209 million (up 105.6% year-on-year). The Reducer Related Business also showed substantial increases, with sales of ¥838 million (up 19.5% year-on-year) and operating profit of ¥51 million (up 742.5% year-on-year).
- In terms of consolidated financial position, total assets stood at ¥67,171 million and net assets at ¥56,682 million, resulting in an equity ratio of 84.4%, an increase of 1.2 percentage points from the end of the previous fiscal year.
- The consolidated full-year earnings forecast for December 2026 and the annual dividend forecast of ¥120.00 remain unchanged from the most recently announced figures.
🤖 AI Perspective
Tachikawa Blind Industry’s first-quarter results for the fiscal year ending December 2026 indicate a strong start, with increases in net sales, operating profit, and ordinary profit. The Parking System Related Business and Reducer Related Business appear to be key drivers of this performance, demonstrating significant growth in both sales and operating profit. Furthermore, the high equity ratio suggests the company maintains a stable financial foundation.
8020|兼松
2136.0
▼ -1.04%
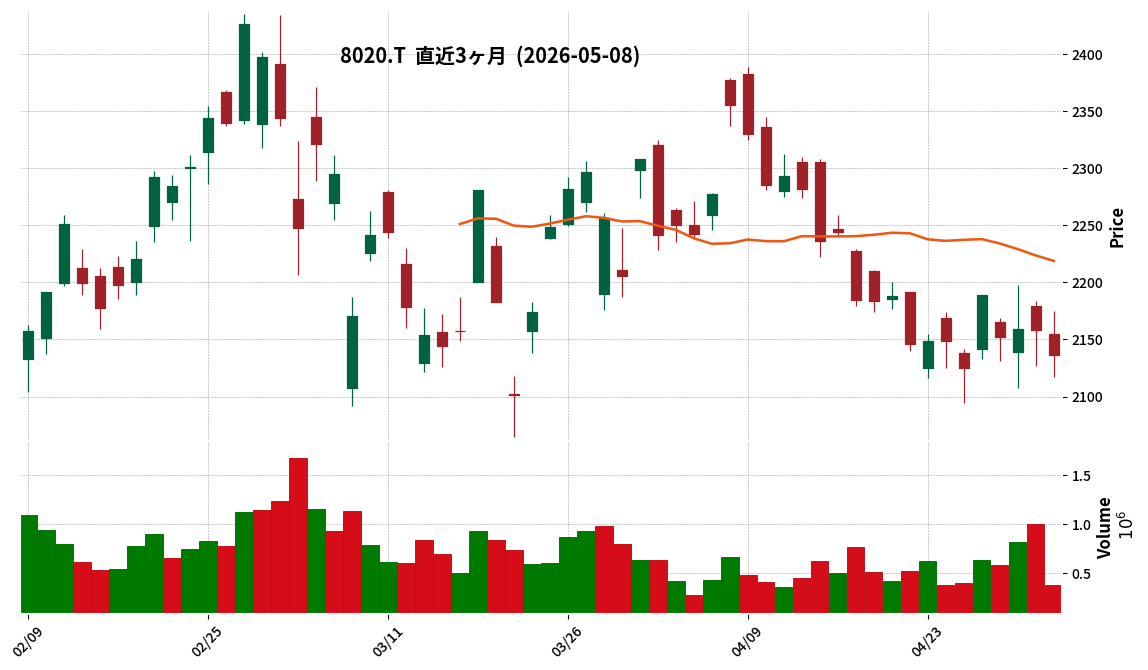
This article is an AI-generated summary and analysis of official IR disclosures.
📄 Announcement (AI-Reviewed)
- Kanematsu Corporation resolved to revise its year-end dividend forecast for the fiscal year ending March 2026 at a Board of Directors meeting held on May 8, 2026.
- The revised year-end dividend forecast for the fiscal year ending March 2026 is ¥34.25 per share (post-stock split), an increase of ¥3 from the previous forecast.
- Consequently, the total annual dividend per share for the fiscal year ending March 2026 is expected to be ¥63.00 (post-stock split), or ¥126.00 (pre-stock split).
- The revision is attributed to the company’s performance for the fiscal year ending March 2026 exceeding its initial outlook.
- The company conducted a 2-for-1 stock split of its common shares effective January 1, 2026.
🤖 AI Perspective
Kanematsu’s revision to its year-end dividend forecast likely reflects a strong commitment to shareholder returns and robust business performance. This move appears consistent with the progressive dividend policy and the 30-35% dividend payout ratio target outlined in its medium-term management plan. The clarification of post-stock split dividend amounts may offer investors valuable insight for their future investment decisions.
8367|南都銀
1532.0
▲ +1.86%
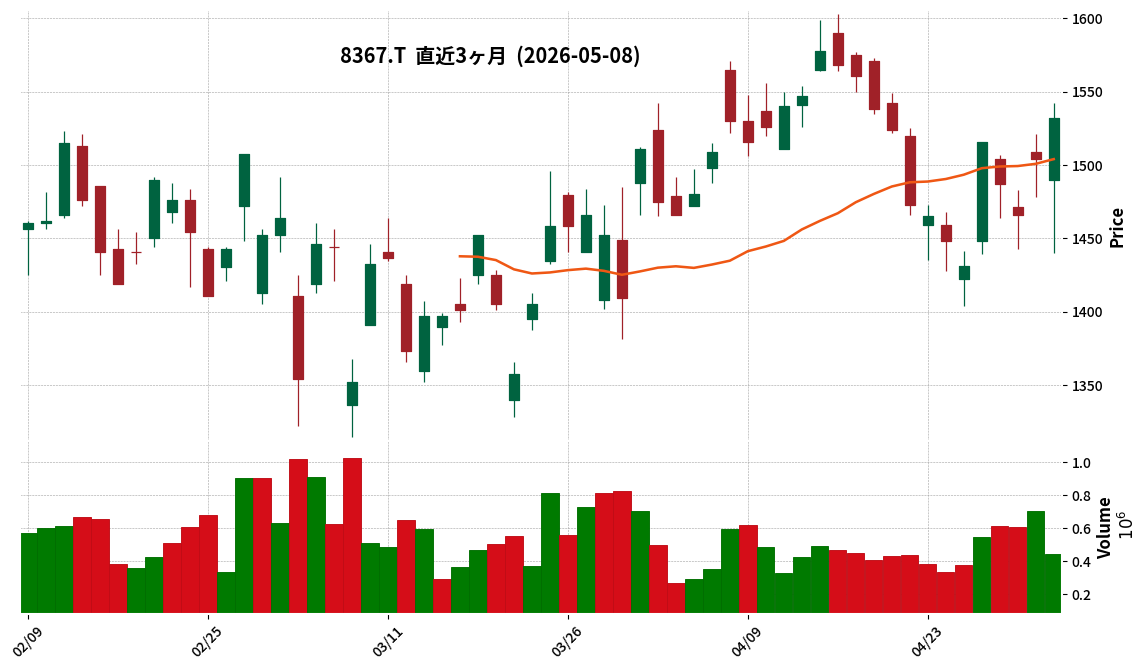
This article is an AI-generated summary and analysis of official IR disclosures.
📄 Announcement (AI-Reviewed)
- Nanto Bank Co., Ltd. announced its consolidated financial results for the fiscal year ended March 31, 2026 (April 1, 2025 to March 31, 2026).
- Consolidated ordinary revenues for FY2026/3 increased by 12.2% to JPY 115,665 million, ordinary profit rose by 26.1% to JPY 24,820 million, and profit attributable to owners of parent grew by 26.2% to JPY 17,062 million.
- The annual dividend for FY2026/3 was declared at JPY 215.00 per share, an increase of JPY 45.00 from the previous fiscal year.
- For the fiscal year ending March 31, 2027 (FY2027/3), Nanto Bank forecasts consolidated ordinary profit to be JPY 32,500 million (a 30.9% increase year-on-year) and profit attributable to owners of parent to be JPY 22,000 million (a 28.9% increase year-on-year).
- The company implemented a 5-for-1 stock split effective April 1, 2026.
🤖 AI Perspective
Nanto Bank’s FY2026/3 results show significant growth across key revenue and profit metrics, coupled with an increased dividend. The positive outlook for FY2027/3, projecting continued profit growth, may suggest a strong business trajectory. The recently implemented stock split could be viewed as a strategy to reduce the per-share investment amount, potentially aiming to enhance stock liquidity and broaden investor accessibility.
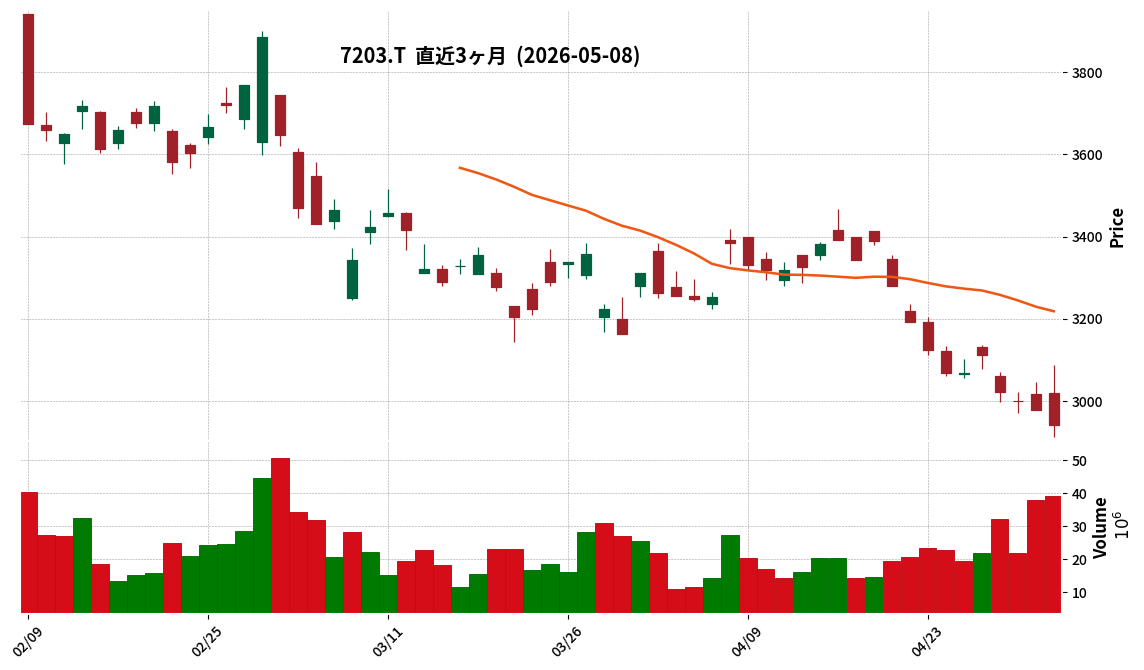
7203|トヨタ自
2942.0
▼ -1.21%
This article is an AI-generated summary and analysis of official IR disclosures.
📄 Announcement (AI-Reviewed)
- For the fiscal year ended March 31, 2026, Toyota Motor Corporation reported consolidated operating revenue of JPY 50,684,952 million, a 5.5% increase year-on-year.
- Consolidated operating profit for FY2026/3 decreased by 21.5% to JPY 3,766,216 million, and profit attributable to owners of the parent decreased by 19.2% to JPY 3,848,098 million.
- The full-year dividend for FY2026/3 was JPY 95.00 per share, an increase of JPY 5.00 from the prior fiscal year.
- For the fiscal year ending March 31, 2027, the company forecasts consolidated operating revenue of JPY 51,000,000 million (up 0.6% year-on-year), operating profit of JPY 3,000,000 million (down 20.3%), and profit attributable to owners of the parent of JPY 3,000,000 million (down 22.0%).
- A full-year dividend of JPY 100.00 per share is forecasted for FY2027/3.
- U.S. tariff policies had a JPY 1,380 billion negative impact on operating profit for FY2026/3.
🤖 AI Perspective
While operating revenue showed growth, the notable declines in operating profit and profit attributable to owners of the parent for FY2026/3 may suggest a challenging profitability environment. Despite the projected profit contraction for FY2027/3, the company’s decision to increase the full-year dividend for FY2026/3 and forecast a further increase for FY2027/3 could indicate a consistent commitment to shareholder returns. The significant JPY 1,380 billion impact from U.S. tariff policies highlights the influence of external factors on the company’s financial performance.
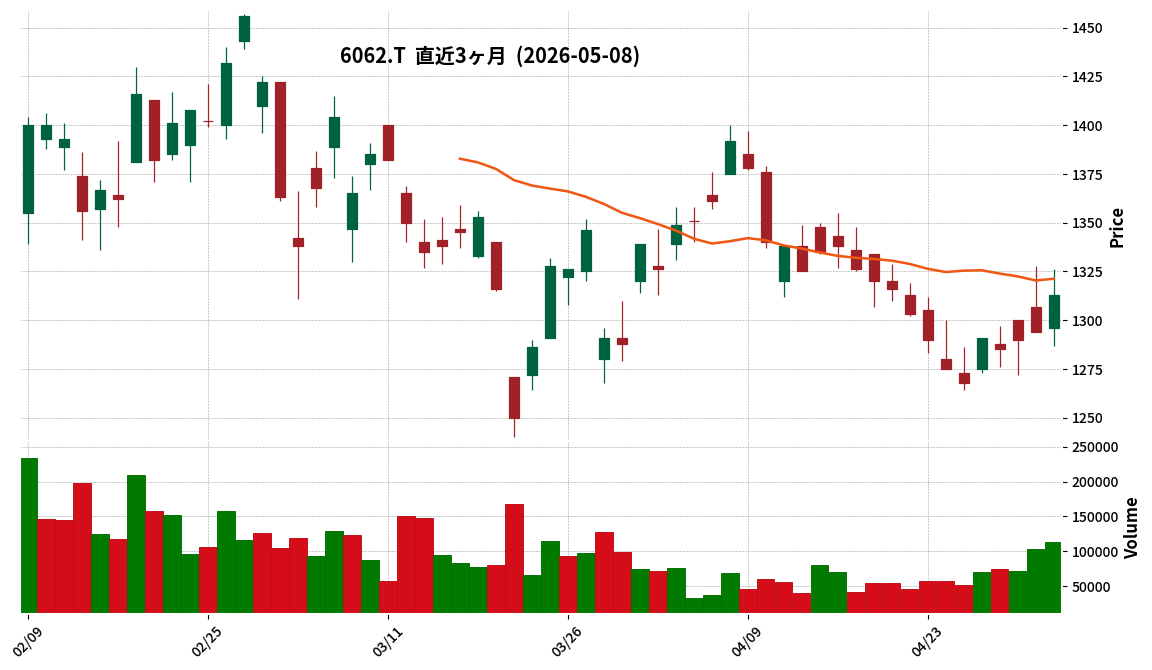
6062|チャームケア
1313.0
▲ +1.47%
This article is an AI-generated summary and analysis of official IR disclosures.
📄 Announcement (AI-Reviewed)
- For the nine months ended March 31, 2026 (FY2026 Q3 cumulative period), Charm Care reported consolidated net sales of ¥33,893 million (up 11.8% year-on-year), operating profit of ¥3,603 million (up 43.9%), and net income attributable to owners of the parent of ¥2,560 million (up 39.0%).
- Diluted earnings per share for the period were ¥78.37.
- The full-year consolidated earnings forecast for FY2026 remains unchanged from the most recently announced projections, with net sales of ¥48,585 million, operating profit of ¥4,460 million, and net income attributable to owners of the parent of ¥3,090 million.
- The annual dividend forecast for FY2026 totals ¥37.00 per share, comprising an interim dividend of ¥20.00 (including a ¥3 special commemorative dividend) and a projected year-end dividend of ¥17.00, with no revisions from the latest forecast.
- The company’s performance overview states that robust performance in the nursing care business and improved productivity were key drivers for the expanded revenue and profit.
🤖 AI Perspective
Charm Care achieved significant revenue and profit increases during the third quarter cumulative period, primarily driven by the solid performance of its nursing care business and enhanced productivity. The company has implemented human resource strategies, including improving employee compensation, expanding work-style options, and shifting to an OJT-focused training system, which appear to be contributing to its business growth. The unchanged full-year earnings and annual dividend forecasts suggest that current business strategies are progressing as planned.
9359|伊勢湾海
—
▲ +0.00%
This article is an AI-generated summary and analysis of official IR disclosures.
📄 Announcement (AI-Reviewed)
- Isewan Terminal Service Co. resolved a dividend of surplus (special dividend) for the fiscal year ended March 31, 2026, at its Board of Directors meeting on May 8, 2026.
- The year-end dividend for the fiscal year ending March 31, 2026, will be JPY 24.00 per share, consisting of an ordinary dividend of JPY 13.00 and a special dividend of JPY 11.00.
- This decision results in an annual dividend of JPY 37.00 per share for the fiscal year ending March 31, 2026, including the interim dividend of JPY 13.00.
- The total dividend amount is JPY 612 million, with an effective date of June 29, 2026.
- This matter is scheduled to be proposed at the 103rd Ordinary General Meeting of Shareholders on June 26, 2026.
🤖 AI Perspective
- The implementation of a special dividend may suggest the company’s commitment to shareholder returns.
- This decision results in an increased annual dividend for the fiscal year ending March 31, 2026, compared to the previous fiscal year (JPY 29.00), which could be a point of interest for investors.
- The company’s statement of considering “current consolidated business performance” for the special dividend might indicate strong recent financial results.
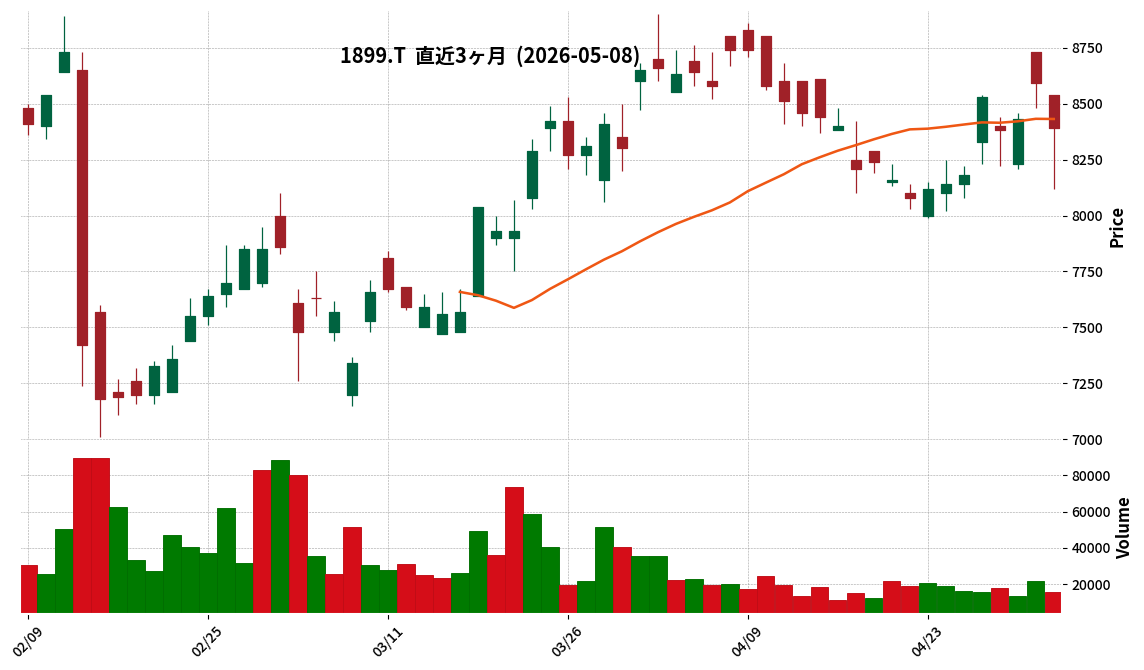
1899|福田組
8390.0
▼ -2.33%
This article is an AI-generated summary and analysis of official IR disclosures.
📄 Announcement (AI-Reviewed)
- Fukuda Corp. announced its consolidated financial results for the first quarter of the fiscal year ending December 2026 (January 1, 2026 – March 31, 2026).
- For the cumulative first quarter, net sales reached ¥41.864 billion, an increase of 4.0% year-on-year. Operating profit rose by 26.4% to ¥2.873 billion, ordinary profit increased by 26.6% to ¥3.001 billion, and profit attributable to owners of parent grew by 30.6% to ¥2.008 billion.
- Basic earnings per share for the quarter stood at ¥242.55.
- The company plans a 2-for-1 stock split of its common shares, effective July 1, 2026. Consequently, the annual dividend forecast for the fiscal year ending December 2026 has been revised to ¥130.00 per share (post-split).
- The full-year consolidated earnings forecast for the fiscal year ending December 2026 remains unchanged, projecting net sales of ¥175.600 billion (up 4.5% year-on-year), operating profit of ¥7.600 billion (down 2.2%), and profit attributable to owners of parent of ¥5.000 billion (down 9.9%).
🤖 AI Perspective
- Fukuda Corp. achieved strong first-quarter results for FY2026, with significant year-on-year increases in sales and all profit categories, suggesting a robust start to the fiscal year.
- The concurrent announcement of a stock split, effective July 1, 2026, may aim to lower the price per investment unit, potentially broadening the company’s investor base.
- Despite the strong Q1 performance, the full-year consolidated earnings forecast remains unchanged, which anticipates a decline in operating and net profits compared to the previous fiscal year, a point that investors might monitor as the year progresses.
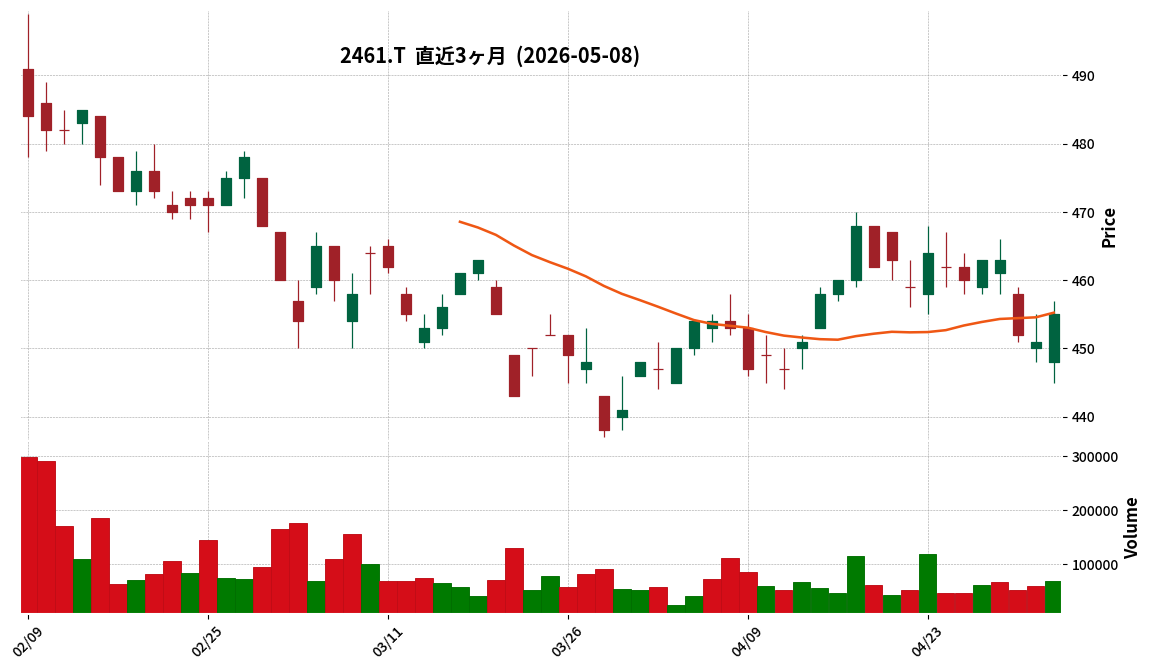
2461|ファンコミ
455.0
▲ +0.89%
This article is an AI-generated summary and analysis of official IR disclosures.
📄 Announcement (AI-Reviewed)
- FUNCOM Corporation announced its consolidated financial results for the first quarter of the fiscal year ending December 2026 on May 8, 2026, covering the period from January 1 to March 31, 2026.
- Consolidated performance showed net sales of ¥1,733 million (down 6.6% year-on-year), operating profit of ¥273 million (down 53.9% year-on-year), ordinary profit of ¥225 million (down 60.1% year-on-year), and quarterly net profit attributable to parent company shareholders of ¥108 million (down 72.3% year-on-year).
- In the CPA Solutions segment, net sales decreased by 16.8% year-on-year to ¥1,280 million, with segment profit down 18.9% year-on-year to ¥847 million. This was attributed to a decrease in active advertisers and lower commission rates for “A8.net.”
- The Strategic Business segment recorded a 42.8% year-on-year increase in net sales to ¥452 million, but the segment loss expanded to ¥253 million (compared to a loss of ¥154 million in the prior year’s first quarter) due to upfront investments, such as advertising expenses, outpacing sales growth.
- The consolidated full-year earnings forecast for the fiscal year ending December 2026 and the annual dividend forecast of ¥21.00 per share remain unchanged from the previously announced figures.
🤖 AI Perspective
- The first quarter results indicate a year-on-year decline across key consolidated financial metrics, including sales and various profit indicators.
- While the core CPA Solutions business experienced a revenue decline affecting overall profits, the company continues its upfront investments in the Strategic Business segment, which saw increased sales but expanded losses.
- Structural changes in the digital marketing market, such as shifts in user search behavior due to the proliferation of generative AI, are noted, suggesting that the company’s response to these environmental changes and the progress of its strategic business monetization will be worth monitoring.
5186|ニッタ
4615.0
▲ +0.44%
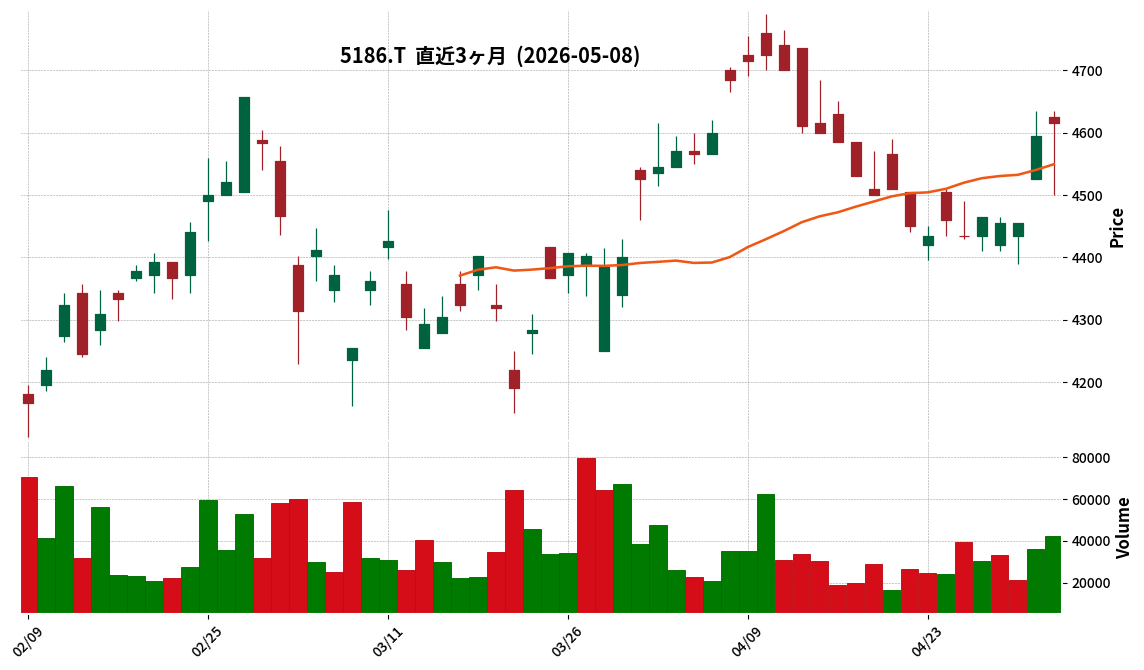
This article is an AI-generated summary and analysis of official IR disclosures.
📄 Announcement (AI-Reviewed)
- Nitta has decided on a year-end dividend of JPY 88.00 per share for the surplus dividend with a record date of March 31, 2026.
- This represents an increase of JPY 15 from the most recent dividend forecast of JPY 73.00, which was announced on May 9, 2025.
- Consequently, the annual dividend per share for the fiscal year ending March 2026 is projected to be JPY 160, including an interim dividend of JPY 72.
- This annual dividend of JPY 160 constitutes an increase of JPY 25 compared to the ordinary dividend of JPY 135 for the previous fiscal year (excluding the JPY 5 commemorative dividend for the company’s 140th anniversary).
- The dividend increase is based on the company’s policy to steadily increase dividends (by at least JPY 10 per share annually) during the mid-to-long-term management plan ‘SHIFT2030’ Phase 2 period (FY2024-FY2028), aiming for a consolidated payout ratio of 30% or more and a DOE (Dividend on Equity) of 2.5% or more.
🤖 AI Perspective
Nitta’s announced dividend increase appears to align with its stated shareholder return policy within its mid-to-long-term management plan. The guideline of a consolidated payout ratio of 30% or more and a DOE of 2.5% or more may suggest a consistent commitment to distributing profits to shareholders. The upward revision from the previous dividend forecast, based on current financial performance, financial condition, and future business development, could be seen as an indicator of the company’s strategic direction and its approach to shareholder returns.
5380|新東
1405.0
▼ -0.78%
This article is an AI-generated summary and analysis of official IR disclosures.
📄 Announcement (AI-Reviewed)
- For the third quarter accumulated period of fiscal year 2026 (July 1, 2025, to March 31, 2026), Shinto Co. reported net sales of JPY 3,180 million, representing a 9.6% decrease year-on-year.
- The company posted an operating loss of JPY 78 million (compared to JPY 68 million operating income in the prior year), an ordinary loss of JPY 70 million (compared to JPY 65 million ordinary income), and a net loss for the quarter of JPY 61 million (compared to JPY 46 million net income).
- The Tile Manufacturing and Sales Business recorded net sales of JPY 3,164 million (down JPY 353 million year-on-year) and an operating loss of JPY 89 million. The newly commenced Real Estate Leasing Business generated JPY 16 million in net sales and JPY 10 million in operating income.
- The full-year earnings forecast for fiscal year 2026, previously announced on February 9, 2026, has been withdrawn as of May 8, 2026, with the company stating it is difficult to provide numerical figures at this time. A new forecast will be disclosed when it becomes reasonably estimable.
- The forecast for the annual dividend for fiscal year 2026 remains unchanged from the most recently announced forecast, with a year-end dividend of JPY 37.50 per share, totaling JPY 37.50.
🤖 AI Perspective
Shinto’s Q3 results indicate that weakened demand in its core tile manufacturing and sales business, coupled with increased costs due to a weaker yen and higher material/energy prices, significantly impacted profitability, leading to losses across key income metrics. The company’s inability to fully pass on cost increases through sales prices appears to be a contributing factor. The withdrawal of the full-year earnings forecast suggests heightened uncertainty regarding future business conditions, making the eventual re-disclosure of guidance a key point for investors to monitor.
6470|大豊工業
1196.0
▼ -1.89%
This article is an AI-generated summary and analysis of official IR disclosures.
📄 Announcement (AI-Reviewed)
- On May 8, 2026, Taiho Kogyo Co. announced a correction to a part of its “Consolidated Financial Results for the Fiscal Year Ended March 2026 (Japanese GAAP).”
- The correction was necessitated by an inaccuracy in the stated dividend forecast for the fiscal year ending March 2027.
- Previously, the summary information on the cover page of the financial results report indicated a year-end dividend of “¥30” for the March 2027 fiscal year (forecast).
- The corrected statement clarifies that “¥30” represents the total annual dividend, comprising both interim and year-end dividends.
- The total annual dividend forecast of ¥30 for the fiscal year ending March 2027 remains unchanged.
- The specific breakdown of interim and year-end dividends is currently undecided and will be promptly disclosed once determined.
🤖 AI Perspective
This correction primarily addresses the internal allocation of the dividend forecast rather than the total annual amount, suggesting the immediate impact on investors may be minimal. However, the pending determination of interim and year-end dividend allocation could be a point of interest for investors monitoring future disclosures. Accuracy and clarity in financial reporting, particularly concerning dividend forecasts, are crucial for maintaining investor confidence and providing a complete picture of a company’s financial outlook.
7791|ドリームベッド
810.0
▲ +0.87%
📎 Source:ドリームベッド Official IR →
This article is an AI-generated summary and analysis of official IR disclosures.
📄 Announcement (AI-Reviewed)
- Dreambed Co., Ltd. reported non-consolidated financial results for the fiscal year ended March 31, 2026 (April 1, 2025 – March 31, 2026), with net sales of ¥12,174 million (+5.8% year-on-year), operating profit of ¥703 million (+18.1% year-on-year), ordinary profit of ¥686 million (+17.7% year-on-year), and net profit of ¥479 million (+15.6% year-on-year).
- The annual dividend for the fiscal year ended March 31, 2026, was announced as ¥36.00, comprising an interim dividend of ¥17.00 and a year-end dividend of ¥19.00. The year-end dividend includes a ¥2 commemorative dividend for the 75th anniversary of the company’s founding.
- The company forecasts net sales of ¥12,500 million (+2.7% year-on-year), operating profit of ¥740 million (+5.3% year-on-year), ordinary profit of ¥710 million (+3.5% year-on-year), and net profit of ¥490 million (+2.1% year-on-year) for the fiscal year ending March 31, 2027.
- As of the end of the current fiscal year, total assets stood at ¥11,513 million (+¥245 million year-on-year), net assets at ¥4,844 million (+¥336 million year-on-year), and the equity ratio improved to 42.1% (from 40.0% at the end of the previous fiscal year).
- The company launched its new brand “KING KOIL” in October 2025, with positive sales performance from POP-UP events at department stores and displays at major furniture retailers. Additionally, overseas OEM supply exports commenced to Indonesia and Malaysia, with trial exports to China also initiated.
🤖 AI Perspective
The reported increase in sales and profits for the fiscal year ended March 31, 2026, suggests the effectiveness of new brand introductions, expansion into international markets, and diversified sales channel strategies. The improvement in the equity ratio could indicate a strengthening of the company’s financial position. Investors may find further insights into the company’s future strategy and outlook from the medium-term management plan and detailed financial briefing materials scheduled for release on May 14, 2026.
Disclaimer: This article is for informational purposes only and does not constitute investment advice.
7963|興研
1956.0
▲ +2.52%
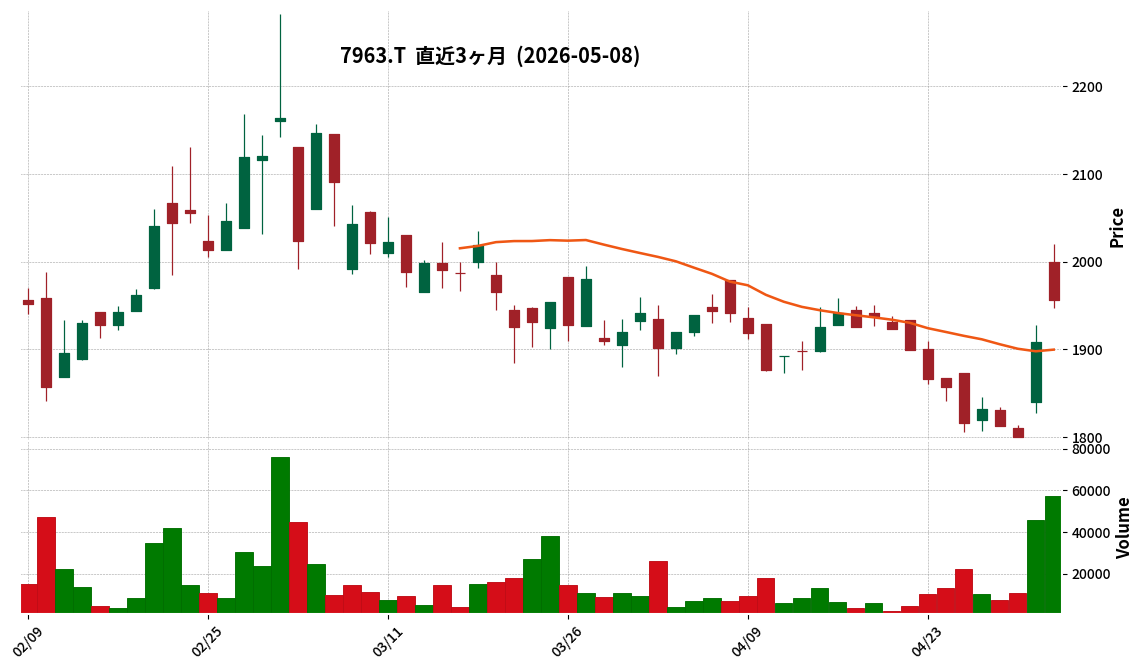
This article is an AI-generated summary and analysis of official IR disclosures.
📄 Announcement (AI-Reviewed)
- KOKEN Co., Ltd. announced its consolidated financial results for the first quarter of the fiscal year ending December 2026 (January 1, 2026 to March 31, 2026) on May 8, 2026.
- For the quarter, net sales were ¥2,819 million (down 0.4% year-on-year), operating profit was ¥249 million (down 31.6% year-on-year), ordinary profit was ¥247 million (down 32.9% year-on-year), and net profit attributable to owners of parent was ¥143 million (down 45.0% year-on-year).
- By segment, sales in the Mask-related business increased to ¥2,484 million (up 10.5% year-on-year), while sales in the Environment-related business significantly decreased to ¥209 million (down 59.1% year-on-year).
- As of March 31, 2026, total assets stood at ¥21,525 million, net assets at ¥13,653 million, and the equity ratio was 63.4%.
- The full-year consolidated performance forecast (net sales ¥12,200 million, operating profit ¥1,220 million, ordinary profit ¥1,150 million, net profit attributable to owners of parent ¥830 million) and the annual dividend forecast of ¥35.00 (year-end) remain unchanged from the most recently announced figures.
🤖 AI Perspective
Koken’s Q1 consolidated performance showed a slight decrease in sales and a substantial decline in profits compared to the previous year. This appears to be primarily driven by the timing of large-scale product deliveries in the Environment-related business, despite solid growth in the Mask-related segment. The unchanged full-year outlook suggests that the company anticipates a recovery in the Environment-related business performance towards the end of the fiscal year, which could be a point of interest for investors.
8864|空港施設
978.0
▼ -0.61%
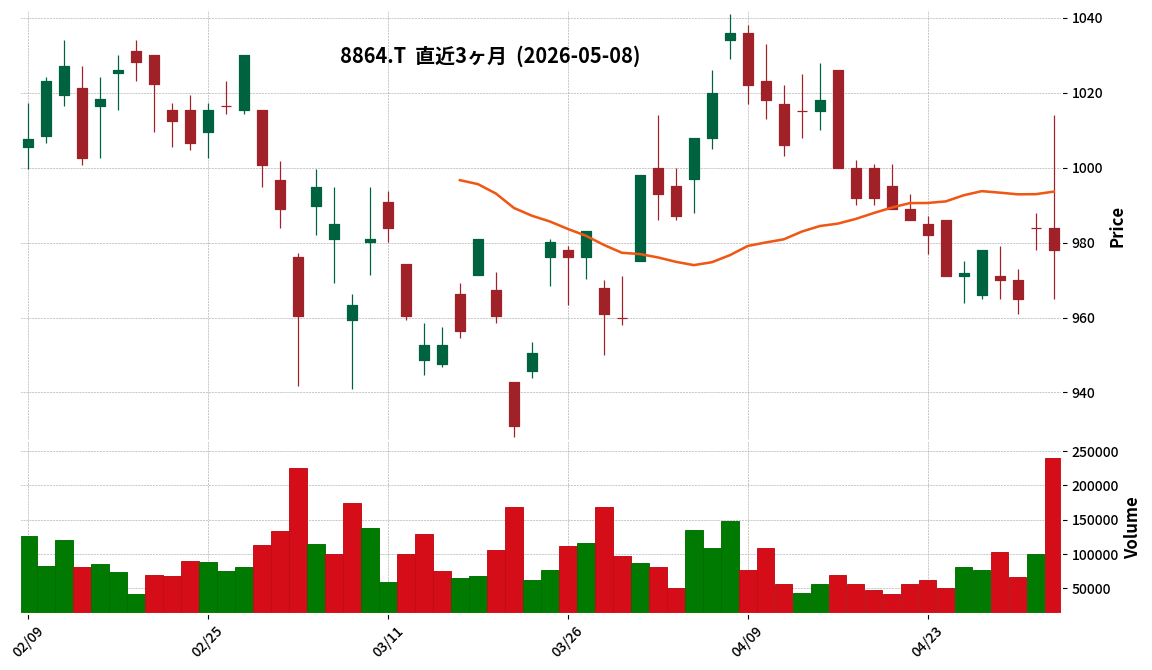
This article is an AI-generated summary and analysis of official IR disclosures.
📄 Announcement (AI-Reviewed)
- **Consolidated Financial Results:** For the fiscal year ended March 31, 2026, Airport Facilities Co., Ltd. reported consolidated net sales of JPY 36,792 million (up 18.2% year-on-year), operating profit of JPY 6,719 million (up 50.3%), ordinary profit of JPY 7,126 million (up 53.9%), and net profit attributable to owners of the parent of JPY 3,479 million (up 34.9%).
- **Dividend:** The annual dividend for FY2026 was JPY 42.00 per share, an increase of JPY 21.00 from the previous fiscal year. The forecast for FY2027 annual dividend is JPY 42.00 per share (JPY 21.00 interim, JPY 21.00 year-end).
- **Segment Contributions:** Performance was boosted by increased rental income in the airport real estate business, the sale of three office buildings and the formation of a private real estate fund in the non-airport real estate business, and revised basic rates for heat supply and increased water usage in the airport infrastructure business.
- **Extraordinary Losses:** An impairment loss was recorded as an extraordinary loss due to a review of building demolition costs in the Haneda Airport 1-chome area.
- **FY2027 Outlook:** The consolidated earnings forecast for the fiscal year ending March 31, 2027, projects net sales of JPY 39,300 million (up 6.8% year-on-year), operating profit of JPY 4,900 million (down 27.0%), ordinary profit of JPY 4,900 million (down 31.2%), and net profit attributable to owners of the parent of JPY 3,400 million (down 2.2%).
🤖 AI Perspective
- The significant increase in net sales and profits for FY2026 for Airport Facilities Co., Ltd. appears to be largely driven by the strong performance in non-airport real estate, including significant asset sales.
- The doubling of the annual dividend compared to the previous year could indicate a strengthened commitment to shareholder returns.
- However, the FY2027 forecast, while projecting revenue growth, also anticipates a decline in operating and ordinary profits, which may suggest a normalization after one-off gains or an expectation of rising operational costs worth monitoring.
9532|大瓦斯
5690.0
▼ -1.25%
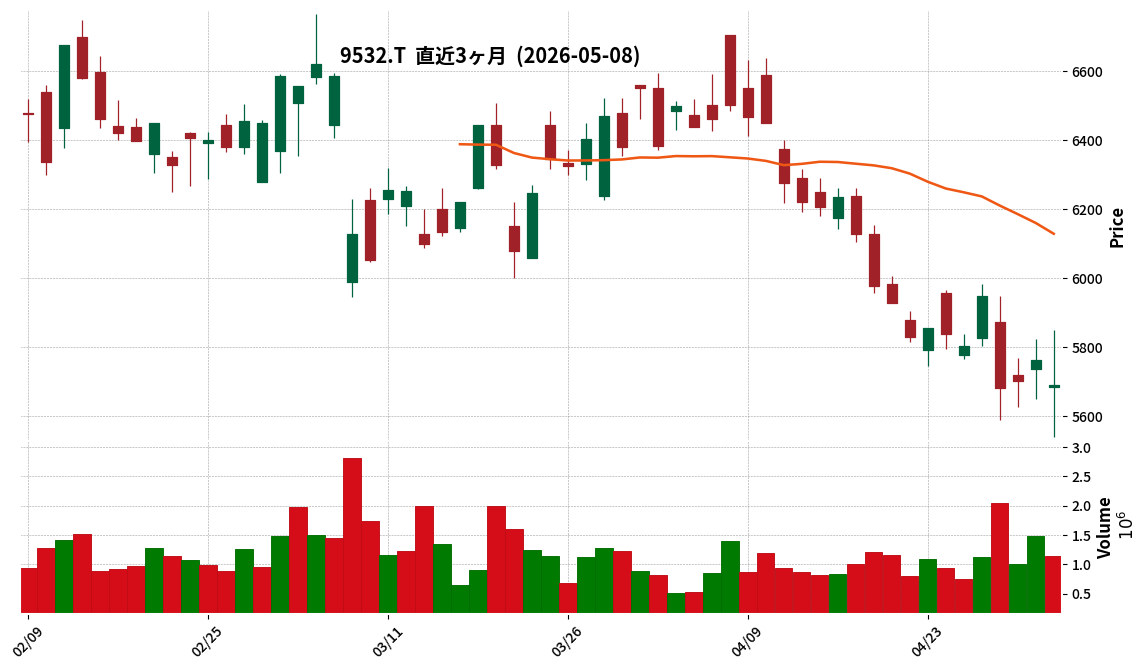
This article is an AI-generated summary and analysis of official IR disclosures.
📄 Announcement (AI-Reviewed)
- Osaka Gas reported consolidated profit attributable to owners of parent for the fiscal year ended March 31, 2026, reaching JPY 152.751 billion, marking a 13.6% increase compared to the previous fiscal year.
- Net sales were JPY 2,030.3 billion, a 1.9% decrease year-on-year. However, operating profit increased by 8.8% to JPY 174.809 billion, and ordinary profit rose by 7.8% to JPY 204.522 billion.
- Segment-wise, while the domestic energy business experienced a profit decrease, the overseas energy business, including the Freeport LNG terminal and upstream projects in the U.S., contributed to increased profits.
- The annual dividend for FY2026 was set at JPY 120.00 per share (JPY 60.00 interim, JPY 60.00 year-end), representing an increase of JPY 25 from the prior year.
- For the fiscal year ending March 31, 2027, the company forecasts consolidated profit attributable to owners of parent to be JPY 145.0 billion (a 5.1% decrease year-on-year), while planning an annual dividend of JPY 130.00 per share (JPY 65.00 interim, JPY 65.00 year-end).
🤖 AI Perspective
The FY2026 results suggest that robust overseas operations effectively offset a decline in the domestic energy business, contributing to an overall increase in consolidated net profit. The consecutive dividend increases for two fiscal years could indicate the company’s commitment to shareholder returns. However, the projected decrease in consolidated profit for FY2027 suggests future business dynamics may warrant close observation.
6929|日セラミック
3750.0
▲ +0.67%
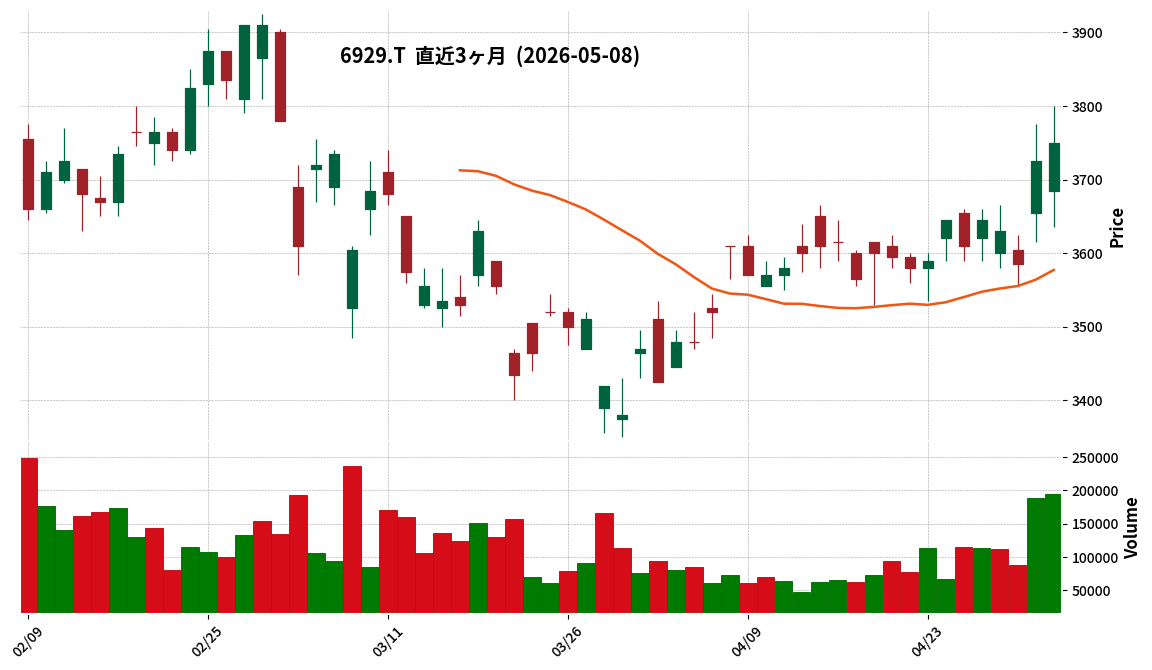
This article is an AI-generated summary and analysis of official IR disclosures.
📄 Announcement (AI-Reviewed)
- Nicera Co., Ltd. announced its consolidated financial results for the first quarter of the fiscal year ending December 2026 (January 1, 2026, to March 31, 2026).
- Consolidated net sales were ¥6,566 million, a 1.1% decrease year-on-year. However, operating profit increased by 5.7% to ¥1,597 million, ordinary profit rose by 25.3% to ¥1,838 million, and net profit attributable to owners of parent grew by 22.7% to ¥1,325 million.
- Factors contributing to the profit increase include robust sales of ADAS-related in-vehicle safety products and security-related products, continuous cost reductions, selection and concentration of businesses and projects, and the recording of foreign exchange gains.
- The consolidated full-year earnings forecast for the fiscal year ending December 2026 and the annual dividend forecast (¥165.00 for the year-end) remain unchanged from the most recently published figures.
- The equity ratio at the end of the first consolidated accounting period was 85.4%.
🤖 AI Perspective
Despite a decrease in net sales, the increase in all profit categories (operating, ordinary, and net profit) is noteworthy. This may suggest that a shift in product mix, along with continuous cost reduction efforts, strategic business focus, and foreign exchange gains, effectively contributed to improved profitability. The company maintains a high equity ratio, which could indicate a strong financial position. The unchanged full-year forecast suggests management believes performance is progressing in line with their current plan.
6327|北川精機
3575.0
▲ +5.77%
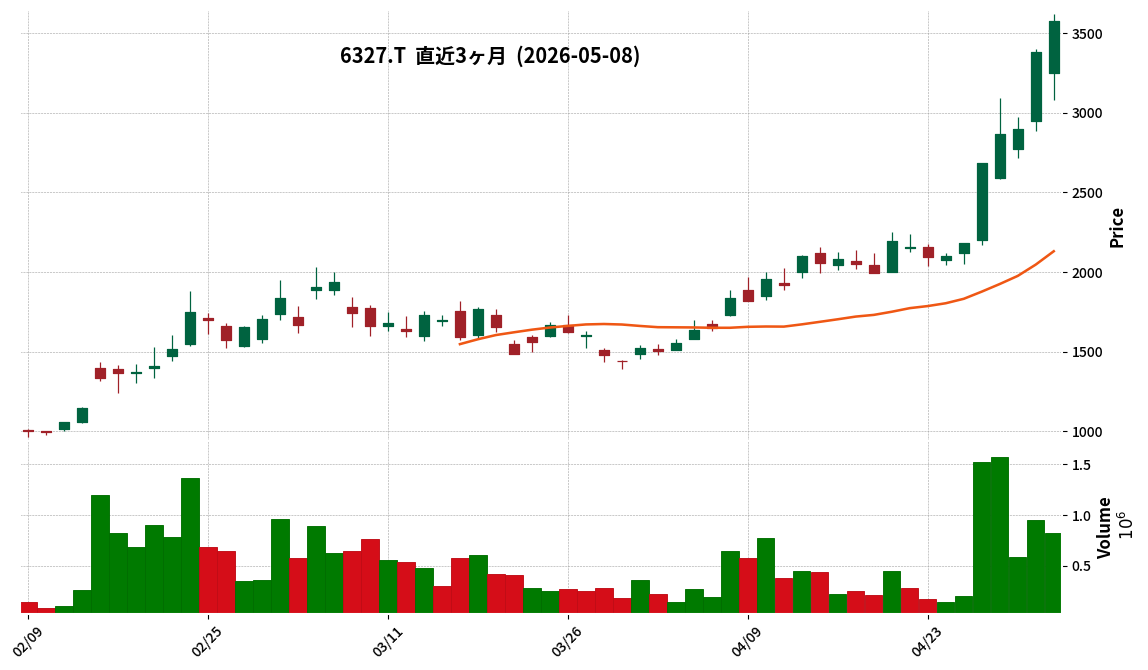
This article is an AI-generated summary and analysis of official IR disclosures.
📄 Announcement (AI-Reviewed)
- Kitagawa Seiki Co., Ltd. announced its consolidated financial results for the third quarter of the fiscal year ending June 2026 (July 1, 2025 – March 31, 2026).
- During this period, sales reached ¥4,155 million (up 12.7% year-on-year), operating profit was ¥682 million (up 53.9% year-on-year), ordinary profit was ¥751 million (up 78.9% year-on-year), and net profit attributable to owners of parent was ¥522 million (up 80.6% year-on-year).
- By segment, the industrial machinery business recorded sales of ¥4,068 million (up 13.7% year-on-year) and operating profit of ¥681 million (up 54.6% year-on-year).
- As of March 31, 2026, total assets stood at ¥10,291 million, net assets at ¥5,653 million, and the equity ratio was 54.9%.
- The consolidated full-year earnings forecast for the fiscal year ending June 2026 and the dividend forecast (¥14.00 per share at fiscal year-end) remain unchanged from those announced on January 22, 2026.
🤖 AI Perspective
The strong performance this quarter appears to be driven by significant improvements in sales and profitability within the core industrial machinery business. The increase in work-in-progress and contract liabilities could suggest a healthy backlog of orders that may contribute to future revenues. With the full-year earnings forecast remaining unchanged, the focus for investors may be on the likelihood of achieving these annual targets based on the current progress.
1382|ホーブ
1602.0
▼ -1.29%
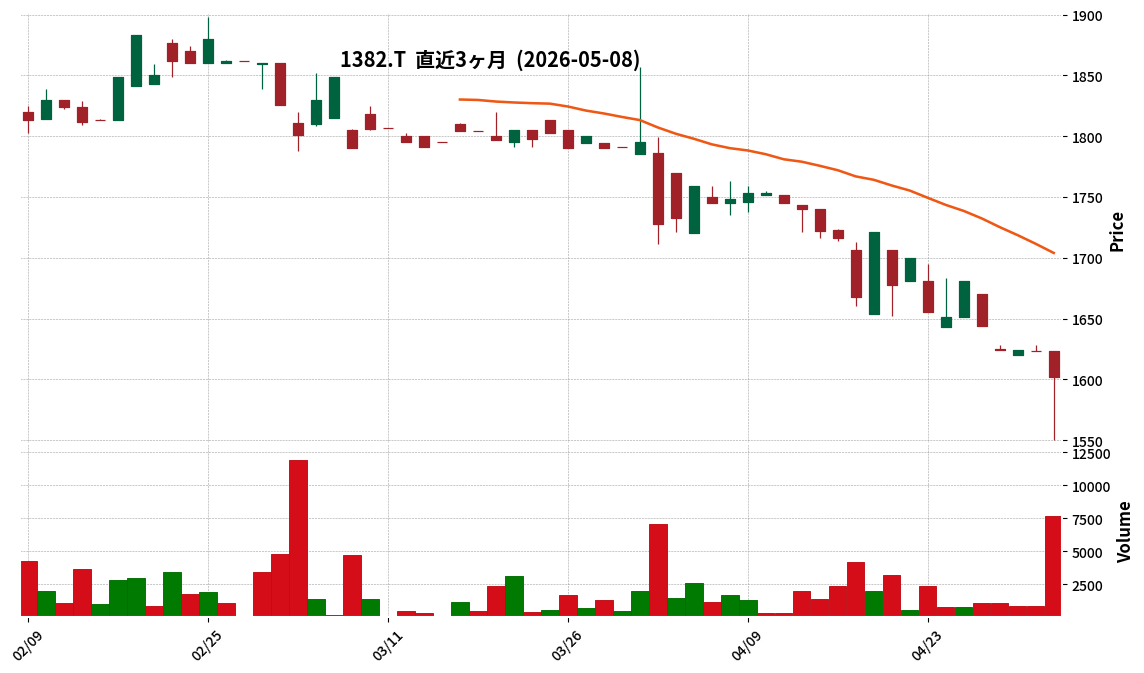
This article is an AI-generated summary and analysis of official IR disclosures.
📄 Announcement (AI-Reviewed)
- Hob Co., Ltd. announced its consolidated financial results for the third quarter of the fiscal year ending June 2026 (July 1, 2025, to March 31, 2026).
- Consolidated results show net sales of ¥2,001 million (down 1.9% year-on-year), operating profit of ¥13 million (down 79.2%), ordinary profit of ¥16 million (down 74.2%), and profit attributable to owners of parent of ¥8 million (down 79.7%).
- The core strawberry fruit and produce business reported net sales of ¥1,771 million (down 3.0%) and operating profit of ¥113 million (down 25.5%), primarily due to reduced shipments and quality degradation from high temperatures, scarcity of commercial strawberries, and decreased transaction volumes from major clients.
- The seedling business achieved increased sales and profits, with net sales of ¥43 million (up 11.4%) and operating profit of ¥15 million (up 90.6%), driven by an increase in seedling sales and revenue from cultivation guidance services.
- The consolidated full-year forecast for the fiscal year ending June 2026 remains unchanged from the most recently announced figures: net sales of ¥2,482 million, operating profit of ¥24 million, ordinary profit of ¥27 million, and profit attributable to owners of parent of ¥18 million.
🤖 AI Perspective
The significant decline in profitability within the strawberry fruit and produce segment, mainly attributed to climate-related issues and market conditions, contrasts with the strong growth in the seedling business. The unchanged full-year consolidated outlook may suggest that the company anticipates a recovery in the final quarter or that the current performance is already factored into their projections. Investors may wish to monitor the progress of strategic initiatives aimed at improving profitability across the diverse business segments.
Disclaimer: This article is for informational purposes only and does not constitute investment advice.
151A|G-ダイブ
655.0
▲ +1.55%
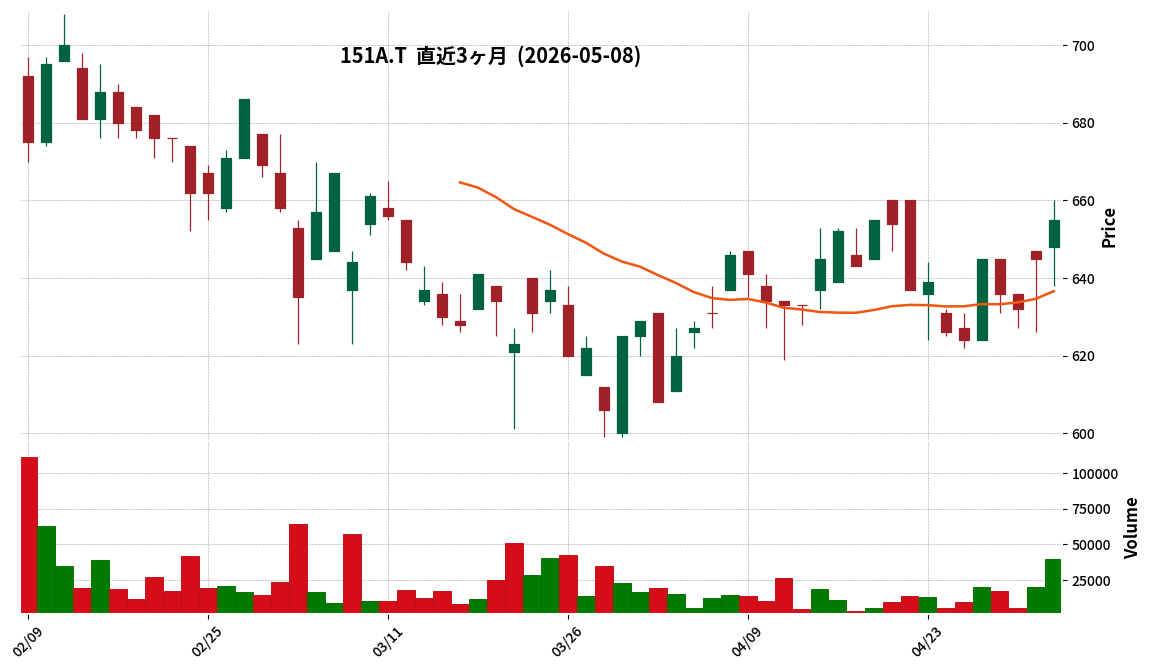
This article is an AI-generated summary and analysis of official IR disclosures.
📄 Announcement (AI-Reviewed)
- G-DIVE Inc. announced its Q3 FY2026 (cumulative) financial results on May 8, 2026.
- For the cumulative period of the third quarter (July 1, 2025 – March 31, 2026), consolidated results showed net sales of ¥11,619 million (up 10.0% year-on-year), operating profit of ¥758 million (up 7.6% YoY), ordinary profit of ¥768 million (up 7.5% YoY), and quarterly net profit of ¥494 million (up 3.6% YoY).
- By segment, the Tourism HR business reported net sales of ¥10,951 million (up 10.3% YoY) and segment profit of ¥1,117 million (up 5.9% YoY), with the number of placed workers reaching 13,225 (up 9.4% YoY). The Regional Revitalization business recorded net sales of ¥665 million (up 7.2% YoY) and segment profit of ¥58 million (up 61.2% YoY).
- As of the end of the third quarter, total assets stood at ¥4,952 million, net assets at ¥2,703 million, and the equity ratio was 54.4%.
- The full-year earnings forecast for FY2026 remains unchanged, projecting net sales of ¥16,000 million, operating profit of ¥800 million, ordinary profit of ¥797 million, and net profit of ¥540 million.
🤖 AI Perspective
G-DIVE’s Q3 results indicate that its core Tourism HR business is performing robustly, supported by high levels of inbound tourist numbers and consumption, leading to increases in placed workers and specified skilled worker support. The Regional Revitalization segment also demonstrated significant improvement in profitability, suggesting balanced growth across both segments. The unchanged full-year earnings forecast may imply that the company considers the current progress to be in line with its expectations.
2693|YKT
251.0
▲ +1.62%
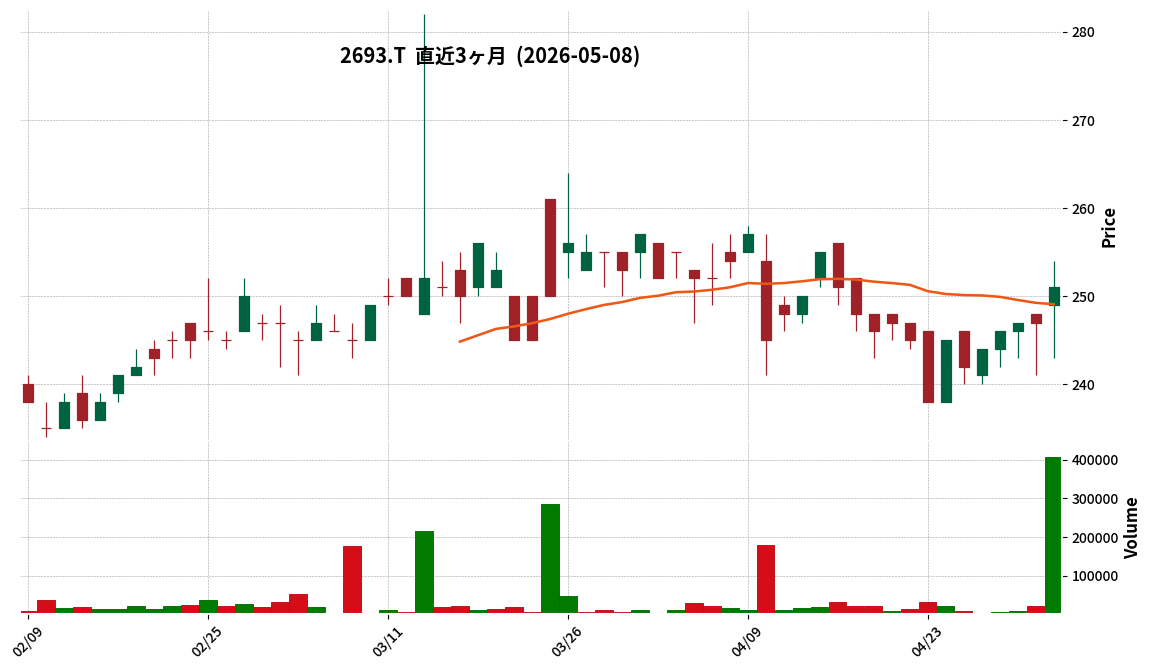
This article is an AI-generated summary and analysis of official IR disclosures.
📄 Announcement (AI-Reviewed)
- For the first quarter of the fiscal year ending December 2026 (January 1 to March 31, 2026), consolidated net sales reached JPY 5.588 billion, marking a significant increase of 172.0% year-on-year.
- Consolidated profits for the period improved, with operating income at JPY 210 million, ordinary income at JPY 283 million, and net income attributable to owners of the parent at JPY 192 million, all turning positive from losses in the previous year.
- In the “Electronic Equipment and Machine Tools, etc.” segment, sales surged by 195.6% year-on-year to JPY 5.41 billion, generating an operating income of JPY 188 million. This growth was primarily attributed to a substantial increase in electronic component mounting machine sales in the Chinese market.
- As of March 31, 2026, the consolidated equity ratio improved to 50.6% from 46.5% at the end of the previous fiscal year.
- The consolidated full-year earnings forecast for the fiscal year ending December 2026 and the annual dividend forecast (JPY 5.00 at year-end) remain unchanged from the figures announced on February 13, 2026.
🤖 AI Perspective
- YKT’s first-quarter results are notably characterized by significant sales growth and a return to profitability across all key metrics. This performance appears to be primarily driven by robust capital investment demand for electronic component mounting machines in the Chinese market.
- However, the company has expressed concerns regarding the outlook for the second quarter and beyond, citing potential component shortages for electronic equipment sales and a challenging order environment for imported machinery due to the yen’s depreciation, suggesting that future sales conditions will be key to monitor.
- The improvement in the equity ratio could be seen as an indicator of strengthened financial stability.
2790|ナフコ
2178.0
▼ -0.95%
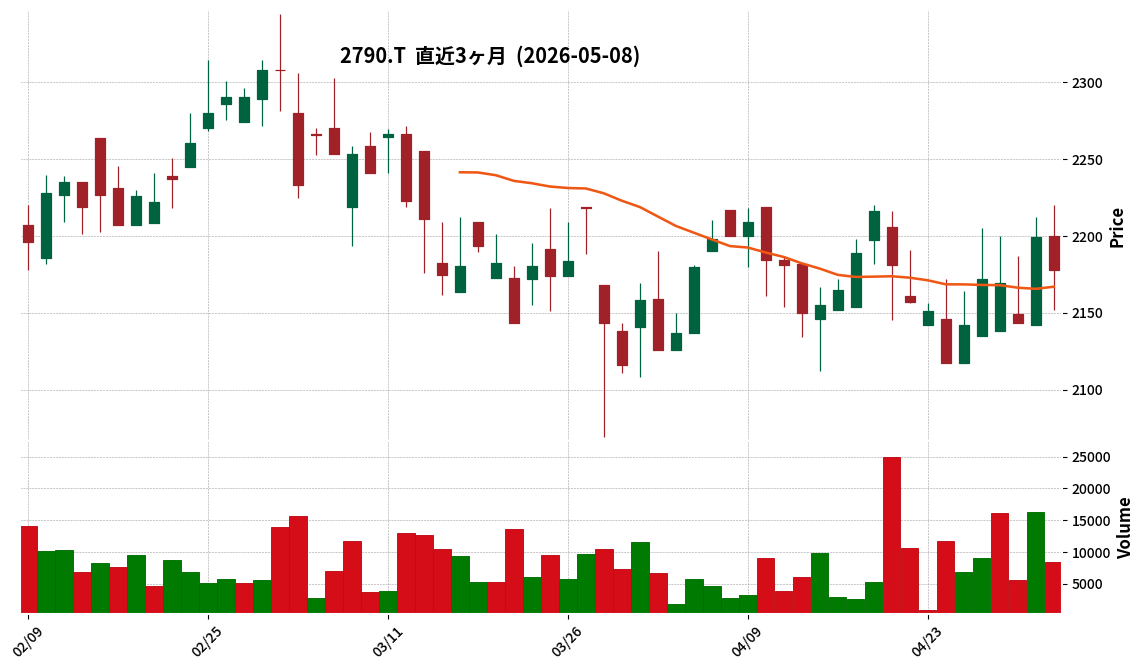
This article is an AI-generated summary and analysis of official IR disclosures.
📄 Announcement (AI-Reviewed)
- Nafco Co., Ltd. has announced its full-year financial results (non-consolidated) for the fiscal year ended March 2026.
- For FY2026/3, operating revenue was JPY 175,272 million (down 3.6% year-on-year), while operating profit increased to JPY 1,636 million (up 29.2%), ordinary profit to JPY 1,488 million (up 11.9%), and net profit to JPY 223 million (up 21.6%).
- The annual dividend for FY2026/3 will be maintained at JPY 58.00 per share.
- For FY2027/3, the company forecasts operating revenue of JPY 180,770 million (up 3.1% year-on-year), operating profit of JPY 2,930 million (up 79.1%), ordinary profit of JPY 3,030 million (up 103.7%), and net profit of JPY 1,270 million (up 467.9%).
- As of the end of the fiscal year, the number of stores stood at 359 across 34 prefectures, following the opening of 2 new stores and the closing of 3 stores.
🤖 AI Perspective
Despite a decrease in revenue for FY2026/3, the significant increase in operating and net profits suggests the positive impact of cost reduction efforts, particularly in logistics and delivery. The substantial projected growth in both revenue and profits for FY2027/3 could indicate an optimistic outlook for the company’s future performance. Maintaining the annual dividend may be viewed as a continuation of its commitment to shareholder returns.
2914|JT
5769.0
▼ -2.83%
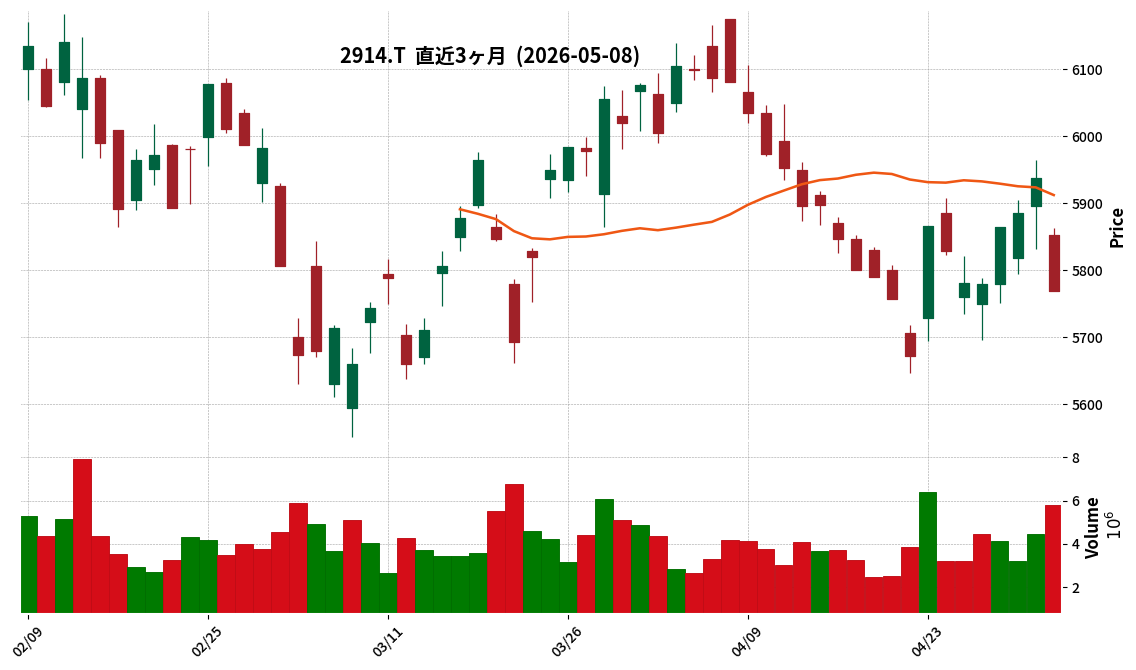
This article is an AI-generated summary and analysis of official IR disclosures.
📄 Announcement (AI-Reviewed)
- Japan Tobacco Inc. (JT) announced its consolidated financial results for the first quarter of the fiscal year ending December 2026 (January 1, 2026 – March 31, 2026).
- Consolidated revenue reached ¥923,963 million, marking a 15.2% increase compared to the same period of the previous year.
- Consolidated operating profit increased by 24.7% to ¥304,554 million, and profit attributable to owners of the parent grew by 25.1% to ¥197,041 million.
- The full-year consolidated earnings forecast for the fiscal year ending December 2026 remains unchanged, projecting revenue of ¥3,697,000 million (up 6.6% year-on-year) and operating profit of ¥921,000 million (up 6.2% year-on-year).
- The annual dividend forecast for the fiscal year ending December 2026 is ¥242.00 (interim ¥121.00, year-end ¥121.00), with no revisions from the latest forecast. This dividend is calculated based on a payout ratio of 75.2% of adjusted profit for the period (¥571.0 billion), after accounting for the settlement payment related to the Canadian litigation.
🤖 AI Perspective
JT’s Q1 FY2026 results show double-digit growth across key profit metrics, which could be seen as a solid start to the fiscal year. The unrevised full-year earnings and annual dividend forecasts may suggest that the company is progressing in line with its current expectations. With the pharmaceutical business now classified as a discontinued operation, the focus for investors might increasingly shift towards the performance of the core tobacco business.
3238|セントラル総
363.0
▲ +1.11%
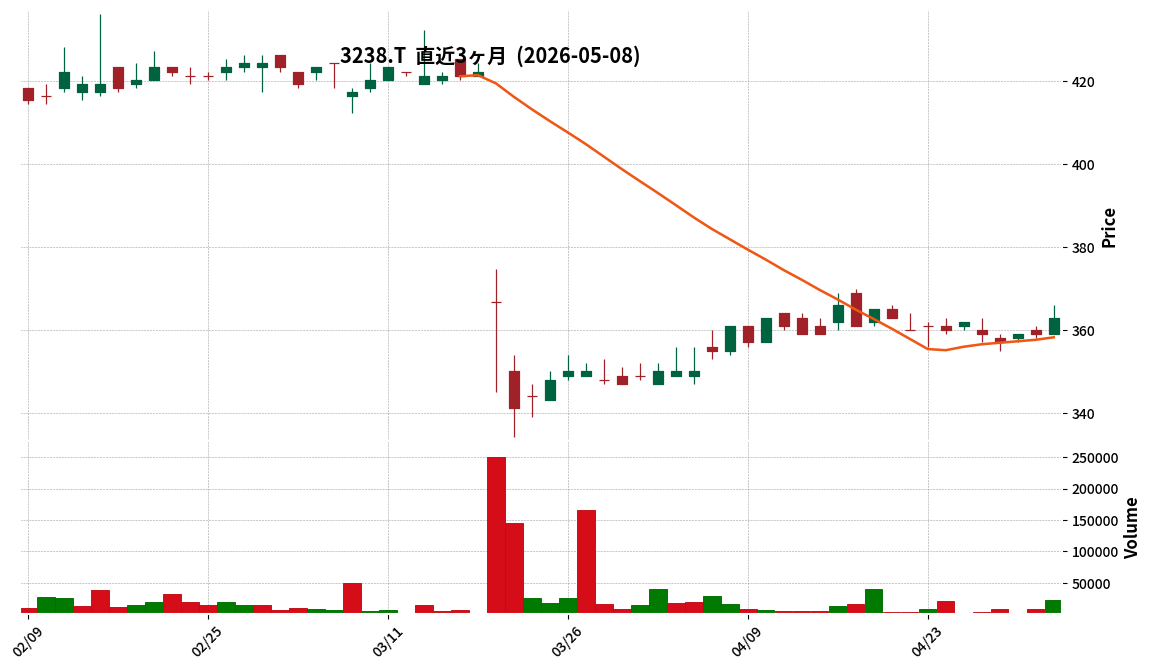
This article is an AI-generated summary and analysis of official IR disclosures.
📄 Announcement (AI-Reviewed)
- Central General Development reported consolidated net sales of ¥38,450 million for the fiscal year ended March 2026, an increase of 24.5% compared to the previous fiscal year.
- However, operating profit decreased by 27.8% to ¥898 million, ordinary profit fell by 60.3% to ¥304 million, and profit attributable to owners of parent declined by 70.3% to ¥147 million.
- During the fiscal year, 18 newly built condominium projects (15 in regional areas and 3 in the Tokyo metropolitan area) were completed and handed over, with 4 projects marking entry into new cities. Factors such as soaring construction costs, rising selling prices, and cautious customer sentiment regarding home purchases led to fewer handovers than planned.
- The year-end dividend for the fiscal year ended March 2026 was set at ¥5 per share (compared to ¥14 in the previous fiscal year).
- For the fiscal year ending March 2027, the company forecasts consolidated net sales of ¥45,000 million (up 17.0%), operating profit of ¥1,350 million (up 50.2%), and profit attributable to owners of parent of ¥400 million (up 171.0%), with a projected year-end dividend of ¥13 per share.
🤖 AI Perspective
For the fiscal year ended March 2026, despite an increase in net sales driven by a higher number of new condominium project handovers, profits decreased, which may suggest the impact of rising construction costs and cautious customer sentiment. The company’s forecast for the fiscal year ending March 2027 indicates significant growth in both sales and profits, which could suggest an expectation of improved market conditions or effective sales strategies. The projected increase in the year-end dividend for the upcoming fiscal year, following a reduction in the current period, is also worth monitoring for investors.
3252|地主
3285.0
▼ -1.65%
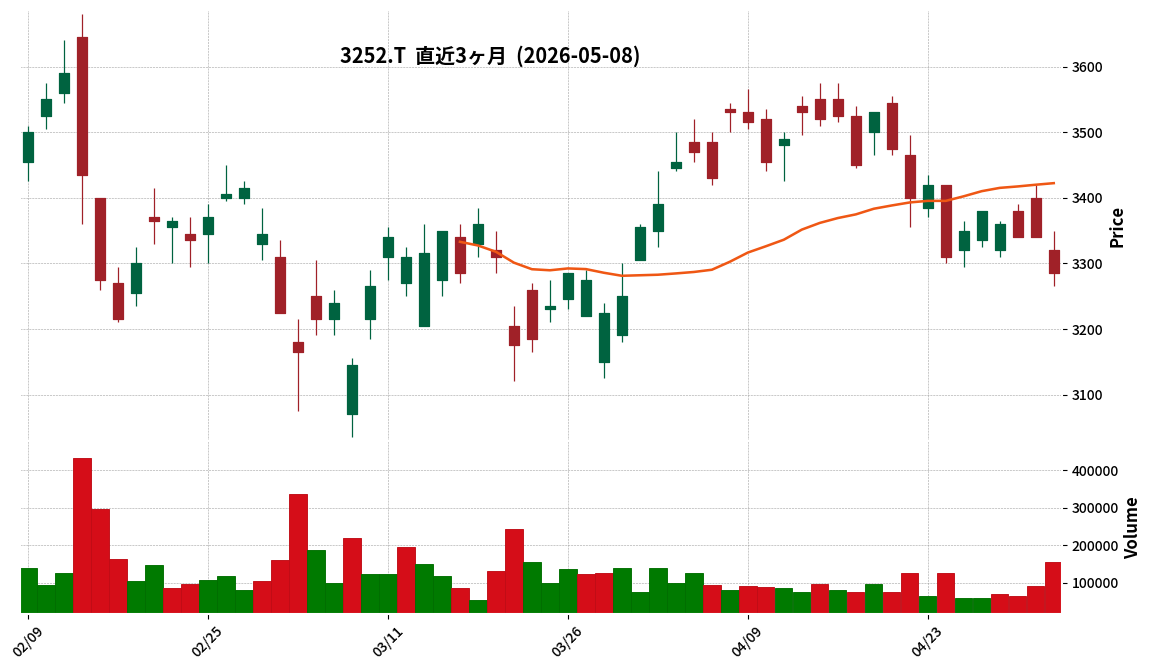
This article is an AI-generated summary and analysis of official IR disclosures.
📄 Announcement (AI-Reviewed)
- For the first quarter of the fiscal year ending December 2026 (January 1, 2026 – March 31, 2026), consolidated net sales were JPY 14,568 million (down 52.3% year-on-year), operating income was JPY 1,729 million (down 41.3% year-on-year), and net income attributable to owners of parent was JPY 876 million (down 51.6% year-on-year).
- The consolidated full-year forecast for FY2026 remains unchanged, projecting net sales of JPY 100,000 million (up 31.0% year-on-year) and net income attributable to owners of parent of JPY 8,000 million (up 8.6% year-on-year).
- The projected annual dividend for FY2026 is JPY 130.00 per share (interim JPY 65.00, year-end JPY 65.00), with no revisions from the most recently announced forecast.
- Acquisitions (contract basis) during the first quarter cumulative period amounted to JPY 27.8 billion (an increase of JPY 14.9 billion compared to the previous year).
- The asset size of Jinushi Private REIT Investment Corporation (Jinushi REIT) reached JPY 291.1 billion (based on appraised value at acquisition) following its 10th capital increase in January 2026, with the medium-term target of JPY 300 billion expected to be achieved within FY2026.
🤖 AI Perspective
While the first quarter saw a decline in both revenue and profit compared to the previous year, the company stated that it expects to record profits mainly in the fourth quarter, indicating progress as planned towards achieving its full-year net income target of JPY 8.0 billion. The significant increase in new acquisitions and the expansion of Jinushi REIT’s asset base may suggest ongoing strategic investments aimed at future growth. Given the business model’s tendency to concentrate profits in later quarters, assessing the initial quarter’s performance against the full-year plan appears to be a key consideration for investors.
3286|トラストHD
1065.0
▼ -3.18%
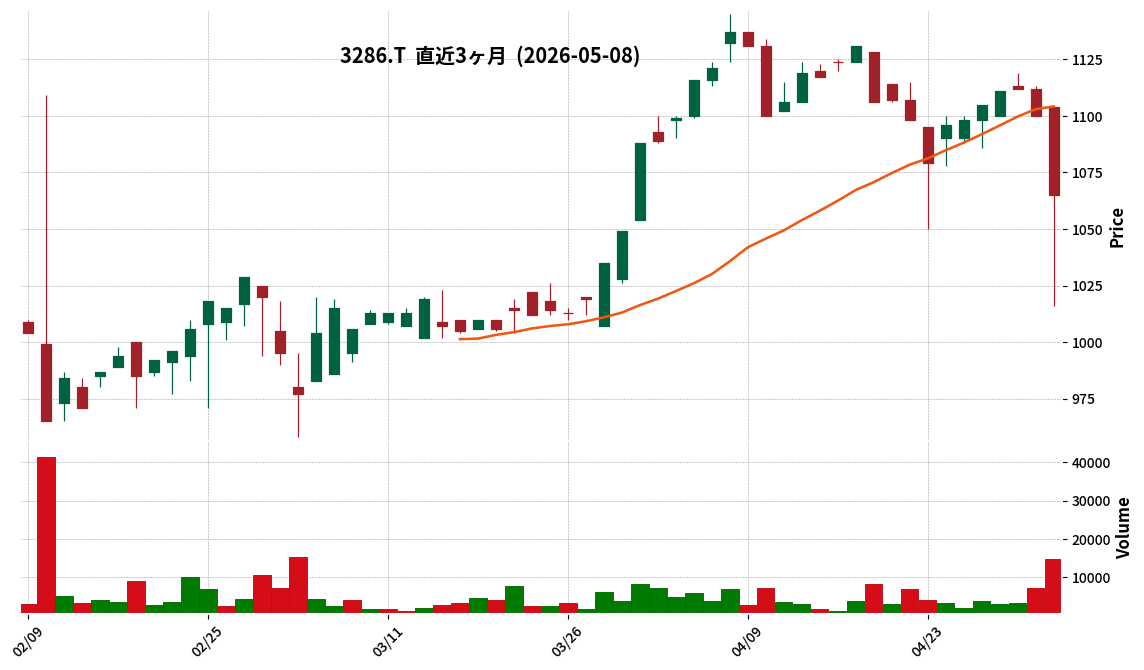
This article is an AI-generated summary and analysis of official IR disclosures.
📄 Announcement (AI-Reviewed)
- Trust Holdings reported for the nine months ended March 31, 2026 (Q3 FY2026) consolidated net sales of ¥7.346 billion (down 17.3% year-on-year), an operating loss of ¥60 million (compared to a profit of ¥216 million in the prior year), an ordinary loss of ¥135 million (compared to a profit of ¥147 million), and a net loss attributable to owners of parent of ¥102 million (compared to a profit of ¥56 million).
- The company announced a revision to its full-year consolidated earnings forecast for FY2026, projecting net sales of ¥11.900 billion (down 15.0% year-on-year), an operating loss of ¥470 million, an ordinary loss of ¥580 million, and a net loss attributable to owners of parent of ¥690 million.
- As of the end of the third quarter, consolidated total assets stood at ¥10.515 billion, net assets at ¥1.060 billion, and the equity ratio at 10.1%.
- In the segment breakdown, the Real Estate Business recorded net sales of ¥470 million (down 76.0% year-on-year) and an operating loss of ¥280 million (compared to an operating profit of ¥6 million in the prior year).
- The Parking Business generated net sales of ¥5.274 billion (down 1.5% year-on-year) and operating profit of ¥205 million (down 6.8%), while the Small-Lot Parking Investment Business achieved net sales of ¥367 million (up 21.1%) and operating profit of ¥18 million (up 42.3%).
🤖 AI Perspective
The third-quarter results show a significant decline in revenue and a shift to losses across key profit metrics compared to the previous year. The substantial decrease in sales and the recorded loss within the Real Estate Business appear to be a major factor influencing the overall performance. Conversely, the Parking Business maintained profitability, and the Small-Lot Parking Investment Business achieved increased revenue and profit, suggesting varying performance across the company’s diverse portfolio that will be worth monitoring.
3302|帝繊維
2839.0
▲ +0.39%
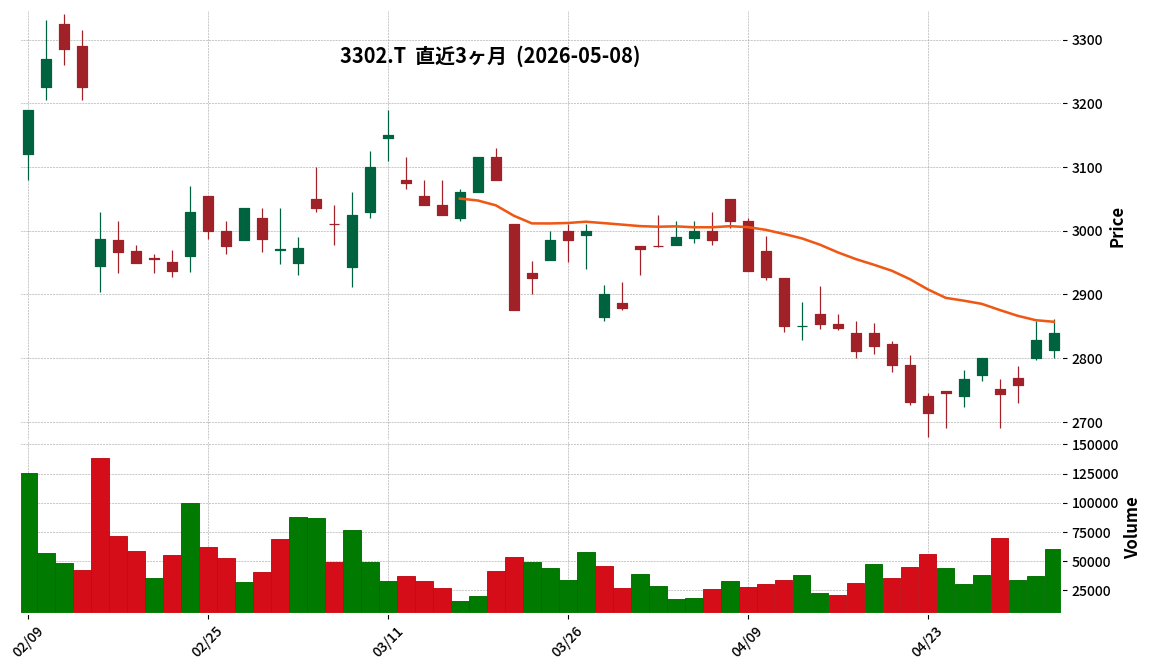
This article is an AI-generated summary and analysis of official IR disclosures.
📄 Announcement (AI-Reviewed)
- Teisen Co., Ltd. announced its consolidated financial results for the first quarter of the fiscal year ending December 2026 (January 1, 2026 to March 31, 2026) on May 8, 2026.
- For the quarter, consolidated net sales were JPY 19,765 million (up 29.0% year-on-year), operating profit was JPY 4,068 million (up 41.2% year-on-year), ordinary profit was JPY 4,694 million (up 37.1% year-on-year), and profit attributable to owners of parent was JPY 3,257 million (up 34.9% year-on-year). Basic earnings per share were JPY 127.15.
- By segment, the Disaster Prevention & Security business recorded sales of JPY 18,679 million, driven by increased sales of disaster relief vehicles such as rescue vehicles, rescue equipment, water supply/drainage systems for local governments, large-diameter hoses for critical energy facilities, and airport security equipment.
- The Textile business reported sales of JPY 944 million, primarily due to a large order for fire-protective clothing for the Vietnam fire department, and also noted development of fire extinguishing equipment for mobile battery fires.
- The consolidated full-year earnings forecast for the fiscal year ending December 2026 and the year-end dividend forecast (JPY 65.00) remain unchanged from the most recently announced figures.
🤖 AI Perspective
Teisen’s Q1 FY2026 results show a significant increase in sales and all profit categories compared to the prior year, suggesting robust operational performance. The growth appears to be largely driven by the strong demand across a diverse range of products and services within the Disaster Prevention & Security segment. Furthermore, the Textile business’s success in securing a large international order could indicate a promising development for the company’s expansion into overseas markets.
3712|情報企画
1039.0
▼ -0.38%
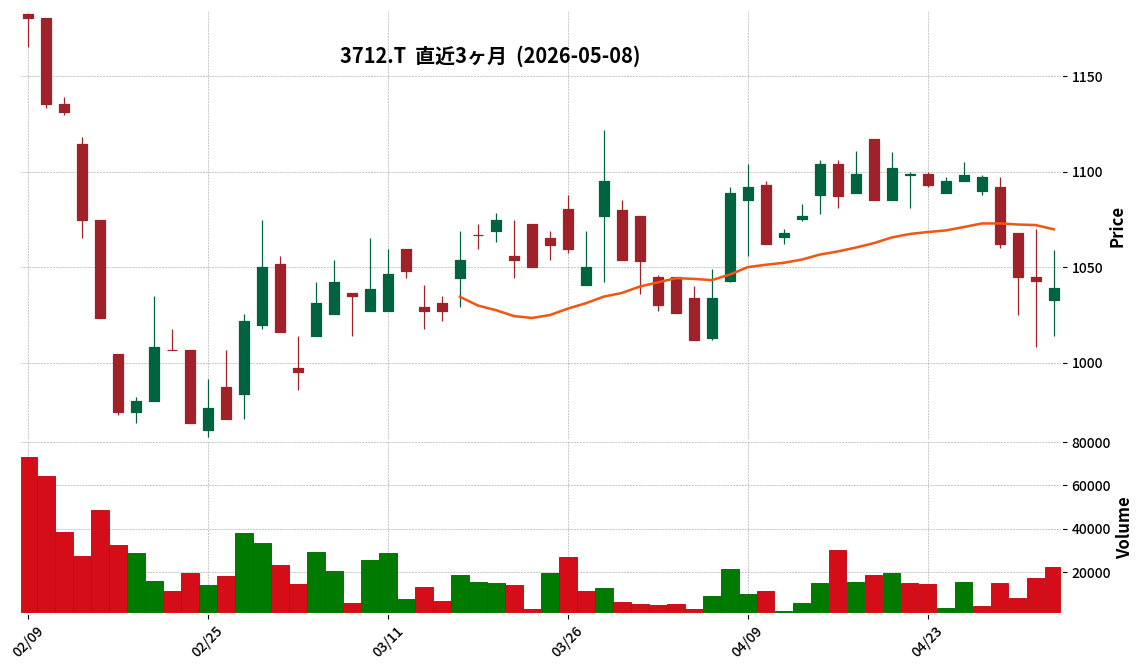
This article is an AI-generated summary and analysis of official IR disclosures.
📄 Announcement (AI-Reviewed)
- Johokikaku announced its consolidated financial results for the second quarter (interim period) of the fiscal year ending September 2026 on May 8, 2026.
- For the interim period, consolidated net sales were JPY 2,193 million (up 14.5% year-on-year), operating profit was JPY 911 million (up 14.8%), ordinary profit was JPY 916 million (up 15.4%), and net income attributable to owners of the parent was JPY 660 million (up 19.7%).
- As of the end of the interim period, consolidated total assets amounted to JPY 8,554 million, net assets to JPY 7,430 million, and the equity ratio improved to 86.9% (from 82.6% at the end of the previous fiscal year).
- The company conducted a 1-for-5 stock split on April 1, 2026. As a result, interim net income per share was JPY 43.65, and the full-year net income per share forecast is JPY 72.73 (both adjusted for the stock split).
- The full-year consolidated earnings forecast remains unchanged, projecting net sales of JPY 4,100 million (up 6.7% year-on-year) and net income attributable to owners of the parent of JPY 1,100 million (up 2.1% year-on-year).
🤖 AI Perspective
Johokikaku’s Q2 FY2026 results show significant growth across sales and all profit categories compared to the prior interim period. This performance appears to be driven by strong contributions from both the System Integration and System Support segments, as well as the Real Estate Leasing business. The improvement in the equity ratio to 86.9% could suggest a strengthening of the company’s financial stability, which may be a key point of interest for investors.
4769|IC
1064.0
▼ -1.75%
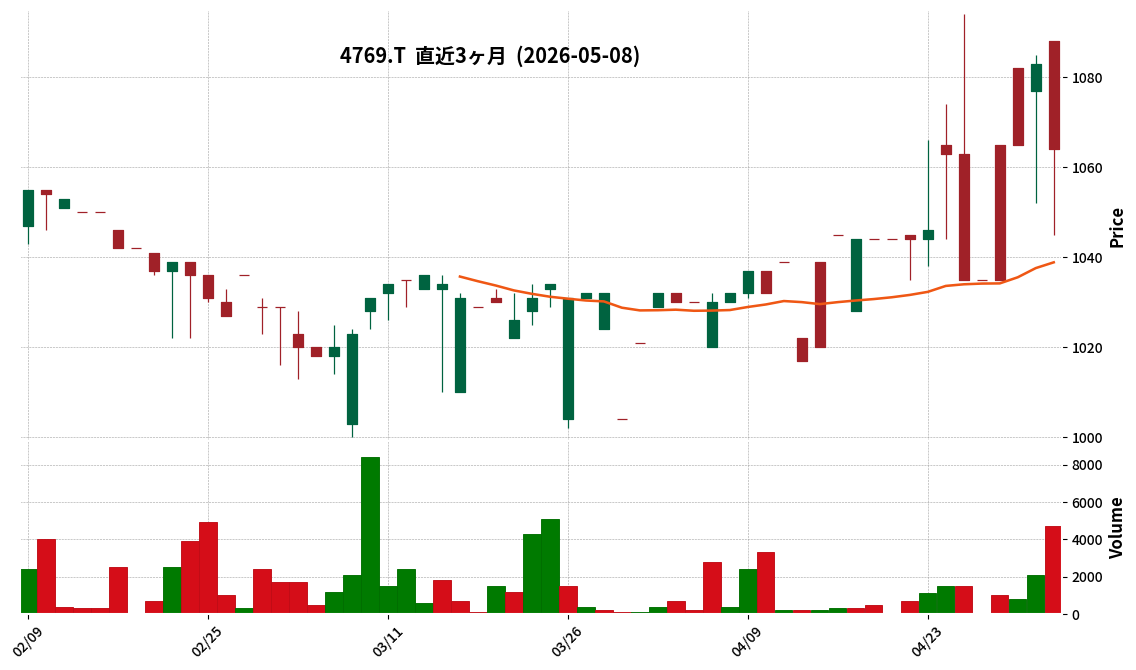
This article is an AI-generated summary and analysis of official IR disclosures.
📄 Announcement (AI-Reviewed)
- IC Co., Ltd. announced its consolidated financial results for the second quarter of the fiscal year ending September 2026.
- For the interim period, consolidated net sales reached ¥5,305 million (up 7.3% year-on-year), operating profit was ¥543 million (up 18.5% year-on-year), and ordinary profit stood at ¥574 million (up 18.3% year-on-year).
- Net profit attributable to owners of the parent company decreased by 20.1% year-on-year to ¥357 million. This decline was primarily due to the absence of a special gain recorded in the previous interim consolidated accounting period related to a change in the retirement benefit plan.
- The consolidated full-year forecast for the fiscal year ending September 2026 remains unchanged from the most recently published forecast: net sales of ¥10,558 million, operating profit of ¥560 million, ordinary profit of ¥628 million, and net profit attributable to owners of the parent company of ¥379 million.
- The consolidated equity ratio for the interim period improved to 75.6% (from 73.9% at the end of the previous fiscal year). The projected annual dividend is maintained at ¥40.00.
🤖 AI Perspective
IC’s announcement shows year-on-year increases in net sales, operating profit, and ordinary profit, which may indicate robust performance in its core business operations. The decrease in net profit attributable to owners is attributed to the absence of a special gain from the previous year’s corresponding period, with the company stating that core business profitability remains strong. The decision to maintain the full-year forecast could suggest that the company anticipates its business environment and strategic initiatives will progress as initially projected.
7875|竹田iP
680.0
▲ +2.26%
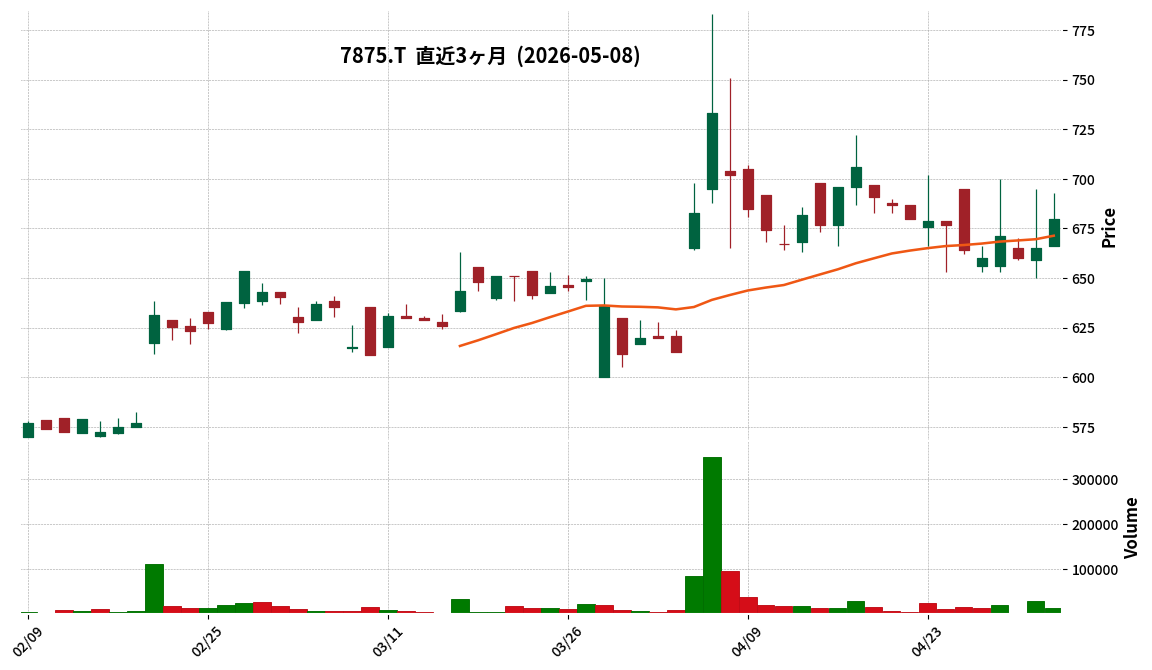
This article is an AI-generated summary and analysis of official IR disclosures.
📄 Announcement (AI-Reviewed)
- Takeda i-P Holdings announced a revision to its dividend forecast for the fiscal year ending March 2026, leading to an increase in dividends.
- The year-end dividend forecast has been revised upward by ¥10.00 per share, from the previous forecast of ¥23.00 to the revised forecast of ¥33.00 per share.
- Consequently, the annual dividend forecast for the fiscal year ending March 2026 will be ¥47.00 per share, combining the interim dividend of ¥14.00 and the revised year-end dividend of ¥33.00.
- This revision is based on the company’s mid-term management plan, announced on May 14, 2024, which emphasizes strengthening shareholder returns, targeting a consolidated dividend payout ratio of 30% or more, and a policy to progressively increase the minimum annual dividend amount, alongside future business performance outlooks.
- Although a stock split (two shares for every one share) will take effect on April 1, 2026, the year-end dividend for the fiscal year ending March 31, 2026, will be based on the number of shares before the stock split.
🤖 AI Perspective
This dividend forecast revision can be seen as a concrete step towards the shareholder return policy outlined in the mid-term management plan. The target of a consolidated dividend payout ratio of 30% or more and the policy of progressively increasing the minimum annual dividend amount may suggest a strong commitment to shareholder value. Furthermore, the increased dividend, based on future business performance outlooks, could indicate the company’s confidence in its operational performance.
9753|IXナレッジ
1291.0
▲ +1.02%
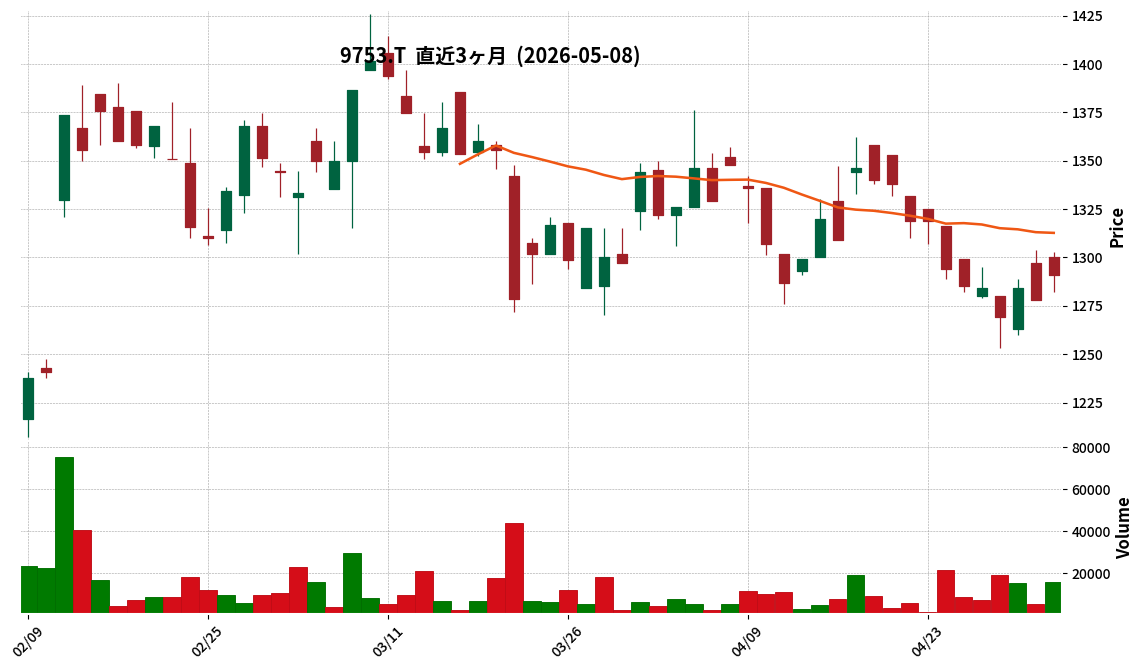
This article is an AI-generated summary and analysis of official IR disclosures.
📄 Announcement (AI-Reviewed)
- For the fiscal year ended March 31, 2026, IX Knowledge reported consolidated net sales of 24,351 million yen (up 6.7% year-on-year), operating profit of 2,207 million yen (up 18.2%), ordinary profit of 2,318 million yen (up 18.9%), and profit attributable to owners of parent of 1,714 million yen (up 29.3%).
- Basic earnings per share for FY2026 was recorded at 179.22 yen.
- The annual dividend for FY2026 was 50.00 yen per share (ordinary dividend 45.00 yen, special dividend 5.00 yen), an increase from 40.00 yen in the previous fiscal year.
- The equity ratio stood at 70.9% as of March 31, 2026, marking an increase from 66.8% at the end of the prior fiscal year.
- For the fiscal year ending March 31, 2027, the company forecasts consolidated net sales of 25,102 million yen (up 3.1% year-on-year), operating profit of 2,326 million yen (up 5.4%), ordinary profit of 2,397 million yen (up 3.4%), and profit attributable to owners of parent of 1,614 million yen (down 5.8%).
🤖 AI Perspective
IX Knowledge’s strong performance in FY2026 appears to be driven by robust IT demand, with an expansion of system development projects for financial institutions and telecommunication carriers. The significant increase in profit attributable to owners of parent was also influenced by factors such as tax credits related to the wage increase promotion tax system. However, while the company projects growth in net sales and operating profit for FY2027, a decrease in profit attributable to owners of parent is forecasted, which could lead investors to examine the underlying reasons.
303A|G-visumo
803.0
▲ +1.13%
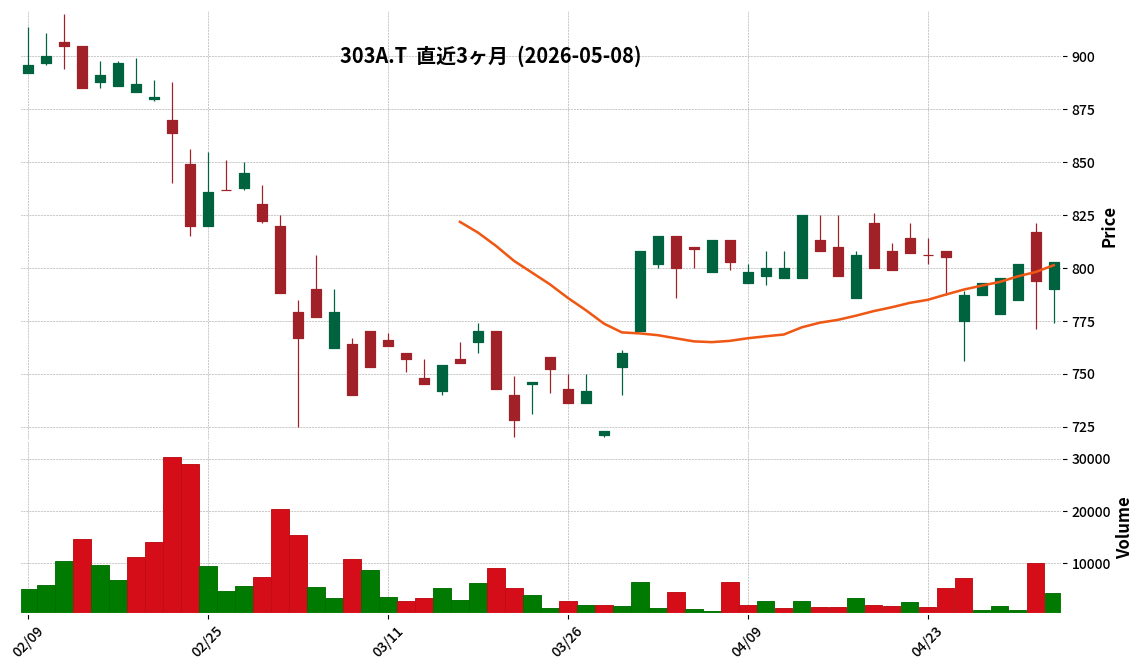
📎 Source:G-visumo Official IR →
This article is an AI-generated summary and analysis of official IR disclosures.
📄 Announcement (AI-Reviewed)
- G-visumo Inc. reported full-year financial results for the fiscal year ended March 2026, with sales reaching ¥973,156 thousand (a 17.4% increase year-on-year) and ordinary profit at ¥83,074 thousand (a 22.6% increase year-on-year).
- Sales were robust, supported by an increase in client accounts and cross-selling effects following the absorption merger with ReviCo Inc., a provider of review tools, on January 1, 2026.
- Ordinary profit came in at 97.7% of the company’s forecast, attributed to temporary expenses related to the merger.
- For the fiscal year ending March 2027, the company forecasts sales of ¥1,352,000 thousand (a 38.9% increase year-on-year) and ordinary profit of ¥30,000 thousand (a 63.9% decrease year-on-year).
- The projected decline in ordinary profit is primarily due to an anticipated increase in strategic investments for AI solution development.
🤖 AI Perspective
The FY2026 results suggest that the merger with ReviCo Inc. contributed to G-visumo’s sales growth. However, the projected decrease in ordinary profit for FY2027, due to increased strategic investments in AI solution development, may indicate a prioritization of long-term business foundation enhancement over short-term profitability. Investors may want to monitor how post-merger synergies and AI investments will impact the company’s future performance.
4563|G-アンジェス
53.0
▲ +1.92%
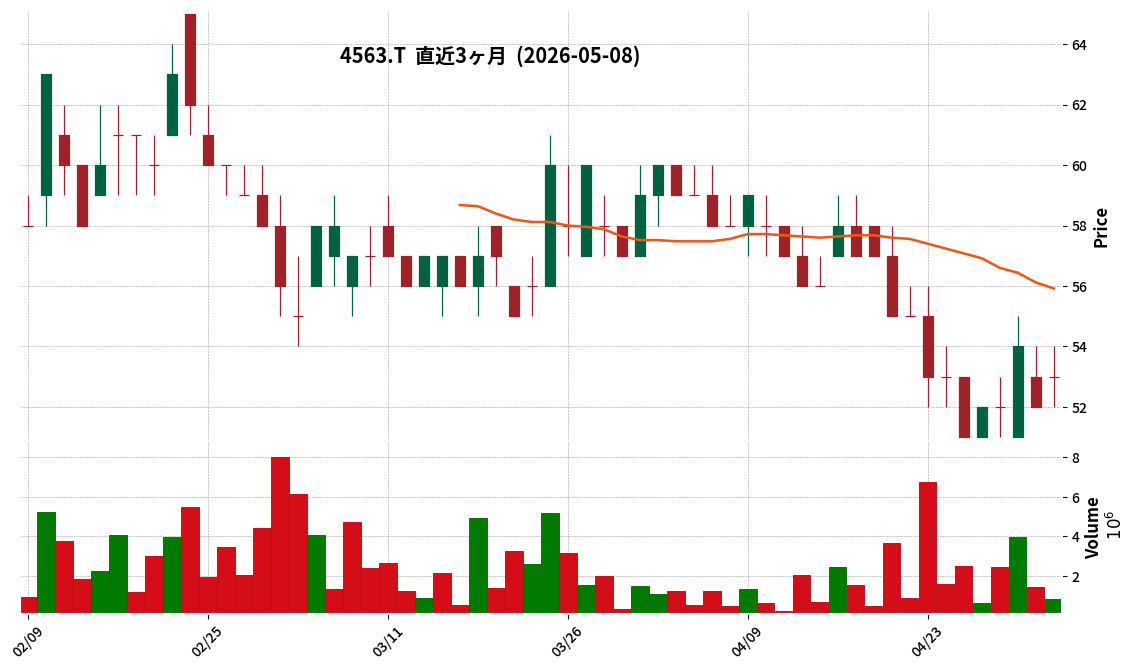
📎 Source:G-アンジェス Official IR →
This article is an AI-generated summary and analysis of official IR disclosures.
📄 Announcement (AI-Reviewed)
- G-AnGes (4563) announced its consolidated financial results for the first quarter of the fiscal year ending December 2026 (January 1, 2026, to March 31, 2026).
- Net sales increased by 20.4% year-on-year to JPY 203 million. The operating loss was JPY 1,496 million (compared to an operating loss of JPY 1,255 million in the prior year period). The recurring loss was JPY 1,110 million (compared to a recurring loss of JPY 1,237 million), and the net loss attributable to owners of the parent was JPY 1,082 million (compared to a net loss of JPY 1,247 million).
- The breakdown of sales included JPY 78 million from product sales of the progeria treatment “Zokinvy” (up 42.4% year-on-year) and JPY 124 million from expanded newborn screening service fees (up 9.7% year-on-year).
- Research and development expenses increased by 27.5% year-on-year to JPY 1,007 million, primarily due to increased outsourcing fees for the HGF gene therapy product’s application to the U.S. FDA and manufacturing test costs.
- Regarding the consolidated financial position, total assets decreased by JPY 933 million from the end of the previous fiscal year to JPY 4,472 million. Net assets decreased by JPY 1,052 million to JPY 2,023 million, with the equity ratio at 43.3% (compared to 55.2% at the end of the previous fiscal year).
🤖 AI Perspective
The financial results indicate a year-on-year increase in net sales, driven by strong performance in “Zokinvy” product sales and screening service fees. However, the expansion of research and development investments, particularly for the HGF gene therapy product’s U.S. FDA application, led to a wider operating loss, which may reflect the inherent nature of an R&D-intensive biotech company. Notably, foreign exchange gains contributed to narrowing both recurring and net losses compared to the previous year. Investors may continue to monitor the company’s progress in its drug development pipeline and the efficiency of its R&D expenditures.
4958|長谷川香
2933.0
▼ -0.58%
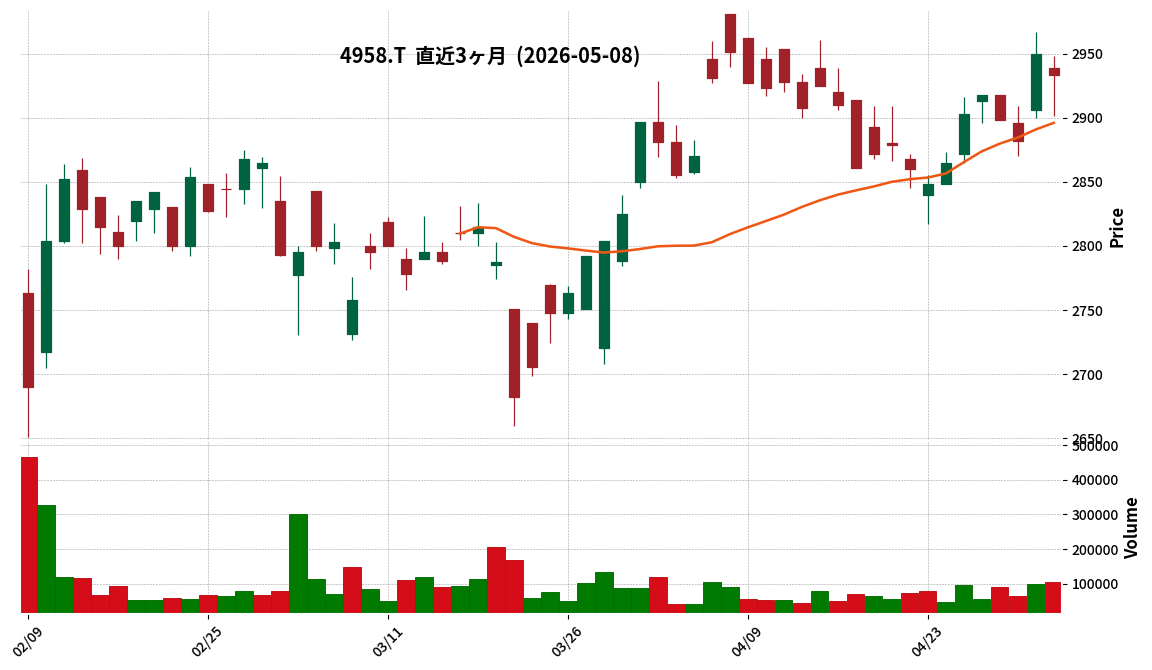
This article is an AI-generated summary and analysis of official IR disclosures.
📄 Announcement (AI-Reviewed)
- Consolidated net sales for the second quarter of the fiscal year ending September 2026 reached ¥37,585 million, marking a 4.9% increase year-on-year.
- Net income attributable to owners of parent for the interim period was ¥3,749 million, an increase of 11.6% compared to the prior year.
- Key drivers for the sales increase include higher sales from the U.S. and Malaysian subsidiaries, and the consolidation of the newly acquired Vietnam subsidiary, Hoang Anh Flavors and Food Ingredients Joint Stock Company.
- The rise in interim net income was primarily due to favorable foreign exchange effects and the recording of extraordinary gains from the sale of investment securities.
- The full-year consolidated earnings forecast (Net sales ¥76,500 million, Operating profit ¥9,430 million, Ordinary profit ¥10,050 million, Net income attributable to owners of parent ¥7,320 million) and the annual dividend forecast of ¥100 remain unchanged from the most recently published projections.
🤖 AI Perspective
The interim consolidated results suggest that sales growth was supported by strong performance from overseas subsidiaries, the consolidation of a new subsidiary, and positive foreign exchange translation effects due to the yen’s depreciation. While operating profit included one-time M&A-related expenses, the yen’s impact and gains from investment securities significantly enhanced the final net income. The unchanged full-year outlook may indicate that the company’s current progress aligns with its internal expectations.
7224|新明和工
2583.0
▼ -4.16%
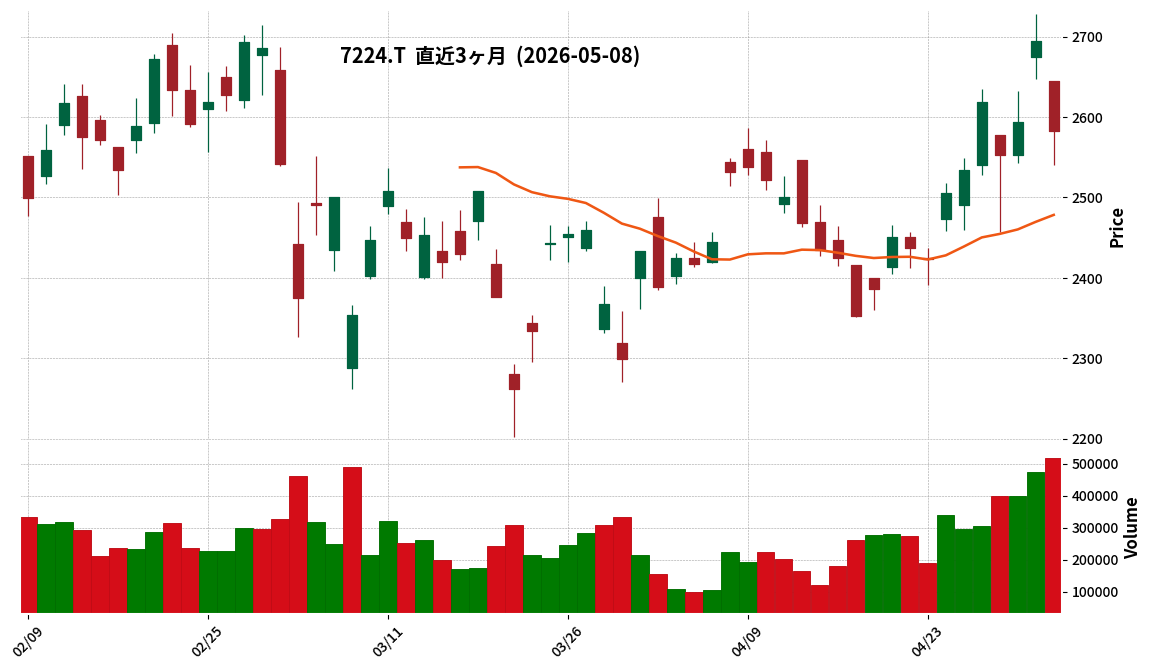
This article is an AI-generated summary and analysis of official IR disclosures.
📄 Announcement (AI-Reviewed)
- ShinMaywa Industries, Ltd. announced on May 8, 2026, an upward revision to its year-end dividend forecast for the fiscal year ending March 2026.
- The per-share year-end dividend forecast has been revised from the previous JPY 27.00 to JPY 29.00.
- Consequently, the total annual dividend for the current fiscal year, including the interim dividend of JPY 27.00, will increase from the previously forecasted JPY 54.00 to JPY 56.00.
- This revision is based on the company’s dividend policy to target a Dividend on Equity (DOE) of approximately 3% under its Medium-Term Management Plan, which concludes in FY2026, and considers the consolidated financial results and financial position for the fiscal year ending March 2026, announced today.
- The DOE calculated based on the revised annual dividend of JPY 56.00 is 3.1%.
🤖 AI Perspective
This dividend increase is stated to be a result of comprehensive consideration of the company’s consolidated financial results and financial position for the fiscal year ending March 2026, aligning with its Medium-Term Management Plan’s DOE target. The company’s action may suggest a commitment to shareholder returns based on its performance and financial health.
8113|ユニチャーム
945.0
▲ +1.07%
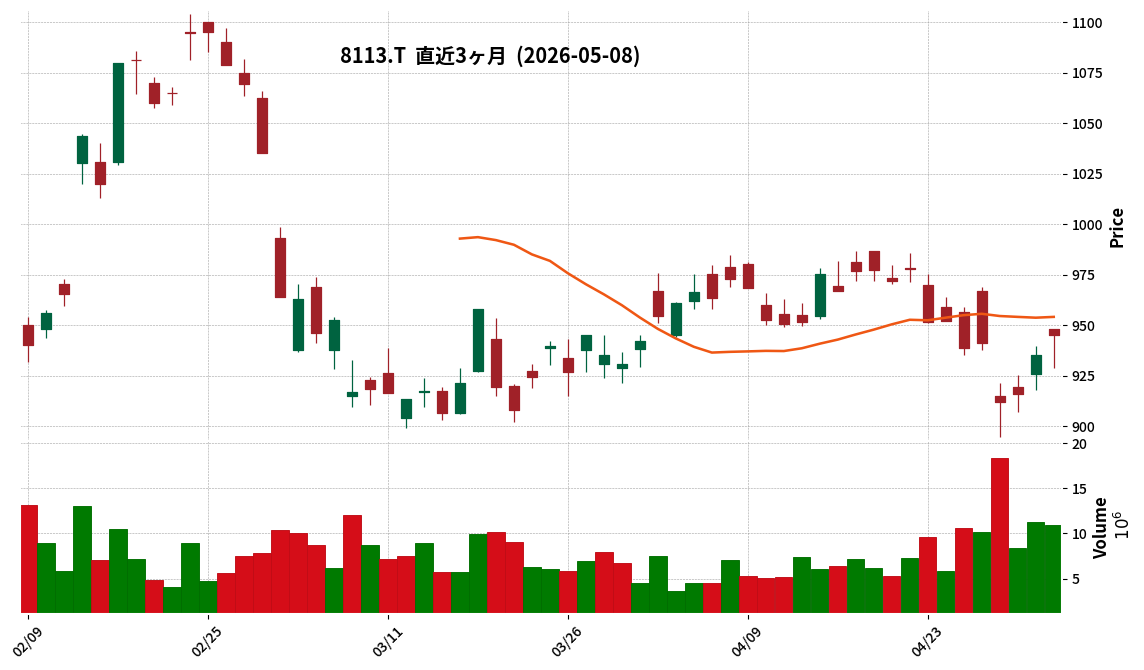
This article is an AI-generated summary and analysis of official IR disclosures.
📄 Announcement (AI-Reviewed)
- Unicharm Corporation announced its consolidated financial results for the first quarter of the fiscal year ending December 2026 (January 1, 2026 to March 31, 2026) on May 8, 2026.
- For the quarter, consolidated net sales were JPY 234,185 million (up 2.9% year-on-year), and core operating profit was JPY 31,479 million (up 8.5% year-on-year), achieving increased sales and profit.
- Conversely, pre-tax quarterly profit decreased to JPY 31,391 million (down 10.2% year-on-year), profit attributable to owners of the parent decreased to JPY 19,758 million (down 20.7% year-on-year), and basic earnings per share were JPY 11.40.
- The full-year consolidated performance forecast and the annual dividend forecast for FY2026 (totaling JPY 22.00, interim JPY 11.00, year-end JPY 11.00) remain unchanged from the most recently announced figures.
- In the Asian region, while a downtrading trend continued for some baby care products, the Chinese market showed improved profitability, indicating signs of recovery in performance.
🤖 AI Perspective
Unicharm’s Q1 FY2026 results reveal solid growth in net sales and core operating profit, yet a decline in pre-tax profit and profit attributable to owners. This might suggest a strengthening of the underlying business performance, but with potential impacts from foreign exchange fluctuations or other financial factors on the bottom line. The decision to keep the full-year consolidated performance forecast unchanged could indicate management’s confidence in meeting their initial targets despite some quarterly variations.
8996|ハウスフリーダム
1025.0
▼ -0.29%
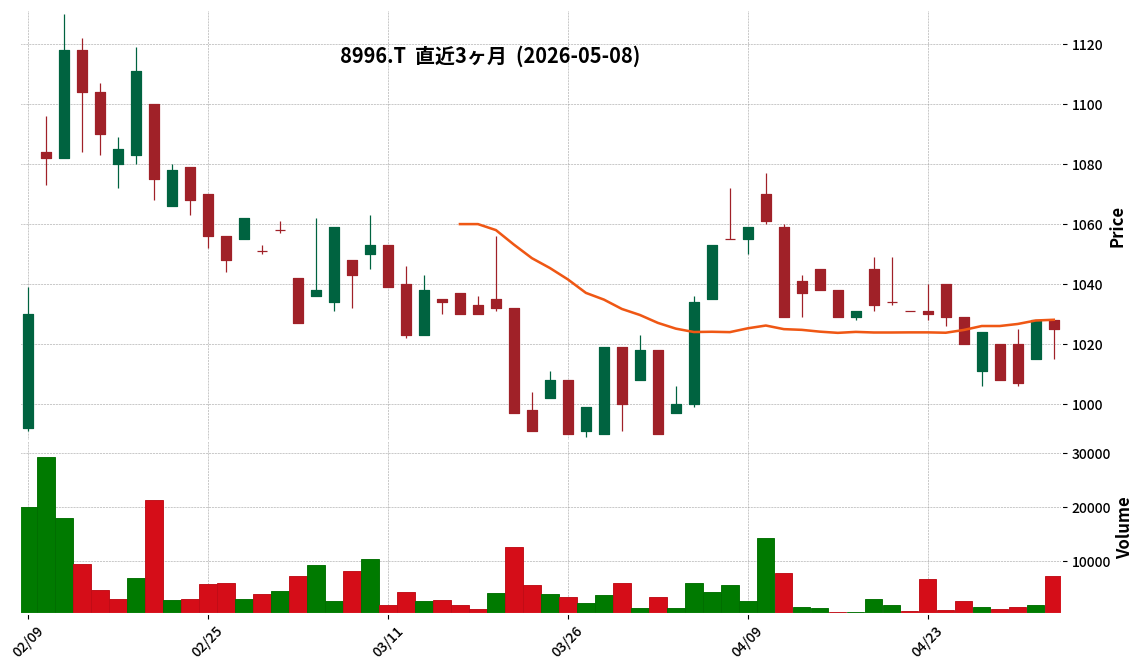
📎 Source:ハウスフリーダム Official IR →
This article is an AI-generated summary and analysis of official IR disclosures.
📄 Announcement (AI-Reviewed)
- House Freedom Co., Ltd. announced its consolidated financial results for the first quarter of the fiscal year ending December 2026 (January 1 to March 31, 2026).
- Consolidated results show net sales of ¥2,741 million (down 12.8% year-on-year). Operating income was ¥94 million (compared to an operating loss of ¥22 million in the same period last year), ordinary income was ¥53 million (compared to an ordinary loss of ¥56 million), and net income attributable to owners of parent was ¥31 million (compared to a net loss of ¥49 million).
- Despite a decrease in net sales, operating income, ordinary income, and net income attributable to owners of parent all turned profitable from losses in the previous year’s same period.
- The full-year consolidated business forecast remains unchanged from the forecast announced on February 9, 2026.
- As of the end of the period, consolidated total assets were ¥18,048 million (up ¥1,041 million from the previous fiscal year-end), net assets were ¥3,676 million (down ¥182 million), and the equity ratio was 20.4% (vs. 22.7% at the previous fiscal year-end).
🤖 AI Perspective
In the first quarter consolidated results, while net sales decreased year-on-year, all profit stages from operating income onwards turned positive. This turnaround is primarily attributed to the absence of one-time costs associated with operating activities, which were recorded in the same period last year, despite a decline in sales due to fewer units sold in the real estate development business. The company also reported that its core real estate brokerage business performed steadily, and its real estate leasing business progressed generally as planned, which may suggest the stability within its diverse business portfolio.
9339|コーチ・エィ
1249.0
▲ +1.05%
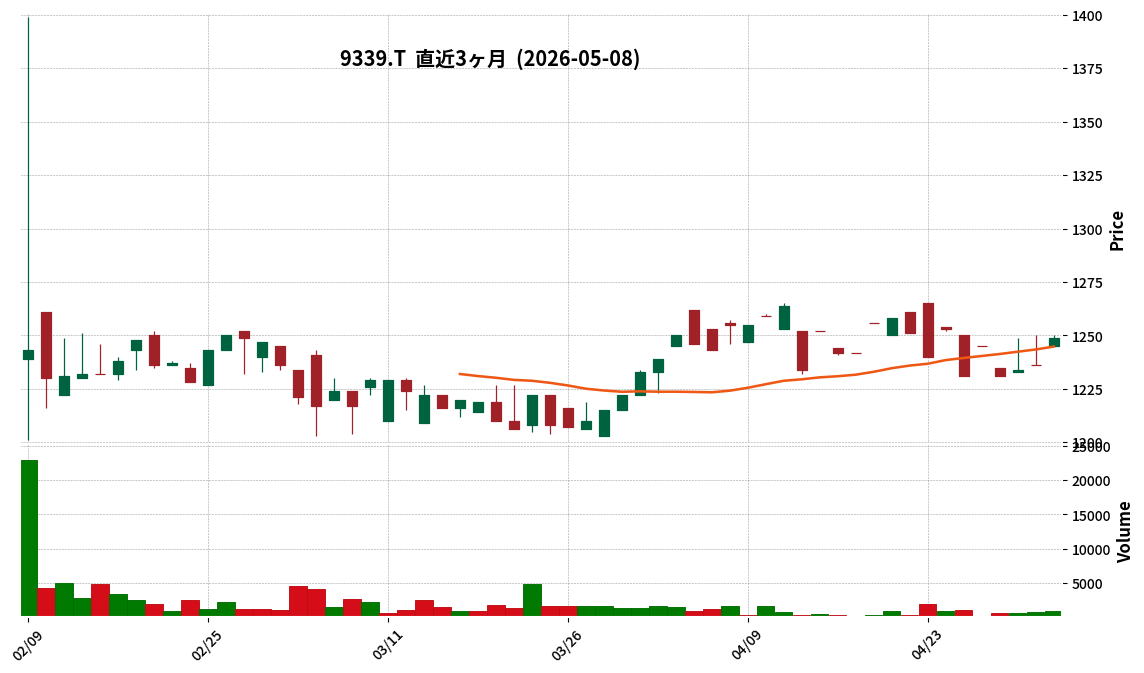
This article is an AI-generated summary and analysis of official IR disclosures.
📄 Announcement (AI-Reviewed)
- For the first quarter of fiscal year 2026 (January 1 to March 31, 2026), consolidated net sales totaled JPY 798 million, representing a 1.6% decrease year-on-year.
- Operating profit reached JPY 19 million, ordinary profit JPY 25 million, and net profit attributable to parent company shareholders JPY 6 million, marking a turnaround from losses in the prior-year period.
- Cost of sales decreased by 7.0% year-on-year due to lower personnel expenses resulting from a focus on coach training in the prior period, while selling, general, and administrative expenses fell by 3.0% due to reduced personnel and temporary staff costs from operational efficiency improvements.
- Non-operating income exceeded JPY 6 million, primarily driven by JPY 3 million in foreign exchange gains and JPY 2 million in interest income, an increase from JPY 2 million in the prior-year period.
- The full-year consolidated earnings forecast and annual dividend forecast remain unchanged from the announcement made on February 10, 2026.
🤖 AI Perspective
- The company’s shift from a net loss to profitability across all key income metrics compared to the previous year’s quarter is a significant development.
- Despite a slight decrease in net sales, the reduction in costs, particularly personnel expenses, appears to have contributed to the improved profitability.
- The planned revenue recognition from large-scale projects in the second half of the year, alongside non-operating income from foreign exchange gains, could be viewed as supporting factors for these results.
9376|ユーラシア
808.0
▼ -4.94%
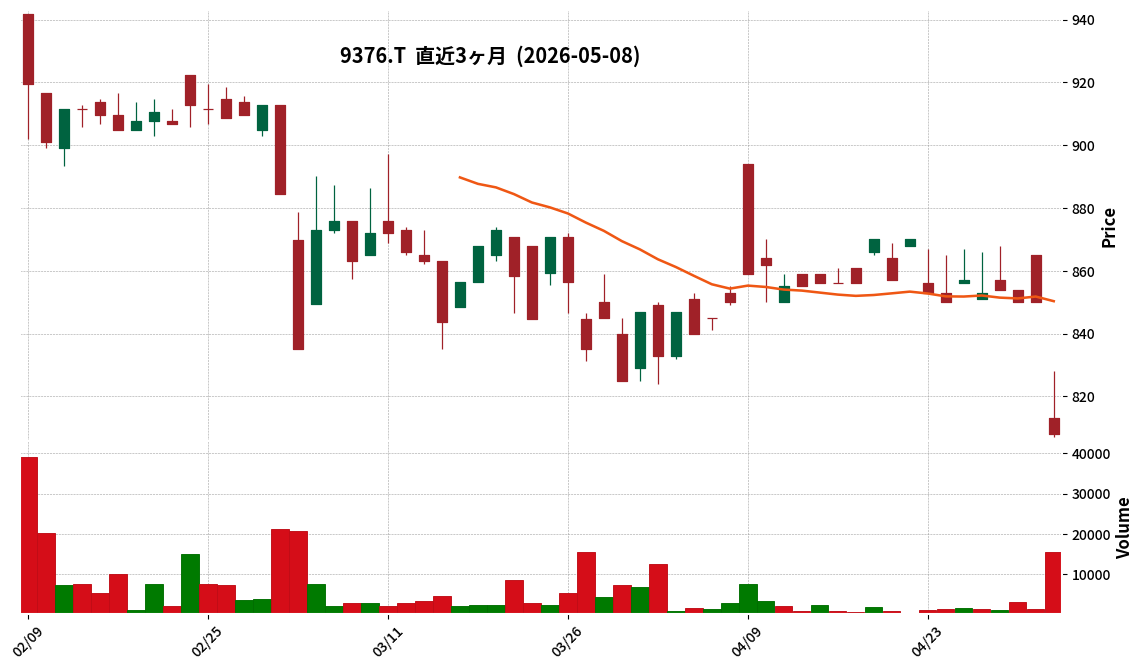
This article is an AI-generated summary and analysis of official IR disclosures.
📄 Announcement (AI-Reviewed)
- Eurasia Corporation announced its consolidated financial results for the second quarter of the fiscal year ending September 2026.
- Consolidated net sales for the interim period increased by 11.2% year-on-year, reaching JPY 2,502 million.
- Conversely, the company reported an operating loss of JPY 21 million, a decrease from the operating profit of JPY 24 million recorded in the same period last year. Ordinary profit and net profit attributable to parent company shareholders also registered losses.
- Factors contributing to the decrease in profit include the impact of the US-Israeli attack on Iran on February 28, 2026, which led to tour cancellations and expenses for safe customer repatriation, as well as increased procurement costs due to the yen’s depreciation from the beginning of the fiscal year.
- The consolidated full-year earnings forecast for the fiscal year ending September 2026 and the annual dividend forecast of JPY 50.00 (interim JPY 25.00, year-end JPY 25.00) remain unchanged from previous announcements.
🤖 AI Perspective
While achieving revenue growth in the interim period, geopolitical risks and the depreciating yen appear to have significantly impacted the company’s profitability. However, growth-oriented initiatives such as enhancing 40th-anniversary products and strengthening recruitment are ongoing. The unchanged full-year earnings forecast could suggest management’s expectation for a recovery in the latter half of the fiscal year.
9413|テレ東HD
3995.0
▼ -0.75%
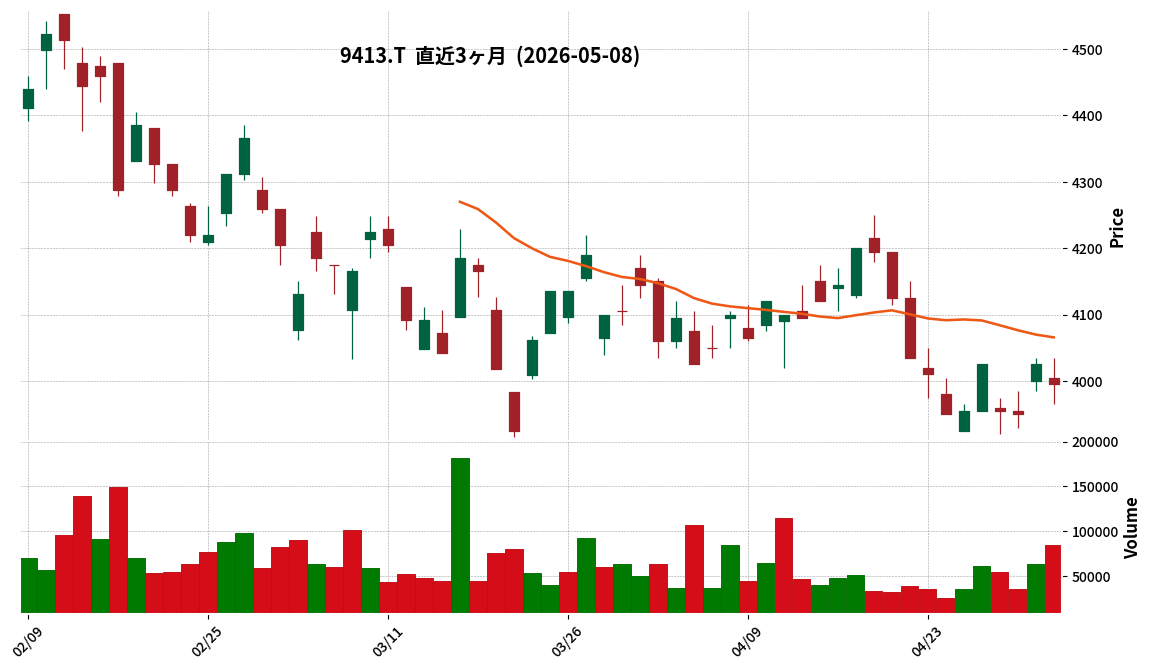
This article is an AI-generated summary and analysis of official IR disclosures.
📄 Announcement (AI-Reviewed)
- TV Tokyo Holdings Corporation (9413) announced on May 8, 2026, a revision of its 2025-27 Medium-Term Management Plan, raising its numerical targets.
- The revised plan increases the sales target for FY2025 from ¥157.0 billion to ¥164.9 billion, operating profit from ¥8.0 billion to ¥11.4 billion, and net profit from ¥6.3 billion to ¥7.7 billion.
- Sales, operating profit, net profit, and ROE targets have also been upwardly revised for FY2026 and FY2027.
- The upward revision is attributed to strong performance in the “Anime/Streaming” segment, particularly from overseas game royalties related to “NARUTO/BORUTO,” and increased CM unit prices in the broadcasting business, leading to record-high sales, operating profit, ordinary profit, and net profit in FY2025.
- The company strengthened its shareholder return policy, setting a consolidated dividend payout ratio target of 35% and a total return ratio target of approximately 40%, while abolishing the previous ¥20 minimum dividend policy.
🤖 AI Perspective
- The upward revision of the medium-term management plan suggests that the “Anime/Streaming” segment, identified as a key growth engine, has performed better than initially expected.
- The increase in the dividend payout ratio, introduction of a total return ratio, and abolition of the minimum dividend policy indicate a clear commitment to strengthening shareholder returns linked to profit growth.
- These changes highlight the company’s progress with its “CaaS” strategy focused on content and IP, and its evolution into a global IP media company, which could be points of interest for future corporate value.
9421|エヌジェイHD
663.0
▼ -0.60%
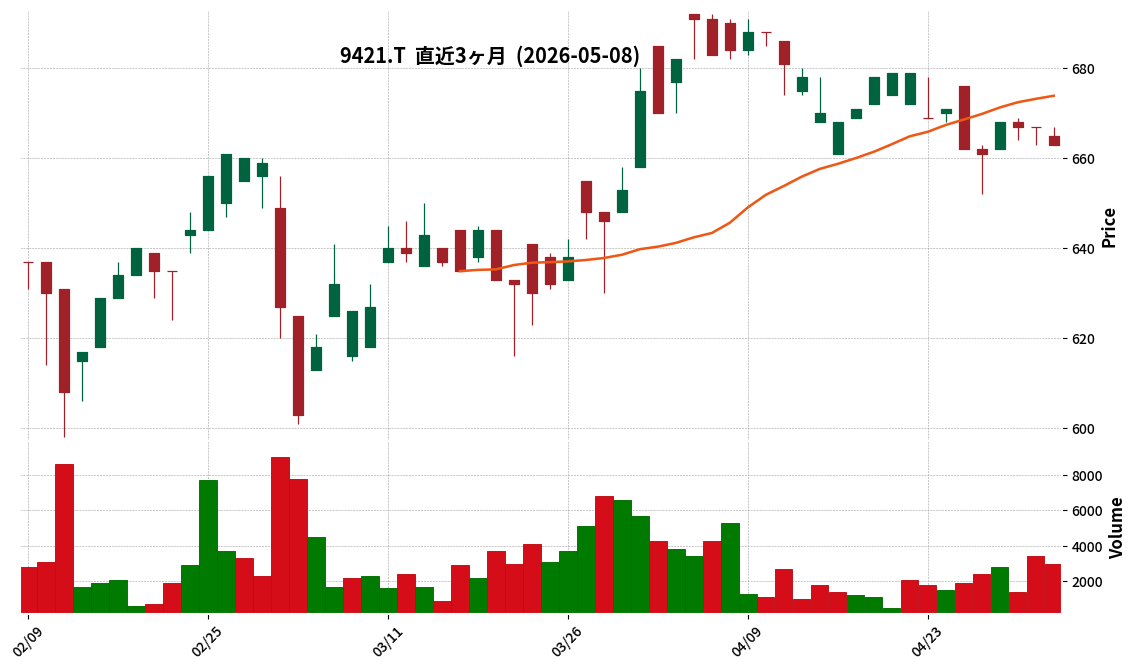
📎 Source:エヌジェイHD Official IR →
This article is an AI-generated summary and analysis of official IR disclosures.
📄 Announcement (AI-Reviewed)
- NJ Holdings Co., Ltd. announced its consolidated financial results for the third quarter of the fiscal year ending June 2026 (July 1, 2025, to March 31, 2026).
- Consolidated net sales for the cumulative period amounted to JPY 7,579 million, representing a 13.2% increase compared to the previous year.
- Operating profit reached JPY 123 million, marking a significant increase of 520.9% year-on-year.
- Ordinary profit was JPY 102 million, compared to JPY 5 million in the same period last year.
- Net loss attributable to owners of parent narrowed to JPY 8 million, from a loss of JPY 15 million in the prior year.
- The consolidated full-year earnings forecast for the fiscal year ending June 2026 remains unchanged, projecting net sales of JPY 9,910 million, operating profit of JPY 150 million, ordinary profit of JPY 130 million, and net profit attributable to owners of parent of JPY 110 million.
🤖 AI Perspective
The significant year-on-year increase in both net sales and operating profit during the third quarter cumulative period could be attributed to the expansion of overseas support operations in the game business and robust sales from new and existing stores in the mobile business. The narrowing of the net loss attributable to owners of parent may also be a point of interest for investors. The unchanged full-year forecast suggests that the company anticipates continued positive performance in the final quarter.
3823|WHY HOW DO
42.0
▲ +0.00%
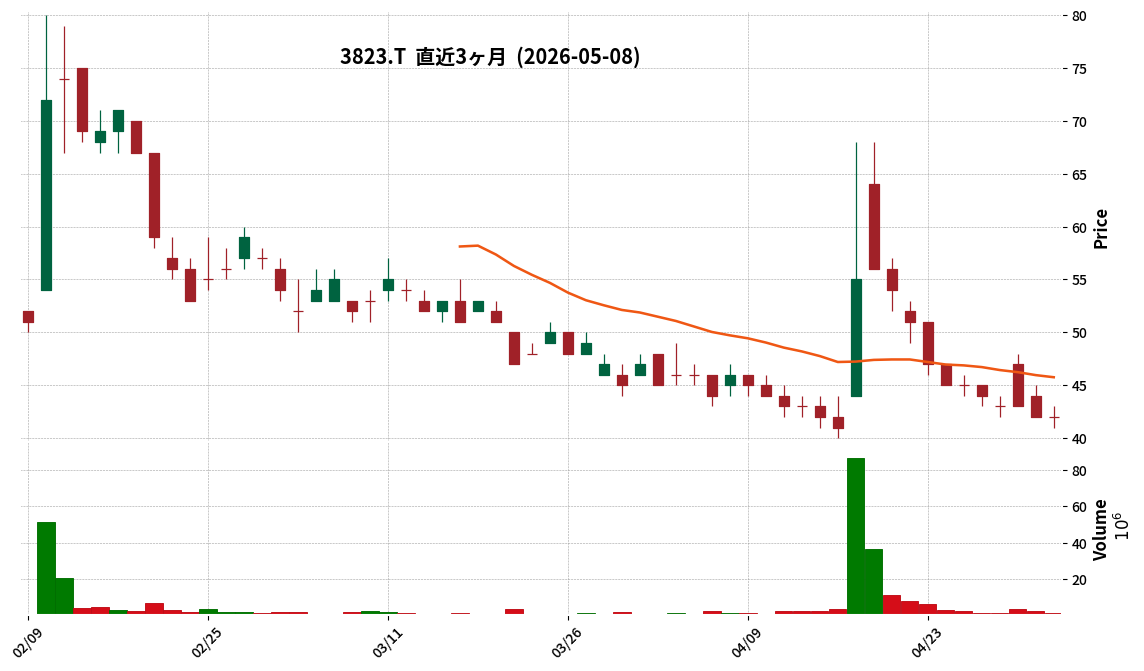
📎 Source:WHY HOW DO Official IR →
This article is an AI-generated summary and analysis of official IR disclosures.
📄 Announcement (AI-Reviewed)
- WHY HOW DO has determined the share exchange ratio for the complete acquisition of Cowell Co., Ltd. through a simplified share exchange.
- WHY HOW DO will be the wholly-owning parent company, and Cowell Co., Ltd. will be the wholly-owned subsidiary via this simplified share exchange.
- The share exchange ratio is set at 2,259.433 common shares of WHY HOW DO for every one common share of Cowell.
- A total of 1,093,500 common shares of WHY HOW DO will be delivered as a result of this share exchange.
- The share exchange ratio was calculated by dividing Cowell’s common stock value of 103,305.785 yen by the average closing price of WHY HOW DO’s common stock over the past month (45.722 yen) as of the reference time (3:30 p.m. on May 8, 2026).
🤖 AI Perspective
The complete acquisition of Cowell by WHY HOW DO could impact the acquiring company’s overall business portfolio and revenue structure. The determined share exchange ratio reflects the terms of the acquisition and the valuation of both entities. Investors may wish to monitor how this acquisition aligns with WHY HOW DO’s strategic goals and potential synergy realization.
7273|イクヨ
651.0
▲ +0.00%
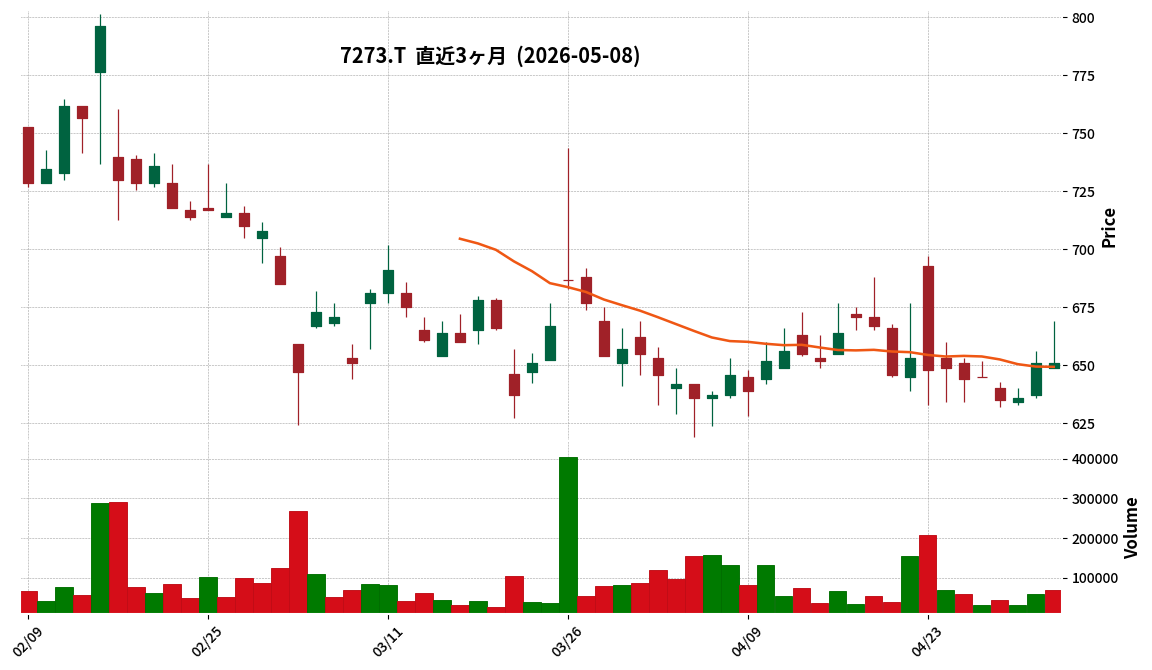
This article is an AI-generated summary and analysis of official IR disclosures.
📄 Announcement (AI-Reviewed)
- Ikuyo Co., Ltd. resolved to acquire 99.7% of the shares of Digital Asset Securities Co., Ltd. (DA Securities), making it a subsidiary, as decided at its Board of Directors meeting on May 8, 2026.
- The purpose of this acquisition is to strengthen the company’s business foundation in the digital domain and create new revenue opportunities, specifically mentioning crypto-asset management, mining businesses, and enhanced external alliances in the Web3 sector.
- The acquisition price for DA Securities shares is 1,490 million yen.
- DA Securities operates in the financial instruments business. While its revenue has shown an increasing trend over the past three fiscal years (FY2023 to FY2025), it has continuously reported operating losses, ordinary losses, and net losses during this period.
- The share transfer agreement is scheduled to be concluded on June 24, 2026.
🤖 AI Perspective
This acquisition suggests Ikuyo Co., Ltd.’s intent to formally enter the digital asset sector by acquiring DA Securities, a financial instruments business operator. This move could enable Ikuyo to build a core structure for crypto-asset and Web3-related businesses, thereby advancing its new growth strategy. Given that DA Securities has reported losses in recent periods, the progress of future business developments and synergy creation will be worth monitoring.
7578|ニチリョク
103.0
▲ +0.98%
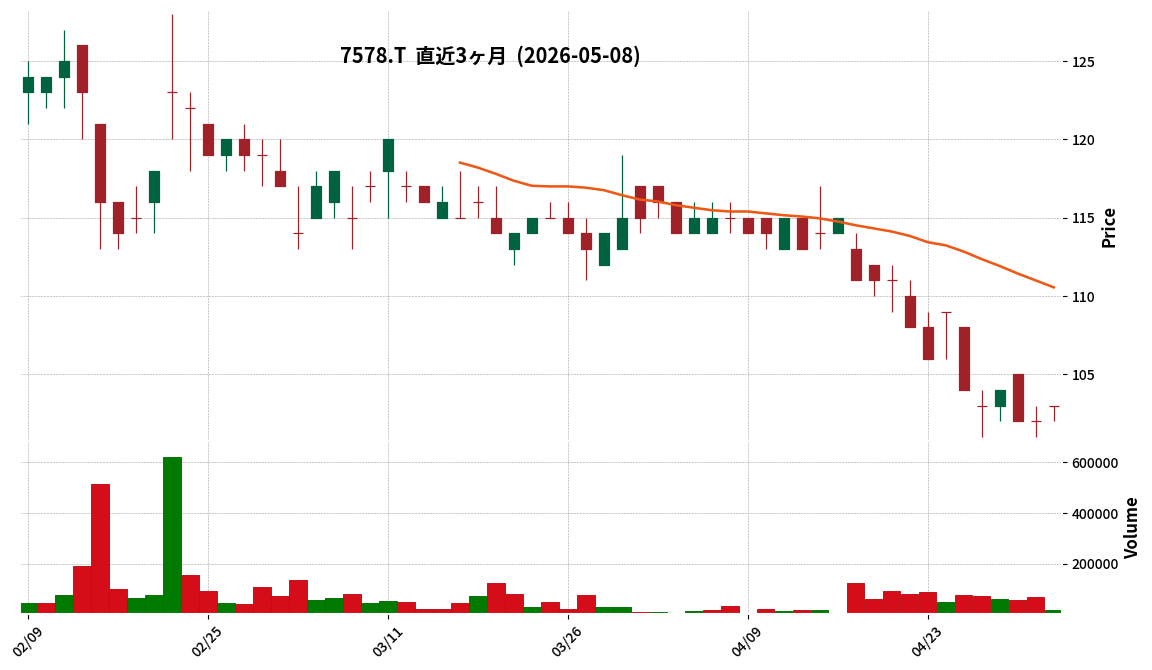
This article is an AI-generated summary and analysis of official IR disclosures.
📄 Announcement (AI-Reviewed)
- Nichiryoku Co., Ltd. announced the financial results of its unlisted parent company, Aristagora Advisors Inc., on May 8, 2026.
- Aristagora Advisors Inc. operates investment funds and serves as the general partner of the Value-Up Fund Investment Limited Partnership, which directly holds 34.66% of Nichiryoku’s voting rights (as of March 31, 2026).
- As of December 31, 2025, Aristagora Advisors Inc.’s balance sheet reported total assets of ¥717,354 thousand, total liabilities of ¥638,193 thousand, and total net assets of ¥79,161 thousand.
- For the fiscal year from January 1 to December 31, 2025, the company’s income statement showed sales of ¥251,946 thousand, operating income of ¥38,548 thousand, ordinary income of ¥24,403 thousand, and a net loss of ¥50,598 thousand.
- Mr. Jo Shinoda, Representative Director and Chairman of Aristagora Advisors Inc., also serves as Chairman of Nichiryoku. Mr. Tetsuo Miyake, a Director of Aristagora Advisors Inc., also serves as an Outside Director of Nichiryoku (as of March 31, 2026, for both).
🤖 AI Perspective
The disclosure of an unlisted parent company’s financial results by Nichiryoku provides investors with important insights into the parent’s financial health and its relationship with Nichiryoku, even though it is not consolidated. The parent company’s net loss for the period could indicate specific operational outcomes that may warrant attention regarding potential impacts on Nichiryoku’s future management strategies or policies. Additionally, the dual roles held by executives across both entities could be viewed as contributing to transparency regarding the overall group governance structure.
8798|アドバンスクリエイト
177.0
▼ -0.56%
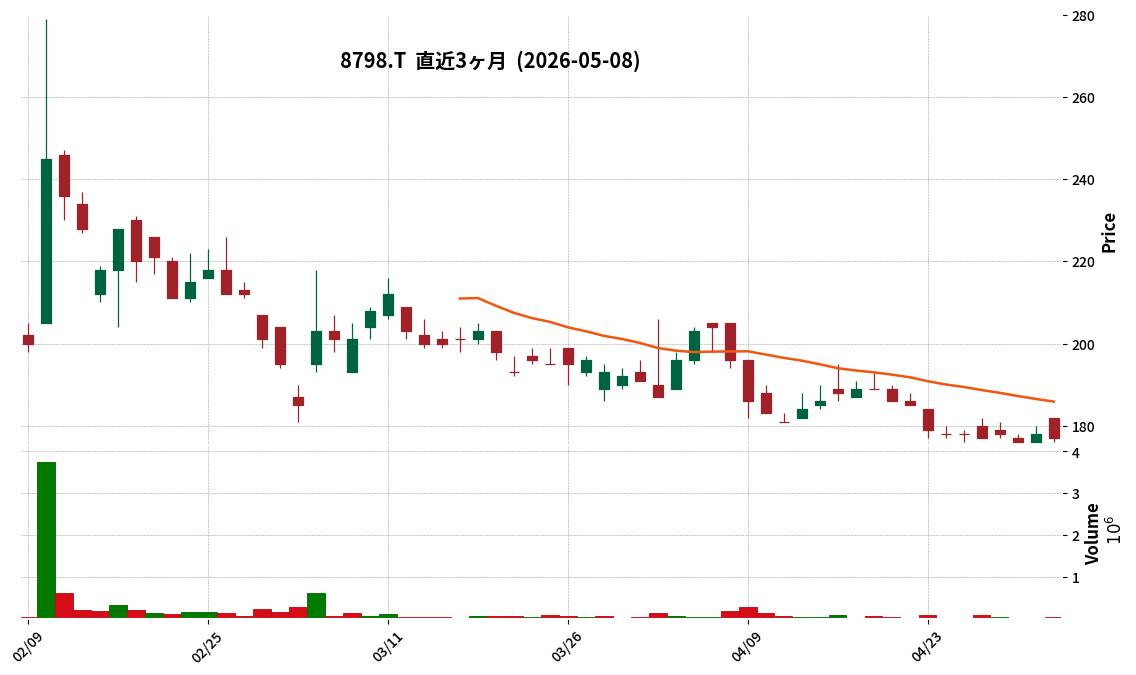
📎 Source:アドバンスクリエイト Official IR →
This article is an AI-generated summary and analysis of official IR disclosures.
📄 Announcement (AI-Reviewed)
- Advance Create Co., Ltd. resolved to establish a third-party committee at its Board of Directors meeting held on May 8, 2026.
- Allegations of inappropriate accounting practices have arisen, following external notification, concerning certain advertising transactions and software capitalization in past fiscal years (primarily FY2020 to FY2024) involving the company and its wholly-owned subsidiary, Hoken Ichiba Co., Ltd.
- The third-party committee is comprised of Mr. Makoto Shirai (Attorney-at-Law) as Chairperson, and Mr. Katsu Nagai (Attorney-at-Law and Certified Fraud Examiner) and Mr. Akira Takagi (Certified Public Accountant) as committee members.
- The disclosure of the Q2 FY2026 financial results, originally scheduled for May 15, 2026, has been postponed, and the company is considering applying for an extension of the deadline for submitting its semi-annual report.
- The company currently anticipates that the matter pertains only to past fiscal years’ performance and foresees a minor impact on its current fiscal year’s performance.
🤖 AI Perspective
The discovery of alleged accounting irregularities spanning multiple fiscal years, prompted by an external entity, suggests potential scrutiny of the company’s internal control systems. The findings of the independent third-party committee and the company’s subsequent actions will be crucial for its future management and restoration of trust. The postponement of financial disclosures means a temporary delay in information for investors, making the upcoming disclosure schedule a key point to monitor.
Disclaimer: This article is for informational purposes only and does not constitute investment advice.
4970|東洋合成
15820.0
▼ -3.89%
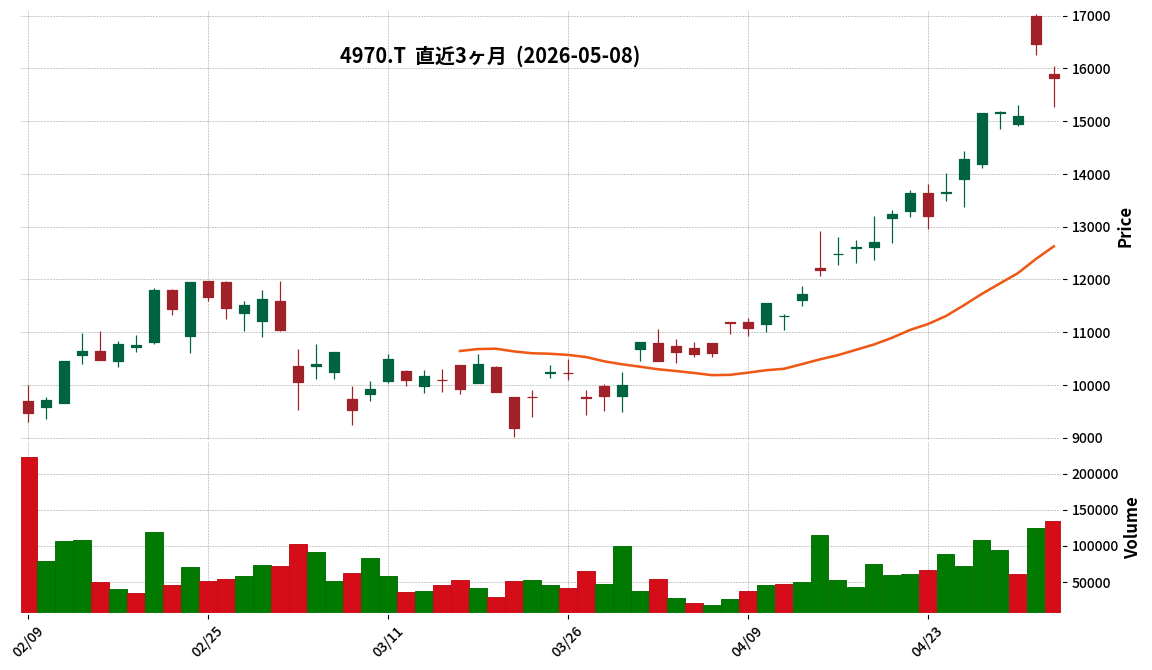
This article is an AI-generated summary and analysis of official IR disclosures.
📄 Announcement (AI-Reviewed)
- For the fiscal year ended March 31, 2026 (non-consolidated), net sales increased by 8.5% to 41,956 million yen, while operating profit decreased by 10.6% to 3,668 million yen, ordinary profit by 10.1% to 3,592 million yen, and net profit by 17.9% to 2,692 million yen.
- As of March 31, 2026, total assets were 66,949 million yen, net assets were 27,452 million yen, and the equity ratio was 41.0%.
- The annual dividend for FY2026 was 40.00 yen (compared to 45.00 yen in the previous year), with a forecasted annual dividend of 50.00 yen for FY2027.
- The full-year forecast for FY2027 includes net sales of 47,500 million yen (a 13.2% increase), operating profit of 5,000 million yen (a 36.3% increase), ordinary profit of 4,600 million yen (a 28.0% increase), and net profit of 3,200 million yen (an 18.8% increase).
- The increase in sales for FY2026 was driven by strong demand for advanced semiconductor materials and high-purity solvents. The decrease in profits was primarily due to increased fixed costs, including depreciation and personnel expenses, associated with the operation of large-scale facilities and a production information system.
🤖 AI Perspective
- The decrease in profits for FY2026, despite increased sales, appears to be a result of higher fixed costs associated with strategic capital expenditures.
- The robust profit growth forecast for FY2027 suggests that the company anticipates these new facilities and an increase in high-value-added product sales will begin to contribute significantly to profitability.
- The forecasted increase in the annual dividend for FY2027 could indicate management’s confidence in the projected turnaround and future performance.
7980|重松製作
900.0
▲ +0.56%
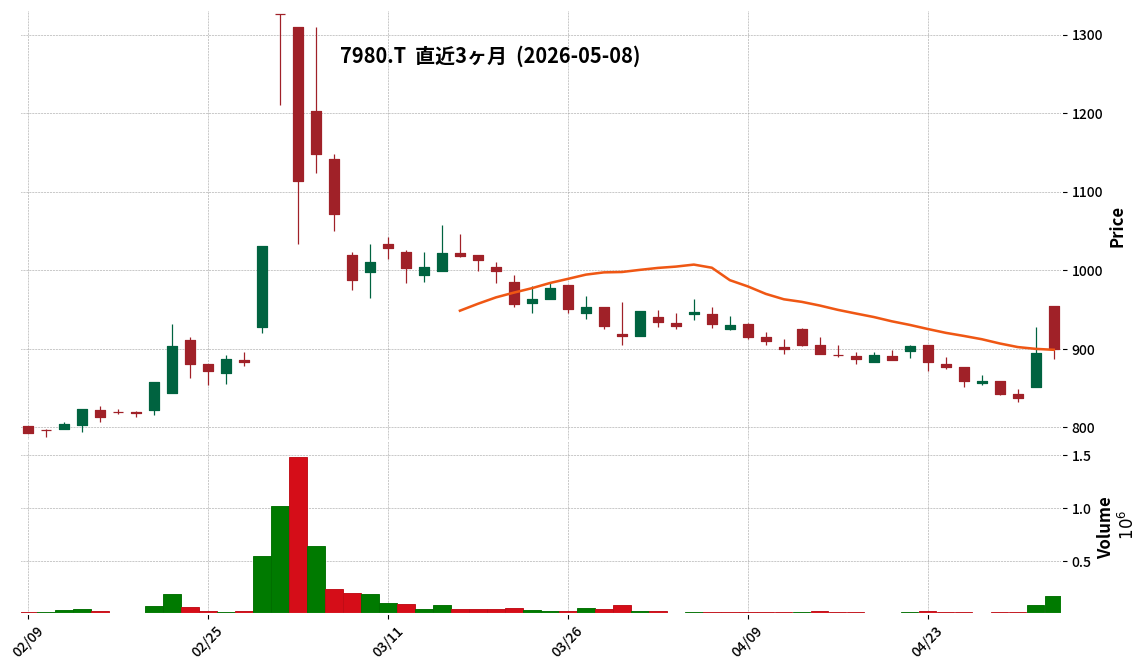
This article is an AI-generated summary and analysis of official IR disclosures.
📄 Announcement (AI-Reviewed)
- Revenue for the fiscal year ended March 31, 2026, reached a record high of ¥15,593 million, marking a 10.5% increase from the previous fiscal year.
- Operating profit decreased by 1.4% year-on-year to ¥1,054 million, ordinary profit by 15.0% to ¥933 million, and net profit by 10.0% to ¥702 million.
- Key factors cited for the profit decline include increased material and labor costs, expenses associated with the completion of the Second Funabiki Plant No. 3, a rise in selling, general and administrative expenses, and the recording of a ¥100 million syndication loan fee as non-operating expenses.
- The year-end dividend for FY2026/3 was ¥15.00 per share, with a total annual dividend of ¥15.00.
- For the fiscal year ending March 31, 2027, the company forecasts revenue of ¥15,800 million (+1.3% YoY), operating profit of ¥1,100 million (+4.3% YoY), ordinary profit of ¥1,020 million (+9.3% YoY), and net profit of ¥730 million (+4.0% YoY).
🤖 AI Perspective
Despite achieving record-high revenue, the company experienced a decline in profits due to increased costs and significant investments in facilities and systems. The upfront costs associated with the new plant and system upgrades may suggest a strategic investment phase. For the upcoming fiscal year, the company projects a return to both revenue and profit growth, indicating an expectation that these investments will start contributing positively. Investors may want to monitor the realization of these investment benefits and the progress of the company’s growth strategies.
9444|トーシンHD
327.0
▼ -0.61%
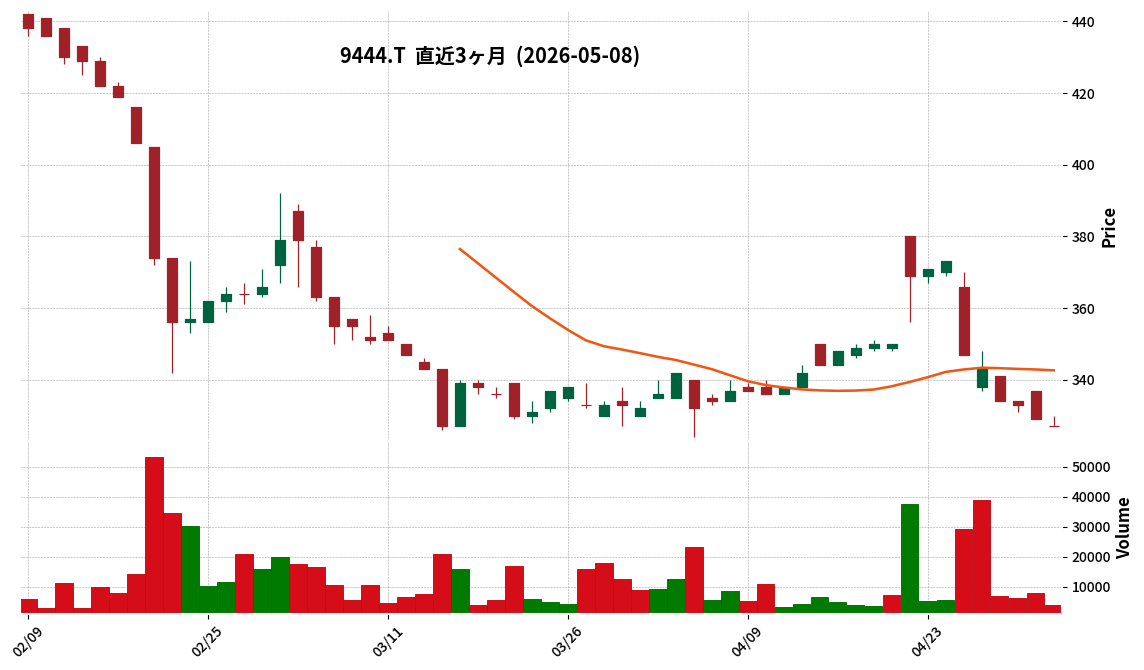
This article is an AI-generated summary and analysis of official IR disclosures.
📄 Announcement (AI-Reviewed)
- Toshin Holdings resolved to file for corporate reorganization proceedings at a Board of Directors meeting held on May 8, 2026, and the Tokyo District Court commenced the proceedings on the same day.
- Consequently, the company’s fiscal year-end (the last day of the business year) has been changed, in accordance with the provisions of the Corporate Reorganization Act.
- The fiscal year-end for the 41st business year has been changed from the conventionally stated April 30 to May 8, 2026.
- The 41st business year will span 8 days, from May 1, 2026, to May 8, 2026.
- The 42nd business year will commence on May 9, 2026, and conclude upon the approval of the reorganization plan under the Corporate Reorganization Act (or the termination of the proceedings, whichever comes first).
🤖 AI Perspective
The change in the fiscal year-end, driven by the commencement of corporate reorganization proceedings, is a direct consequence of legal mandates under the Corporate Reorganization Act. This will result in an unusually short current fiscal year, potentially impacting financial reporting timelines and content. Investors may find it important to monitor the overall progress of the reorganization proceedings and the details of the reconstruction plan, which are expected to be announced separately.
4335|IPSHD
1250.0
▼ -1.65%
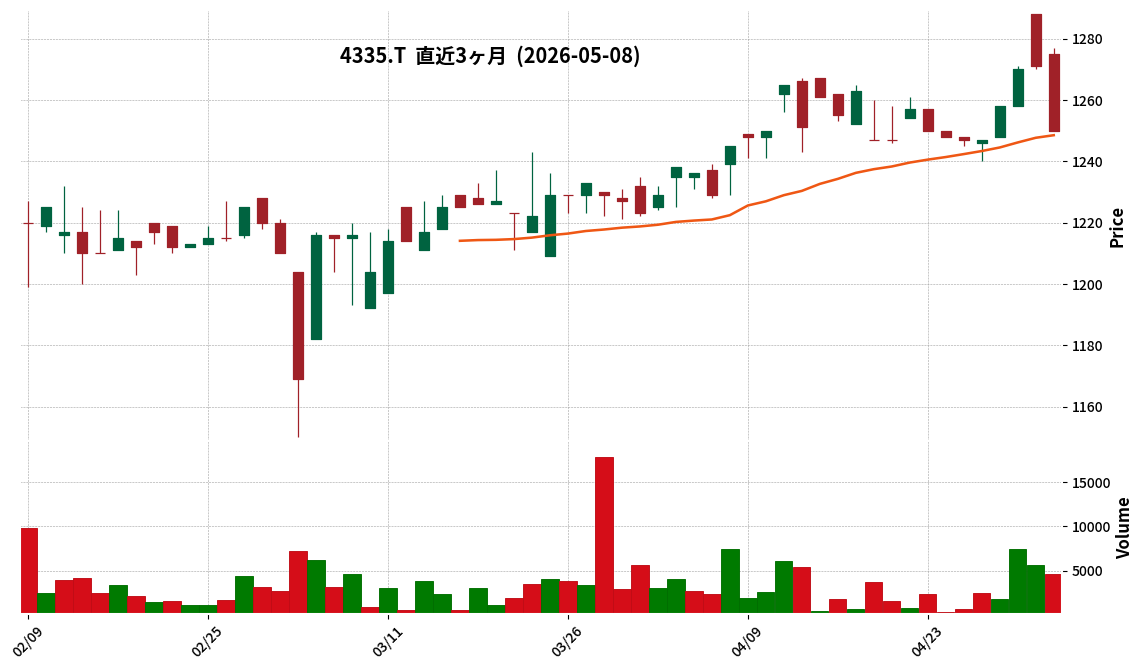
This article is an AI-generated summary and analysis of official IR disclosures.
📄 Announcement (AI-Reviewed)
- For the nine months ended March 31, 2026 (Q3 FY2026), consolidated net sales were JPY 2,788 million (up 4.1% year-on-year), operating profit was JPY 306 million (up 20.1% year-on-year), ordinary profit was JPY 306 million (up 20.7% year-on-year), and net profit attributable to owners of parent was JPY 185 million (up 6.8% year-on-year).
- As of March 31, 2026, consolidated total assets amounted to JPY 3,051 million, net assets to JPY 1,787 million, and the equity ratio stood at 57.6%.
- The consolidated full-year earnings forecast for FY2026 remains unchanged from the most recently published figures, projecting net sales of JPY 3,800 million, operating profit of JPY 364 million, ordinary profit of JPY 360 million, and net profit attributable to owners of parent of JPY 252 million.
- The forecast for the annual dividend per share (year-end) is JPY 38.00, with no revisions from the previous forecast.
- During the cumulative third quarter, IPS Co., Ltd. was newly included in the scope of consolidation.
🤖 AI Perspective
- The cumulative third quarter showed a year-on-year increase in both net sales and all profit categories, indicating a period of growth.
- This performance may be attributed to the company’s initiatives in cloud ERP implementation for manufacturing, smart factory support services, and cybersecurity measures.
- The fact that both the full-year consolidated earnings forecast and dividend forecast remain unchanged suggests that the company anticipates its performance to be in line with its initial plans.
2160|G-GNI
2979.0
▼ -2.49%
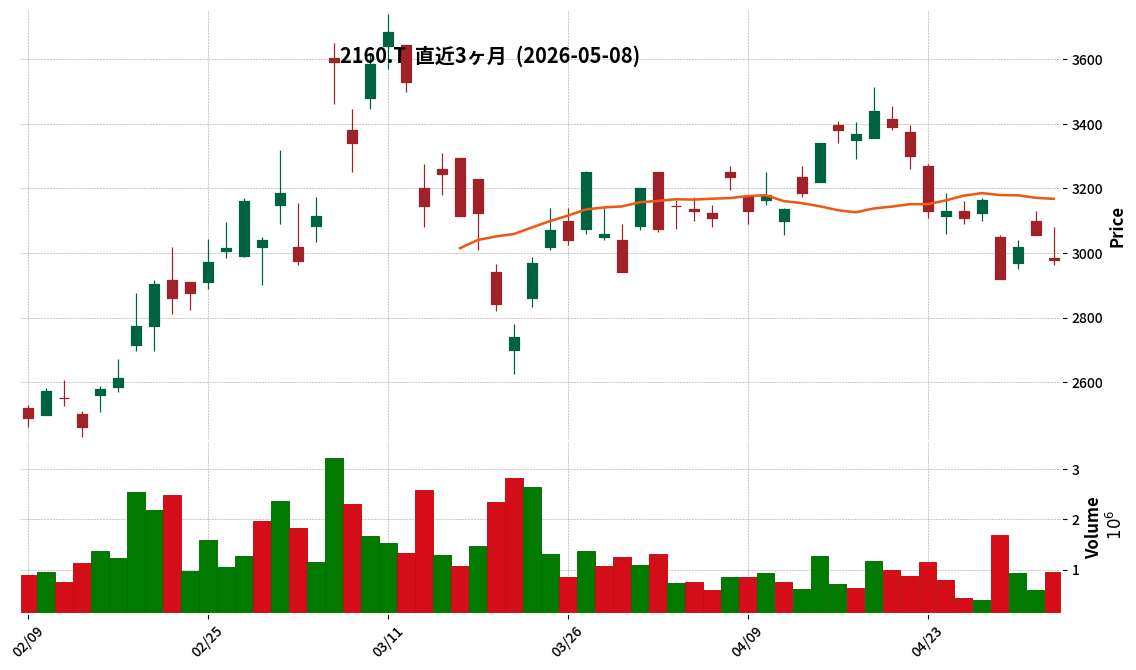
This article is an AI-generated summary and analysis of official IR disclosures.
📄 Announcement (AI-Reviewed)
- GNI Group’s subsidiary, Gyre Therapeutics, Inc., announced its financial results and business highlights for the first quarter of fiscal year 2026 (January 1 to March 31, 2026).
- During the quarter, revenue was $22.5 million (vs. $22.1 million in the prior-year period), while operating income shifted to a loss of $(9.4) million (vs. profit of $2.3 million in the prior-year period). This change was primarily driven by a $12.1 million increase in total operating expenses, including $2.5 million for Cullgen acquisition advisory fees, $2.1 million in increased Gyre stock-based compensation, $2.9 million for promotion and initial F351 commercialization activities, and $3.6 million in increased R&D expenses.
- Regarding key business progress, F351 (liver fibrosis treatment) received priority review designation from China’s National Medical Products Administration (NMPA) in March 2026, and a New Drug Application (NDA) was submitted to the China Center for Drug Evaluation (CDE) in the same month. In the U.S., Gyre plans to submit an Investigational New Drug (IND) application for F351 by the end of 2026.
- In May 2026, Gyre completed the acquisition of Cullgen Inc. for approximately $300 million in a stock-for-stock transaction, gaining Targeted Protein Degradation (TPD) inducer and Degrader Antibody Conjugate (DAC) technologies.
- Gyre Therapeutics maintains its full-year 2026 revenue guidance between $100.5 million and $111.0 million.
🤖 AI Perspective
Gyre’s Q1 2026 results show a slight revenue increase but a widened operating loss, which appears to be influenced by strategic investments such as Cullgen acquisition-related costs, initial F351 commercialization preparations, and increased R&D expenses. The advancement of F351 in China, with priority review and NDA submission, alongside plans for a U.S. IND by year-end, suggests significant progress in the pipeline development. The completion of the Cullgen acquisition and the integration of TPD technology further indicate a strategic move to broaden its therapeutic portfolio and strengthen its foundation for future growth. The market may monitor how these developments align with the company’s full-year revenue guidance.
6877|OBARA-G
5760.0
▼ -2.70%
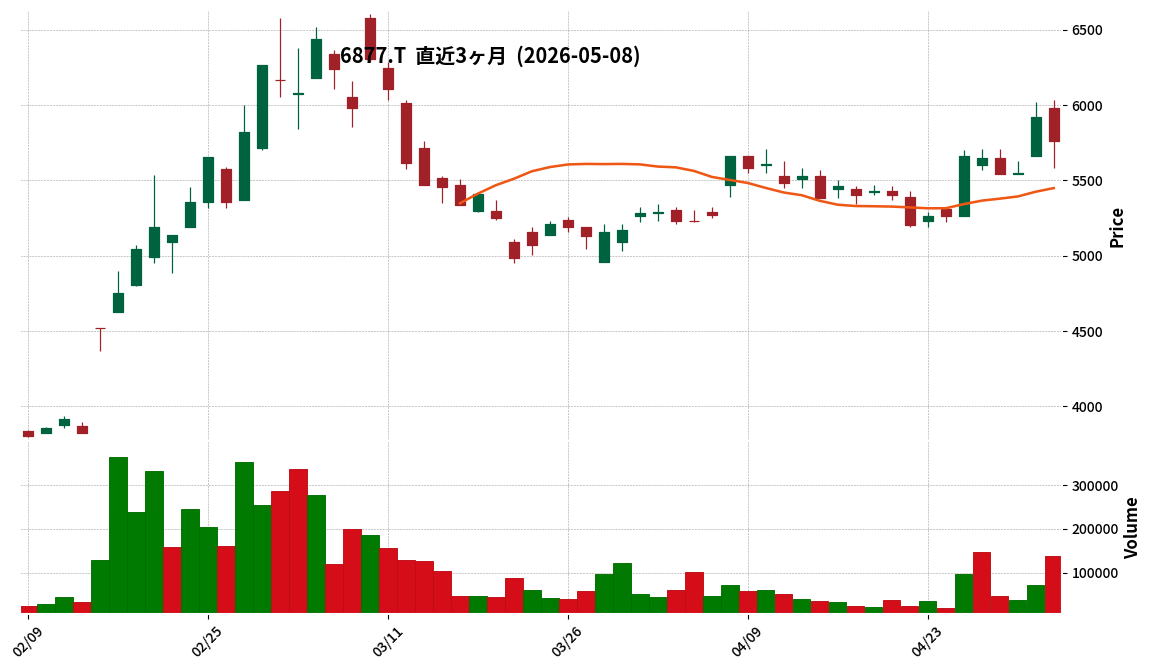
📎 Source:OBARA-G Official IR →
This article is an AI-generated summary and analysis of official IR disclosures.
📄 Announcement (AI-Reviewed)
- OBARA-G GROUP Co., Ltd. announced its consolidated financial results for the second quarter (interim) of the fiscal year ending September 2026 (October 1, 2025 – March 31, 2026).
- For the interim period, consolidated net sales reached ¥36,067 million (up 27.9% year-on-year), operating profit ¥6,033 million (up 46.8%), ordinary profit ¥6,178 million (up 40.7%), and net income attributable to owners of parent ¥3,877 million (up 31.8%).
- By segment, sales for the Welding Equipment related business were ¥20,244 million (up 18.8%), the Flat Polishing Equipment related business were ¥12,025 million (up 30.7%), and the Electrical Equipment related business were ¥3,798 million (up 93.7% compared to the second quarter’s three-month period of the previous year).
- Regarding the consolidated financial position, total assets stood at ¥104,662 million (an increase of ¥832 million from the end of the previous consolidated fiscal year), net assets were ¥74,470 million (a decrease of ¥209 million), and the equity ratio was 71.0%.
- The full-year consolidated earnings forecast for the fiscal year ending September 2026 and the dividend forecast (interim dividend ¥60.00, year-end dividend ¥90.00, total ¥150.00) remain unchanged from the most recently published figures.
🤖 AI Perspective
The interim financial results show significant increases in both sales and all profit categories. Notably, the Flat Polishing Equipment related business recorded a 101.4% year-on-year increase in operating profit, suggesting robust performance across various business segments. While the full-year earnings forecast remains unchanged, the market will likely monitor future market conditions and the achievement of business plans for the latter half of the fiscal year.
9973|KOZOHD
25.0
▲ +0.00%
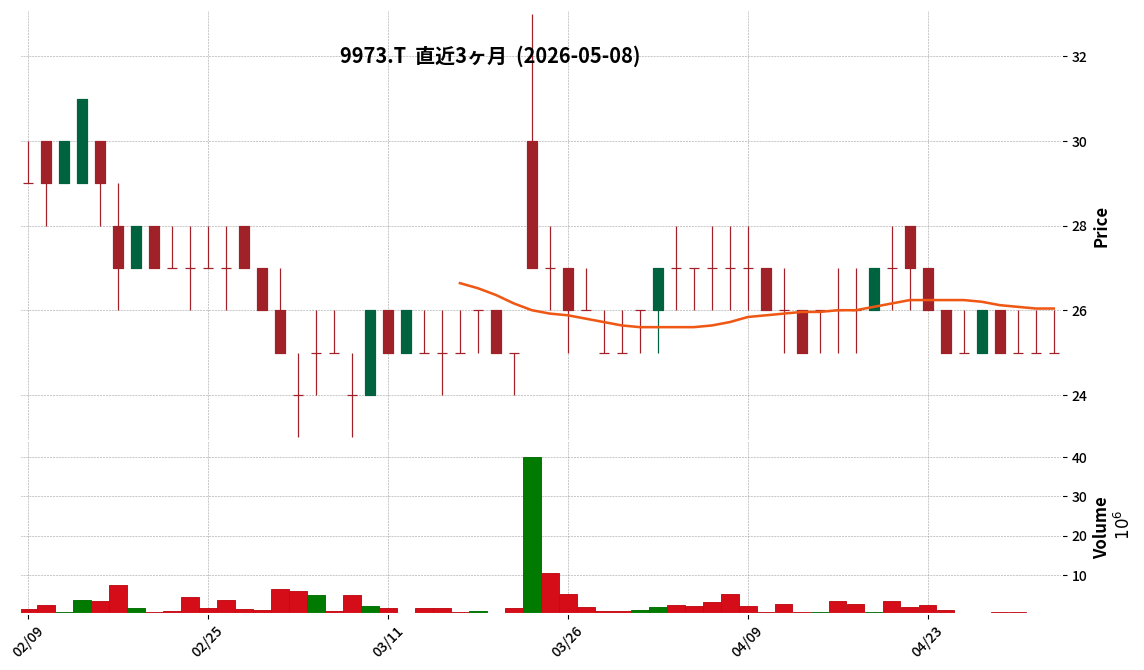
This article is an AI-generated summary and analysis of official IR disclosures.
📄 Announcement (AI-Reviewed)
- For the first quarter of the fiscal year ending December 2026, consolidated net sales were ¥4,923 million, an increase of 6.5% compared to the same period in the previous year.
- Consolidated operating loss for the quarter was ¥-66 million, ordinary loss was ¥-47 million, and net loss attributable to owners of the parent was ¥-56 million, indicating a wider deficit compared to the previous year’s losses.
- As of the end of the first quarter of the fiscal year ending December 2026, consolidated net assets amounted to ¥616 million (an increase of ¥220 million from the end of December 2025), and the equity ratio was 10.9% (an increase of 4.3 percentage points from the end of December 2025).
- The full-year consolidated earnings forecast for the fiscal year ending December 2026 remains unchanged, with projected net sales of ¥20,500 million, operating income of ¥102 million, ordinary income of ¥102 million, and net income attributable to owners of the parent of ¥52 million.
- Effective from the first quarter of the current consolidated accounting period, the “Retail Business” segment has been renamed “Retail and Sales Business,” Delis Co., Ltd. has been reclassified into this segment, and a new “Overseas Business” segment has been established.
🤖 AI Perspective
While the company reported an increase in net sales year-over-year, the widening losses at the operating, ordinary, and net income levels are notable. Concurrently, an improvement in net assets and the equity ratio suggests ongoing efforts to strengthen the financial foundation. The unchanged full-year earnings forecast indicates management’s anticipation of recovery in subsequent quarters, which may be a key point for investors to monitor.
3083|スターシーズ
1162.0
▼ -0.26%
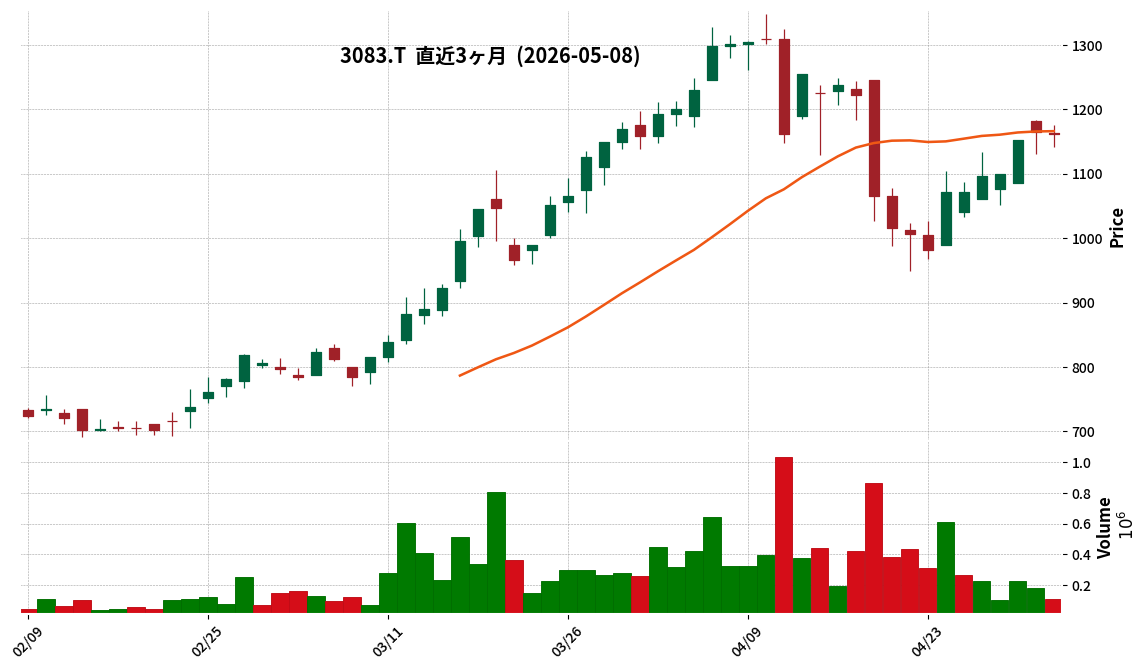
This article is an AI-generated summary and analysis of official IR disclosures.
📄 Announcement (AI-Reviewed)
- Starseeds reported consolidated results for the fiscal year ended February 2026, with net sales of ¥10,382 million (up 103.2% year-on-year), operating profit of ¥184 million, ordinary profit of ¥160 million, and profit attributable to owners of parent of ¥58 million, turning profitable from a loss in the previous year.
- The year-end dividend for the fiscal year ended February 2026 was ¥10.00 per share, consisting of an ordinary dividend of ¥5.00 and a commemorative dividend of ¥5.00 for the start of new businesses.
- For the fiscal year ending February 2027, the company forecasts consolidated net sales of ¥26,000 million (up 159.5% year-on-year), operating profit of ¥1,100 million (up 452.7%), ordinary profit of ¥900 million (up 414.2%), and profit attributable to owners of parent of ¥500 million (up 693.6%).
- The company transitioned to a holding company structure, succeeding the select apparel sales business and branded apparel sales business through a spin-off. In addition to the existing “apparel and related business,” Starseeds also commenced new “grid-scale battery storage business” and “GPU server business.”
🤖 AI Perspective
Starseeds’ consolidated financial results for the fiscal year ended February 2026 show a significant revenue increase and a return to profitability, which may suggest a positive impact from its business restructuring and entry into new ventures. The shift to a holding company structure and the initiation of the “grid-scale battery storage business” and “GPU server business” could be seen as pivotal strategic moves for future value creation. The substantial growth projected for the fiscal year ending February 2027 indicates that these new businesses are expected to be key drivers for future performance.
8158|ソーダニッカ
1045.0
▲ +0.87%
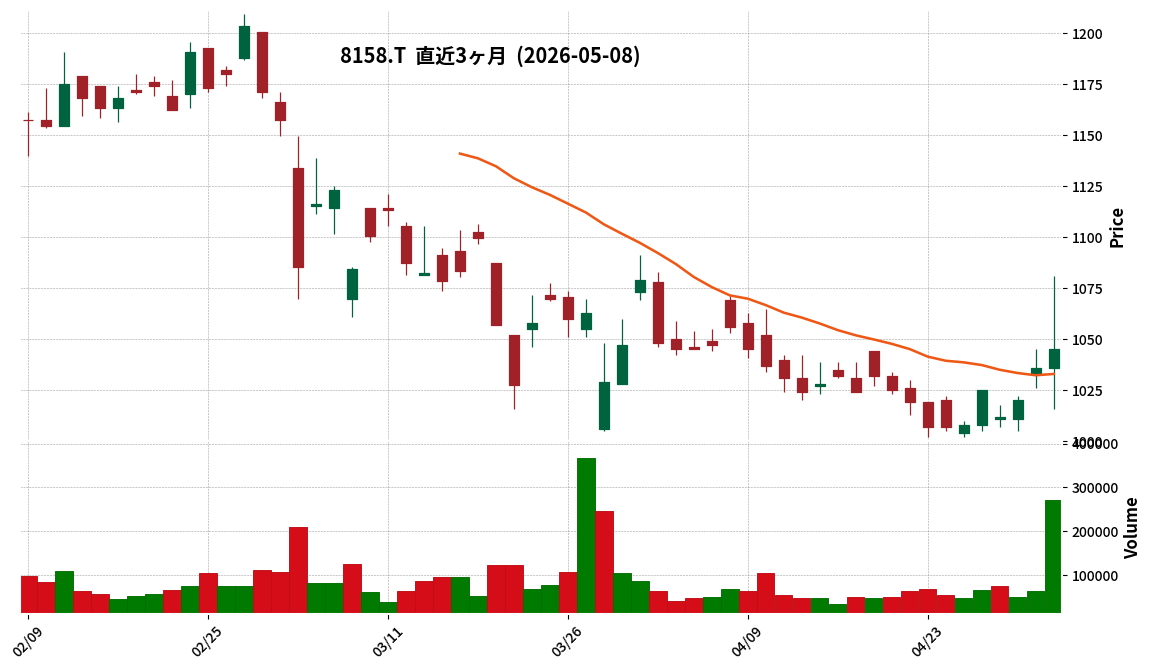
This article is an AI-generated summary and analysis of official IR disclosures.
📄 Announcement (AI-Reviewed)
- SodaniCCA Co., Ltd. announced on May 8, 2024, a partial correction to its “FY2026 March Earnings Presentation Material.”
- The correction involves the “Fluctuation Factors” section of the consolidated balance sheet on page 7, where the net assets section was revised from “+4,157” to “+4,239.”
- Additionally, the estimated dividend payout ratio for FY2027 March, detailed on page 10 under “Shareholder Return Status,” was corrected from “40.2%” to “41.0%.”
- The company stated that the reason for these corrections was an error during the preparation process.
🤖 AI Perspective
- This correction indicates an error in the initially disclosed figures within the earnings presentation material.
- The upward revision of the consolidated net assets and, specifically, the estimated dividend payout ratio for FY2027 March, could be of interest to investors evaluating the company’s financial health and shareholder return policy.
- These adjustments may prompt investors to re-examine the underlying financial soundness and commitment to shareholder returns.
2678|アスクル
1172.0
▼ -1.68%
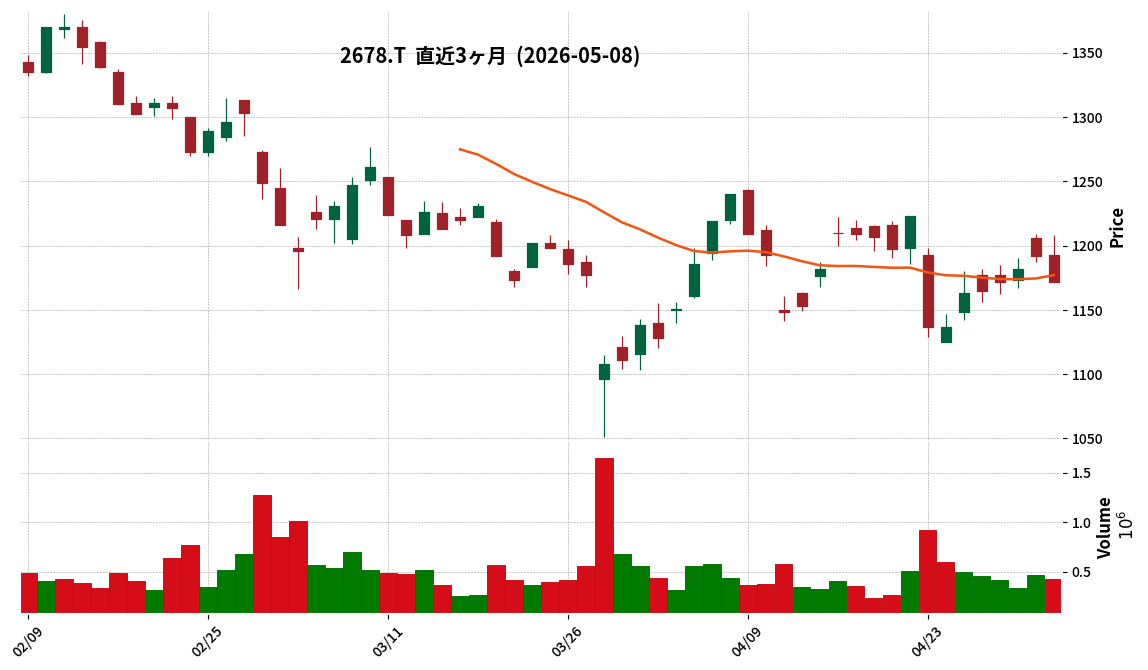
This article is an AI-generated summary and analysis of official IR disclosures.
📄 Announcement (AI-Reviewed)
- ASKUL Corporation announced on May 8, 2026, that information regarding ASKUL was included in the presentation materials for the full-year FY2025 and Q4 financial results released by LINE Yahoo Japan Corporation, an affiliated company.
- According to the materials released by LINE Yahoo, ASKUL’s BtoB business (via internet) sales (e-commerce GMV) for the full-year FY2025 (April 1, 2025 – March 31, 2026) reached ¥1,866.0 billion, an increase of 6.6% from ¥1,750.6 billion in the previous fiscal year.
- The same document reported ASKUL’s consolidated operating profit for the full-year FY2025 as ¥16.7 billion, showing an improvement from an operating loss of -¥17.6 billion in the previous fiscal year.
- ASKUL Corporation explicitly stated that its consolidated accounting period differs from LINE Yahoo Japan Corporation’s, and their accounting standards also differ (ASKUL uses Japanese GAAP, while LINE Yahoo uses IFRS). Therefore, the figures related to ASKUL in LINE Yahoo’s materials do not align with ASKUL’s publicly announced financial results.
- As of March 31, 2026, LINE Yahoo Japan Corporation’s fair market value of ASKUL shares held was stated as ¥46.8 billion.
🤖 AI Perspective
ASKUL’s disclosure of company-related information from LINE Yahoo’s financial results is considered important for investors to gain a multifaceted understanding of ASKUL’s performance, given LINE Yahoo’s status as a key affiliate. The differences in accounting periods and standards between the two companies suggest that the ASKUL-related figures in LINE Yahoo’s materials should be viewed as supplementary information, requiring caution when comparing them with ASKUL’s independently published financial results. The growth in BtoB business GMV and the improvement in operating profit, from LINE Yahoo’s perspective, could indicate trends in ASKUL’s business operations that are worth monitoring.
💡 Start investing with IR insights
※ 本ページには広告が含まれます(PR)
Disclaimer: This article is for informational purposes only and does not constitute investment advice. All investment decisions are at your own risk.

コメント